. 2024 Oct 10;22(1):922.
doi: 10.1186/s12967-024-05707-5.

KLF4 regulates trophoblast function and associates with unexplained recurrent spontaneous abortion

Affiliations

KLF4 regulates trophoblast function and associates with unexplained recurrent spontaneous abortion

Yiling Tan et al. J Transl Med. .

Abstract

Background: Recurrent spontaneous abortion (RSA) is defined as two or more consecutive spontaneous abortions before 20 weeks with the same spouse [1]. However, approximately 50% of RSA cases of unknown cause are classified as unexplained recurrent spontaneous abortion (URSA). Potential factors include decreased trophoblast cell migration and invasion, leading to impaired placental implantation and maintenance of the normal maternal-fetal interface. However, the mechanism of this pathogenesis remains unknown. In this study, we investigated the potential role and mechanism of KLF4 in regulating URSA by influencing the invasion and migration ability of trophoblast cells.

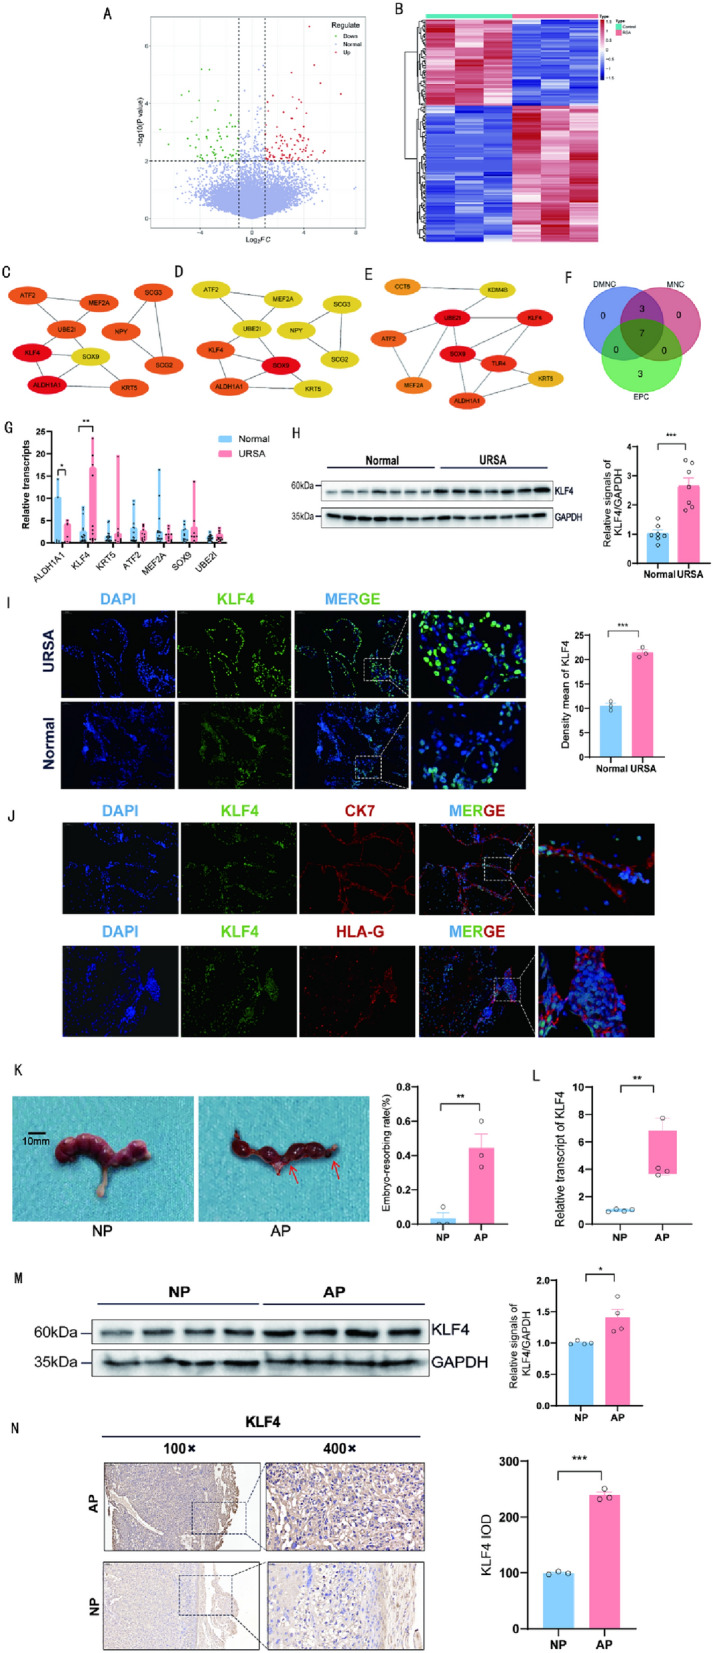
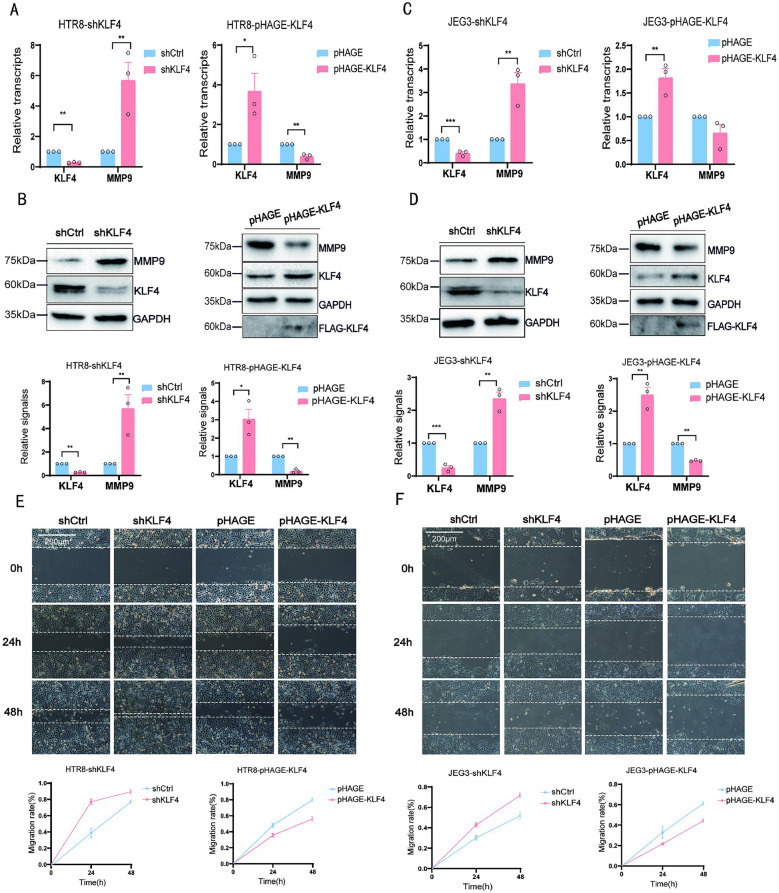
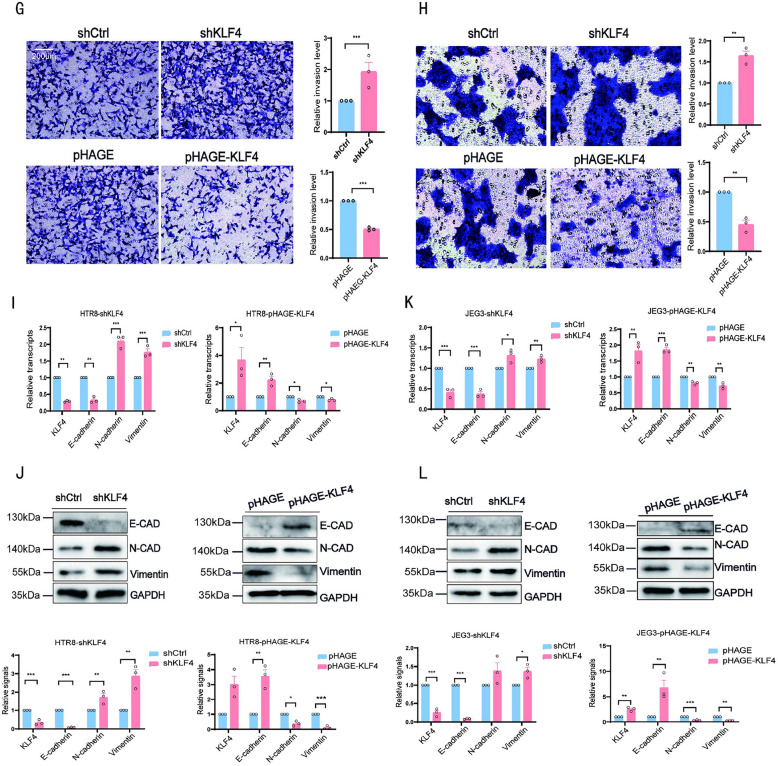
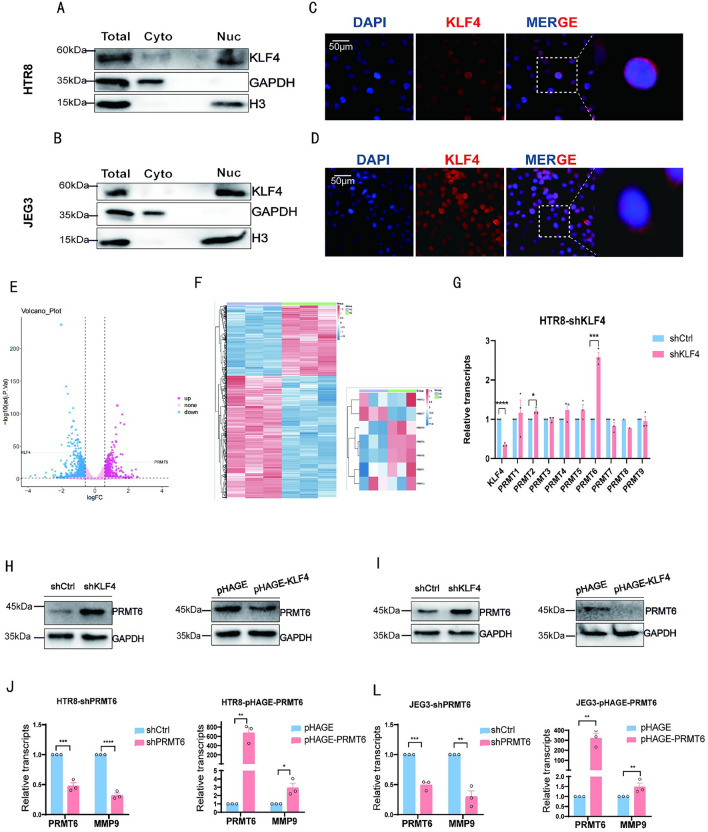
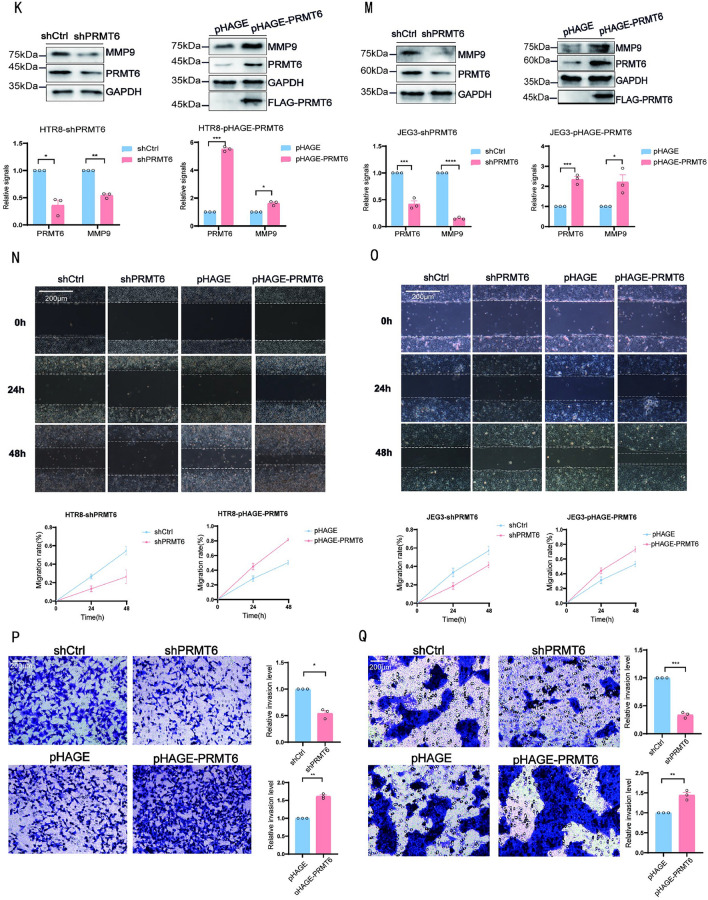
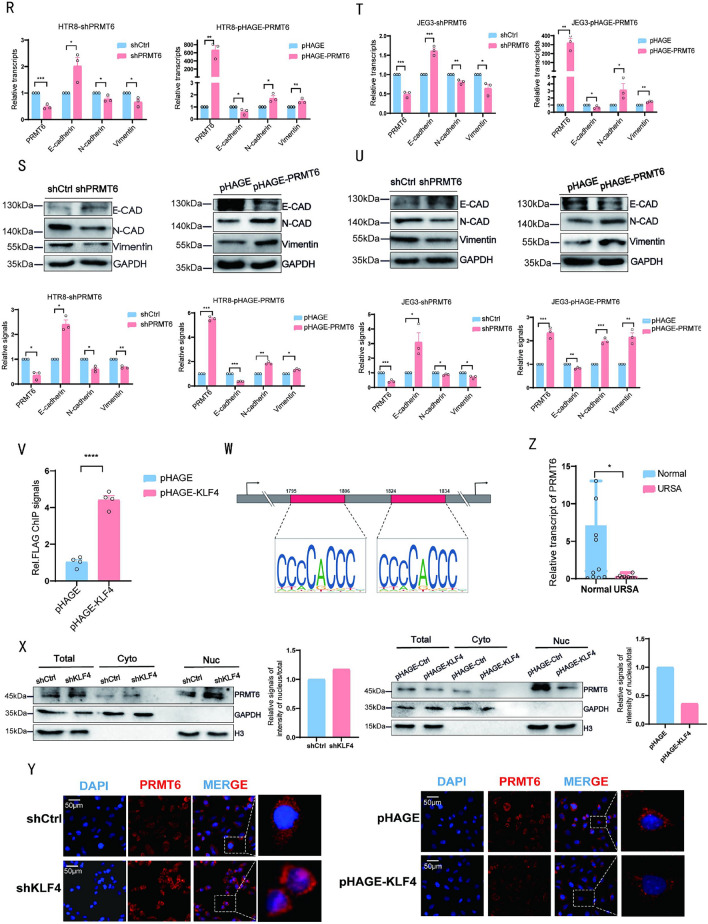
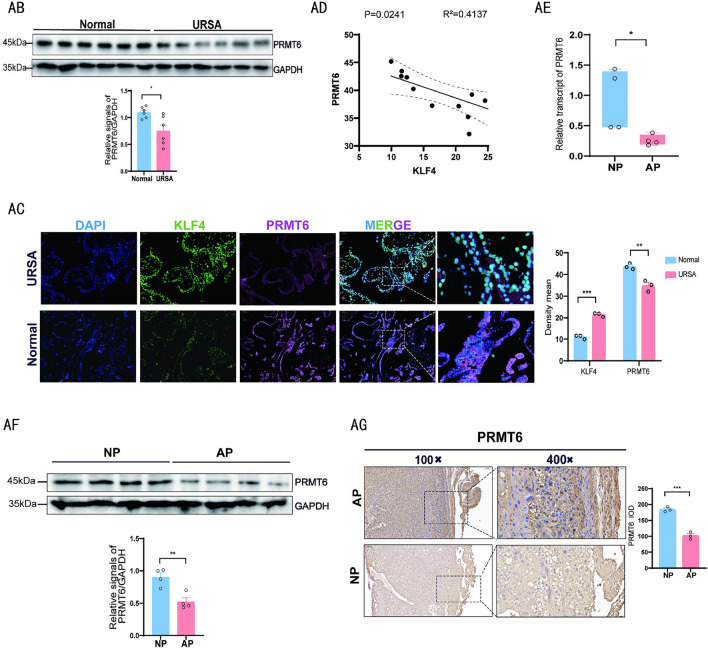
Methods: We firstly identified 817 differentially expressed genes by performing a difference analysis of the dataset GSE121950 [2] related to recurrent abortion, and intersected the top 10 genes obtained respectively by the three algorithms: DMNC, MNC, and EPC using Venn Diagram.To detect the expression levels of core genes, villi samples were obtained from normal pregnant women and patients with URSA. RT-qPCR analysis revealed a significant difference in KLF4 mRNA expression and KLF4 was then analyzed. Trophoblast cell lines HTR8 and JEG3 were used to investigate the effect of KLF4 on trophoblastic function. Wound healing and transwell assays was performed to detect the invasion and migration of trophoblast cells. The expression of epithelial-mesenchymal transition(EMT) molecules were detected by RT-qPCR and western blot. Promoter detection and epigenetic modification were detected by chromatin immunoprecipitation (ChIP) assay. Molecular nuclear localization was detected by immunofluorescence and subcellular fractionation. Miscarried mice model was used to study the effects of KLF4 on URSA induced by reduced trophoblast invasion and migration.

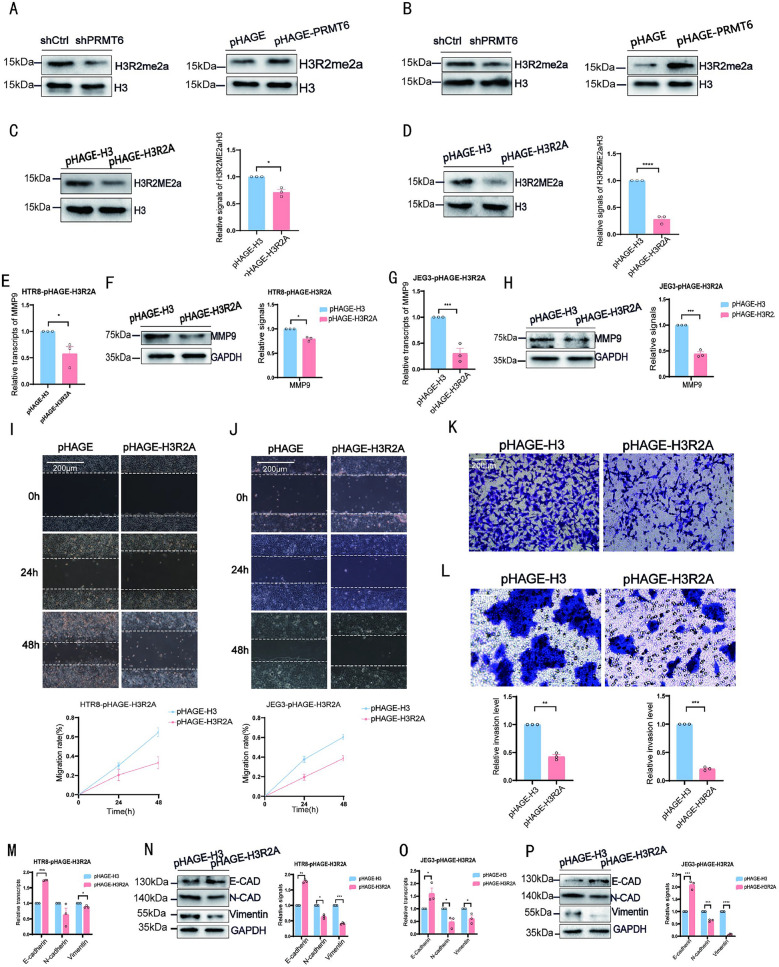
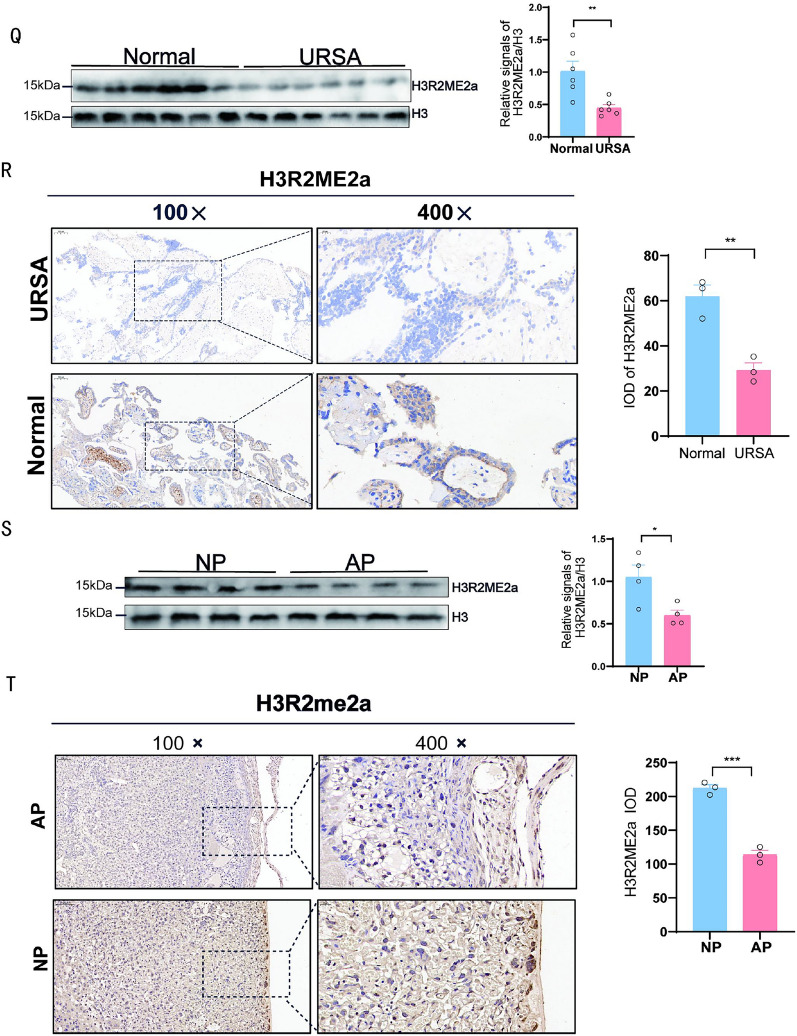
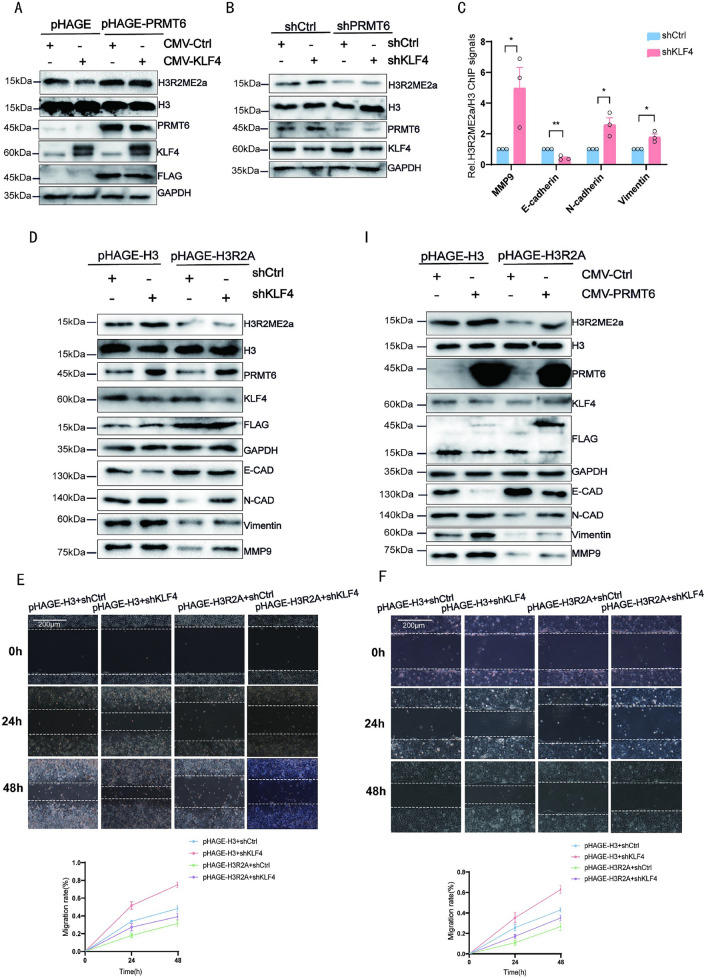
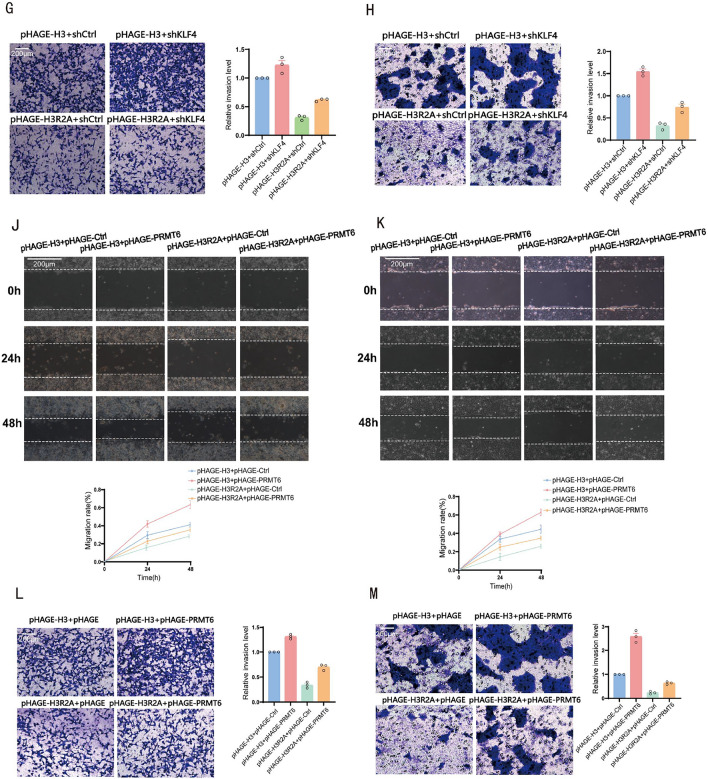
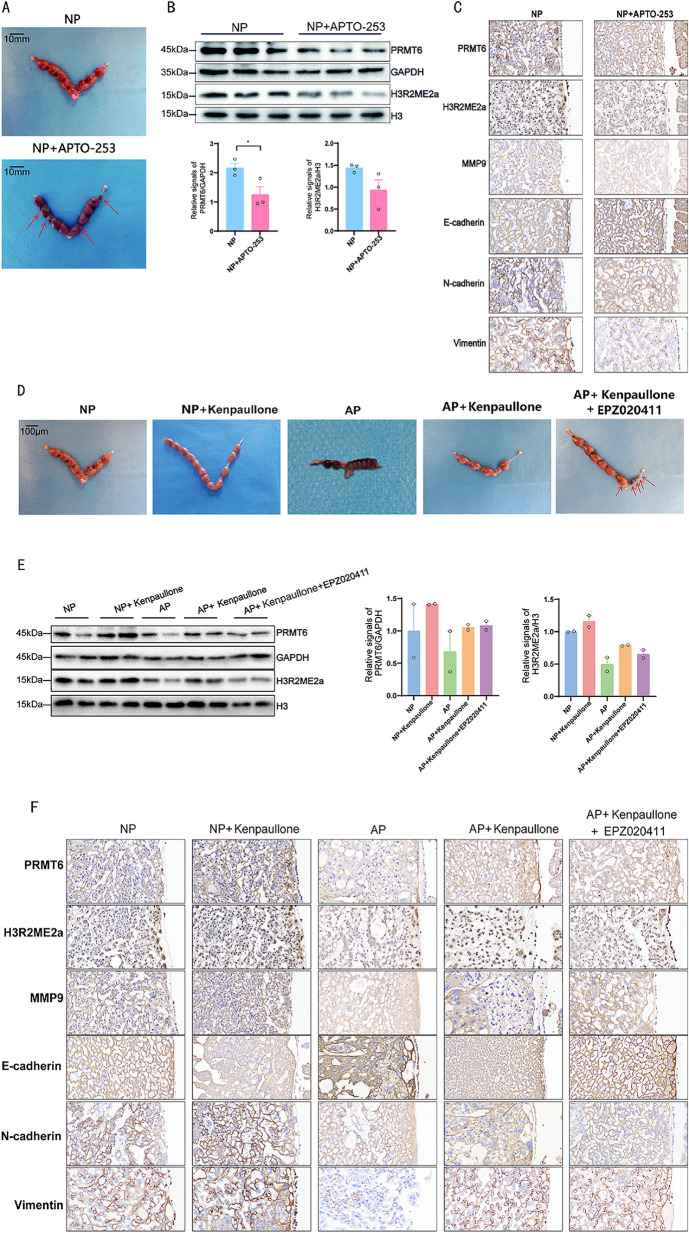
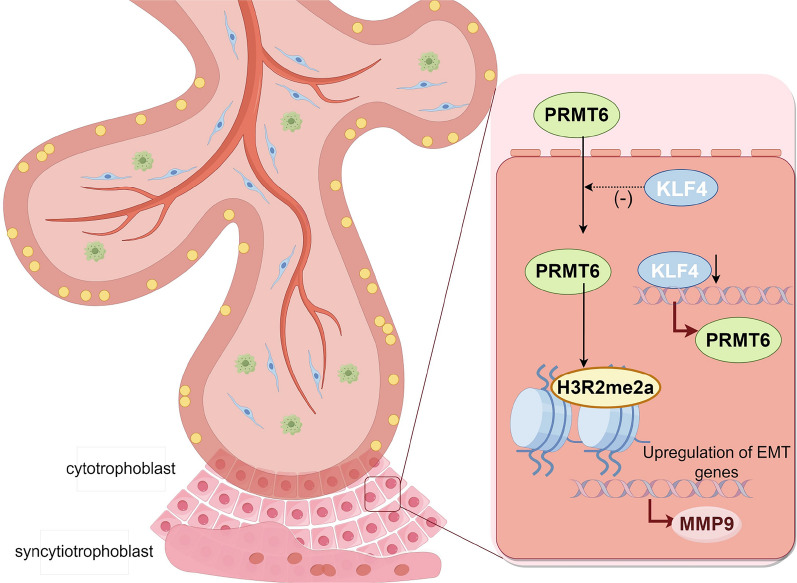
Results: KLF4 is highly expressed in the villi of patients with URSA. KLF4 inhibits the expression level of H3R2ME2a in trophoblast cells by regulating the transcriptional level and nuclear translocation of PRMT6, thereby inhibiting the possible regulatory mechanism of trophoblastic invasion and providing a potential treatment strategy for URSA in vivo.

Conclusions: The KLF4/PRMT6/H3R2ME2a axis regulates mechanisms associated with unexplained recurrent spontaneous abortion by regulating trophoblast function.

Keywords: H3R2ME2a; KLF4; PRMT6; Trophoblast invasion; Unexplained recurrent spontaneous abortion.


Conflict of interest statement

The authors declare no competing interests.

Figures

Fig. 1
Fig. 1
KLF4 expression is up-regulated in the villus tissue of URSA patients and placenta of miscarried mice. A Volcano plots showed significantly different expression genes of villus in normal pregnant women (n = 3) and URSA pregnant women (n = 3) in dataset GSE121950.The screening condition was set as ∣log2FC∣> 1 and P value < 0.05. B The heat map shows the top 100 genes with the most significant differences. CE Three algorithms, DMNC, MNC and EPC, were used to analyze the topology algorithm of the different genes. F The top ten genes obtained by the three algorithms are intersected by the Venn diagram, and 7 core genes are obtained. G The mRNA expression of 7 core genes in villus tissues of normal pregnant women (n = 20) and URSA pregnant women (n = 12) were detected by qPCR. H The expression of KLF4 protein in chorionic villus of normal pregnancy patients (n = 7) and URSA patients (n = 7) was determined by western blot. The protein imprinting strength was quantified using ImageJ software. I The expressions of KLF4 protein in villi of normal pregnancy patients (n = 3) and URSA patients (n = 3) were determined by immunofluorescence. The fluorescence staining intensity was quantified by ImageJ software. J Representative immunofluorescence images: double immune-staining of CK7 (red) and KLF4 (green); double immune-staining of HLA-G (red) and KLF4 (green) K The embryo absorption rate of normal pregnancy (NP) and aborted pregnancy (AP) mice at day 13.5 of gestation was calculated, which was defined as the number of resorbed embryos / (number of resorbed embryos + number of fetuses surviving) × 100%. LN In NP group (n = 4) and AP group (n = 4), the expression of KLF4 was determined by qPCR, western blot and immunohistochemistry of placental tissue sections. ImageJ software was used to quantitatively analyze the imprinting strength and the relative absorbance of immunohistochemistry
Fig. 2
Fig. 2
KLF4 inhibits trophoblast migration, invasion, and epithelial-mesenchymal transformation(EMT) AE HTR8 and JEG3 cell lines with stable knocked down or overexpression of KLF4 were constructed, and the levels of invasion and migration marker MMP9 were determined by qPCR and western blot, and the imprinting strength of the protein was quantitatively analyzed by ImageJ software. E, F Wound healing scratches were imaged immediately, 24 h and 48 h after initial scratch time to quantify relative migration, quantifying relative migration using ImageJ software. G, H HTR8 cells and JEG3 cells were suspended in serum-free medium and then inoculated into an insertion chamber pre-coated with diluted matrix gel and incubated for 48 h for invasion determination. Cells at the lower surface of the membrane were counted and analyzed under a light microscope in three random fields of view. The staining intensity was quantified using the ImageJ software. I, L The expression levels of E-cadherin, N-cadherin and vimentin markers of epithelial mesenchymal transformation in trophoblast cells with knockdown or overexpression of KLF4 were measured by qPCR and western blot, and the imprinting strength of proteins was quantitatively analyzed by ImageJ software
Fig. 2
Fig. 2
KLF4 inhibits trophoblast migration, invasion, and epithelial-mesenchymal transformation(EMT) AE HTR8 and JEG3 cell lines with stable knocked down or overexpression of KLF4 were constructed, and the levels of invasion and migration marker MMP9 were determined by qPCR and western blot, and the imprinting strength of the protein was quantitatively analyzed by ImageJ software. E, F Wound healing scratches were imaged immediately, 24 h and 48 h after initial scratch time to quantify relative migration, quantifying relative migration using ImageJ software. G, H HTR8 cells and JEG3 cells were suspended in serum-free medium and then inoculated into an insertion chamber pre-coated with diluted matrix gel and incubated for 48 h for invasion determination. Cells at the lower surface of the membrane were counted and analyzed under a light microscope in three random fields of view. The staining intensity was quantified using the ImageJ software. I, L The expression levels of E-cadherin, N-cadherin and vimentin markers of epithelial mesenchymal transformation in trophoblast cells with knockdown or overexpression of KLF4 were measured by qPCR and western blot, and the imprinting strength of proteins was quantitatively analyzed by ImageJ software
Fig. 3
Fig. 3
KLF4 inhibited PRMT6 transcription and nuclear translocation. A, B Western blot was performed to compare the levels of KLF4 in the nucleus and cytoplasm. Histone H3 was used as a nuclear marker and GAPDH was used as a cytoplasmic marker. C, D HTR8 and JEG3 cells were inoculated on cell slides for immunofluorescence staining, with KLF4 in red and DAPI in blue, to evaluate the subcellular localization of KLF4. The images were taken with a Zeiss confocal microscope at 40x. E Total RNA was isolated from control and KLF4 knockdown HTR8 cells, and RNA-seq analysis was performed. The threshold ∣log2FC∣>0.75 and P value < 0.05 were used to display the differentially significant genes on volcano map. F Heat maps showing genes with significant differences. G The expression of PRMT family 1–9 in HTR8 cells with KLF4 knockdown was analyzed by qPCR. H, I The protein expression level of PRMT6 in trophoblast cell lines with knockdown and overexpression of KLF4 was determined by western blot. JM HTR8 and JEG3 cell lines with stable knocked down or overexpression of PRMT6 were constructed, and the levels of invasion and migration marker MMP9 were determined by qPCR and western blot. The protein imprinting strength was quantitatively analyzed by ImageJ software. N, O Wound healing scratches were imaged immediately, 24 h and 48 h after initial scratch time to quantify relative migration, quantifying relative migration using ImageJ software. P, Q HTR8 cells and JEG3 cells were suspended in serum-free medium and then inoculated into an insertion chamber pre-coated with diluted matrix gel and incubated for 48 h for invasion determination. Cells at the lower surface of the membrane were counted and analyzed under a light microscope in three random fields of view. The staining intensity was quantified using the ImageJ software. R–U The expression levels of E-cadherin, N-cadherin and vimentin markers of epithelial mesenchymal transformation in trophoblast cells with PRMT6 knockdown or overexpression were determined by qPCR and western blot. The imprinting strength of proteins was quantitatively analyzed by ImageJ software. V The KLF4 occupancy of PRMT6 promoter in HTR8 cells of control group and PRMT6 overexpression group was analyzed by ChIP-qPCR. W Predicting KLF4 in PRMT6 promoter specific binding sites for − 1806~-1795 by IBS2.0 and JASPAR database (https://jaspar.genereg.net/)(Table S4). X Karyoplasmic separation experiments were performed on HTR8 cell lines with KLF4 knockdown and KLF4 overexpression respectively. Histone H3 was used as a nuclear marker and GAPDH was used as a cytoplasmic marker by protein immunoimprinting to detect the expression of PRMT6 in each cell component. Y HTR8 cell lines were inoculated on cell slides for immunofluorescence staining, with PRMT6 in red and DAPI in blue, to evaluate the subcellular localization of PRMT6. The images were taken with a Zeiss confocal microscope at 40x. Z The mRNA expression of PRMT6 in villus tissues of normal pregnant women (n = 20) and URSA pregnant women (n = 12) were detected by qPCR.(AB)The expression of PRMT6 protein in chorionic villus of normal pregnancy patients (n = 7) and URSA patients (n = 7) was determined by western blot. The protein imprinting strength was quantified using ImageJ software.(AC) The expressions of PRMT6(pink) protein and KLF4(green) protein in villi of normal pregnancy patients (n = 3) and URSA patients (n = 3) were determined by immunofluorescence. The fluorescence staining intensity was quantified by ImageJ software.(AD)The correlation between PRMT6 and KLF4 protein expression levels was calculated by correlation analysis of immunofluorescence staining intensity in tissue sections.(AE-AG)In NP group (n = 4) and AP group (n = 4), the expression of PRMT6 was determined by qPCR, western blot and immunohistochemistry of placental tissue sections. ImageJ software was used to quantitatively analyze the imprinting strength and the relative absorbance of immunohistochemistry
Fig. 3
Fig. 3
KLF4 inhibited PRMT6 transcription and nuclear translocation. A, B Western blot was performed to compare the levels of KLF4 in the nucleus and cytoplasm. Histone H3 was used as a nuclear marker and GAPDH was used as a cytoplasmic marker. C, D HTR8 and JEG3 cells were inoculated on cell slides for immunofluorescence staining, with KLF4 in red and DAPI in blue, to evaluate the subcellular localization of KLF4. The images were taken with a Zeiss confocal microscope at 40x. E Total RNA was isolated from control and KLF4 knockdown HTR8 cells, and RNA-seq analysis was performed. The threshold ∣log2FC∣>0.75 and P value < 0.05 were used to display the differentially significant genes on volcano map. F Heat maps showing genes with significant differences. G The expression of PRMT family 1–9 in HTR8 cells with KLF4 knockdown was analyzed by qPCR. H, I The protein expression level of PRMT6 in trophoblast cell lines with knockdown and overexpression of KLF4 was determined by western blot. JM HTR8 and JEG3 cell lines with stable knocked down or overexpression of PRMT6 were constructed, and the levels of invasion and migration marker MMP9 were determined by qPCR and western blot. The protein imprinting strength was quantitatively analyzed by ImageJ software. N, O Wound healing scratches were imaged immediately, 24 h and 48 h after initial scratch time to quantify relative migration, quantifying relative migration using ImageJ software. P, Q HTR8 cells and JEG3 cells were suspended in serum-free medium and then inoculated into an insertion chamber pre-coated with diluted matrix gel and incubated for 48 h for invasion determination. Cells at the lower surface of the membrane were counted and analyzed under a light microscope in three random fields of view. The staining intensity was quantified using the ImageJ software. R–U The expression levels of E-cadherin, N-cadherin and vimentin markers of epithelial mesenchymal transformation in trophoblast cells with PRMT6 knockdown or overexpression were determined by qPCR and western blot. The imprinting strength of proteins was quantitatively analyzed by ImageJ software. V The KLF4 occupancy of PRMT6 promoter in HTR8 cells of control group and PRMT6 overexpression group was analyzed by ChIP-qPCR. W Predicting KLF4 in PRMT6 promoter specific binding sites for − 1806~-1795 by IBS2.0 and JASPAR database (https://jaspar.genereg.net/)(Table S4). X Karyoplasmic separation experiments were performed on HTR8 cell lines with KLF4 knockdown and KLF4 overexpression respectively. Histone H3 was used as a nuclear marker and GAPDH was used as a cytoplasmic marker by protein immunoimprinting to detect the expression of PRMT6 in each cell component. Y HTR8 cell lines were inoculated on cell slides for immunofluorescence staining, with PRMT6 in red and DAPI in blue, to evaluate the subcellular localization of PRMT6. The images were taken with a Zeiss confocal microscope at 40x. Z The mRNA expression of PRMT6 in villus tissues of normal pregnant women (n = 20) and URSA pregnant women (n = 12) were detected by qPCR.(AB)The expression of PRMT6 protein in chorionic villus of normal pregnancy patients (n = 7) and URSA patients (n = 7) was determined by western blot. The protein imprinting strength was quantified using ImageJ software.(AC) The expressions of PRMT6(pink) protein and KLF4(green) protein in villi of normal pregnancy patients (n = 3) and URSA patients (n = 3) were determined by immunofluorescence. The fluorescence staining intensity was quantified by ImageJ software.(AD)The correlation between PRMT6 and KLF4 protein expression levels was calculated by correlation analysis of immunofluorescence staining intensity in tissue sections.(AE-AG)In NP group (n = 4) and AP group (n = 4), the expression of PRMT6 was determined by qPCR, western blot and immunohistochemistry of placental tissue sections. ImageJ software was used to quantitatively analyze the imprinting strength and the relative absorbance of immunohistochemistry
Fig. 4
Fig. 4
PRMT6 inhibited the level of asymmetric methylation of arginine at histone H3R2 site. A, B The expression levels of H3R2ME2a in trophoblast cell lines with knockdown and overexpression of PRMT6 were determined respectively by western blot. C, D HTR8 and JEG3 cell lines mutated at H3R2 site were constructed, and the expression level of mutant H3R2ME2a was verified by western blot.The protein imprinting strength was quantitatively analyzed by ImageJ software. EH The levels of invasion and migration marker MMP9 in mutant trophoblast cell line at H3R2 site were determined by qPCR and western blot. The protein imprinting strength was quantitatively analyzed by ImageJ software. I, J Wound healing scratches were imaged immediately, 24 h and 48 h after initial scratch time to quantify relative migration, quantifying relative migration using ImageJ software. K, L HTR8 cells and JEG3 cells were suspended in serum-free medium and then inoculated into an insertion chamber pre-coated with diluted matrix gel and incubated for 48 h for invasion determination. Cells at the lower surface of the membrane were counted and analyzed under a light microscope in three random fields of view. The staining intensity was quantified using the ImageJ software. MP The expression levels of E-cadherin, N-cadherin and vimentin markers of epithelial mesenchymal transformation in mutant trophoblast cell line at H3R2 site were determined by qPCR and western blot. The imprinting strength of proteins was quantitatively analyzed by ImageJ software. Q The expression of H3R2ME2a protein in chorionic villus of normal pregnancy patients (n = 7) and URSA patients (n = 7) was determined by western blot. The protein imprinting strength was quantified using ImageJ software. R The expressions of H3R2ME2a protein in villi of normal pregnancy patients (n = 3) and URSA patients (n = 3) were determined by immunohistochemical. The staining intensity was quantified by ImageJ software. S-T In NP group (n = 4) and AP group (n = 4), the expression of H3R2ME2a was determined by western blot and immunohistochemistry of placental tissue sections. ImageJ software was used to quantitatively analyze the imprinting strength and the relative absorbance of immunohistochemistry
Fig. 4
Fig. 4
PRMT6 inhibited the level of asymmetric methylation of arginine at histone H3R2 site. A, B The expression levels of H3R2ME2a in trophoblast cell lines with knockdown and overexpression of PRMT6 were determined respectively by western blot. C, D HTR8 and JEG3 cell lines mutated at H3R2 site were constructed, and the expression level of mutant H3R2ME2a was verified by western blot.The protein imprinting strength was quantitatively analyzed by ImageJ software. EH The levels of invasion and migration marker MMP9 in mutant trophoblast cell line at H3R2 site were determined by qPCR and western blot. The protein imprinting strength was quantitatively analyzed by ImageJ software. I, J Wound healing scratches were imaged immediately, 24 h and 48 h after initial scratch time to quantify relative migration, quantifying relative migration using ImageJ software. K, L HTR8 cells and JEG3 cells were suspended in serum-free medium and then inoculated into an insertion chamber pre-coated with diluted matrix gel and incubated for 48 h for invasion determination. Cells at the lower surface of the membrane were counted and analyzed under a light microscope in three random fields of view. The staining intensity was quantified using the ImageJ software. MP The expression levels of E-cadherin, N-cadherin and vimentin markers of epithelial mesenchymal transformation in mutant trophoblast cell line at H3R2 site were determined by qPCR and western blot. The imprinting strength of proteins was quantitatively analyzed by ImageJ software. Q The expression of H3R2ME2a protein in chorionic villus of normal pregnancy patients (n = 7) and URSA patients (n = 7) was determined by western blot. The protein imprinting strength was quantified using ImageJ software. R The expressions of H3R2ME2a protein in villi of normal pregnancy patients (n = 3) and URSA patients (n = 3) were determined by immunohistochemical. The staining intensity was quantified by ImageJ software. S-T In NP group (n = 4) and AP group (n = 4), the expression of H3R2ME2a was determined by western blot and immunohistochemistry of placental tissue sections. ImageJ software was used to quantitatively analyze the imprinting strength and the relative absorbance of immunohistochemistry
Fig. 5
Fig. 5
KLF4 regulates the level of H3R2ME2a by regulating PRMT6, and then regulates the biological behaviors of trophoblast cells such as invasion, migration and EMT The protein level of H3R2ME2a in the control group, the over-expressing KLF4 group, the over-expressing PRMT6 group, and both overexpressing KLF4 and PRMT6 group detected by western blot. The protein level of H3R2ME2a in the control group, the knockdown KLF4 group, the knockdown PRMT6 group, and both knockdown KLF4 and PRMT6 group detected by western blot. C The H3R2ME2a concentrations of MMP9, E-cadherin, N-cadherin and vimentin promoters in HTR8 with KLF4 knockdown were analyzed by ChIP-qPCR. D The protein level of H3R2ME2a and invasion and migration related proteins MMP9 and EMT-related proteins E-cadherin, N-cadherin and vimentin in control group, knockdown KLF4 group, H3R2 site mutant, and simultaneously knockdown KLF4 group and mutation H3R2 site HTR8 cell line by western blot. E, F Wound healing scratches were imaged immediately, 24 h and 48 h after initial scratch time to quantify relative migration, quantifying relative migration using ImageJ software. G, H HTR8 cells and JEG3 cells were suspended in serum-free medium and then inoculated into an insertion chamber pre-coated with diluted matrix gel and incubated for 48 h for invasion determination. Cells at the lower surface of the membrane were counted and analyzed under a light microscope in three random fields of view. The staining intensity was quantified using the ImageJ software. I The protein level of H3R2ME2a and invasion and migration related proteins MMP9 and EMT-related proteins E-cadherin, N-cadherin and vimentin in control group, over-expressing PRMT6 group, H3R2 site mutant, and simultaneously over-expressing PRMT6 group and mutation H3R2 site HTR8 cell line by western blot. J, K Wound healing scratches were imaged immediately, 24 h and 48 h after initial scratch time to quantify relative migration, quantifying relative migration using ImageJ software. L, M HTR8 cells and JEG3 cells were suspended in serum-free medium and then inoculated into an insertion chamber pre-coated with diluted matrix gel and incubated for 48 h for invasion determination. Cells at the lower surface of the membrane were counted and analyzed under a light microscope in three random fields of view. The staining intensity was quantified using the ImageJ software
Fig. 5
Fig. 5
KLF4 regulates the level of H3R2ME2a by regulating PRMT6, and then regulates the biological behaviors of trophoblast cells such as invasion, migration and EMT The protein level of H3R2ME2a in the control group, the over-expressing KLF4 group, the over-expressing PRMT6 group, and both overexpressing KLF4 and PRMT6 group detected by western blot. The protein level of H3R2ME2a in the control group, the knockdown KLF4 group, the knockdown PRMT6 group, and both knockdown KLF4 and PRMT6 group detected by western blot. C The H3R2ME2a concentrations of MMP9, E-cadherin, N-cadherin and vimentin promoters in HTR8 with KLF4 knockdown were analyzed by ChIP-qPCR. D The protein level of H3R2ME2a and invasion and migration related proteins MMP9 and EMT-related proteins E-cadherin, N-cadherin and vimentin in control group, knockdown KLF4 group, H3R2 site mutant, and simultaneously knockdown KLF4 group and mutation H3R2 site HTR8 cell line by western blot. E, F Wound healing scratches were imaged immediately, 24 h and 48 h after initial scratch time to quantify relative migration, quantifying relative migration using ImageJ software. G, H HTR8 cells and JEG3 cells were suspended in serum-free medium and then inoculated into an insertion chamber pre-coated with diluted matrix gel and incubated for 48 h for invasion determination. Cells at the lower surface of the membrane were counted and analyzed under a light microscope in three random fields of view. The staining intensity was quantified using the ImageJ software. I The protein level of H3R2ME2a and invasion and migration related proteins MMP9 and EMT-related proteins E-cadherin, N-cadherin and vimentin in control group, over-expressing PRMT6 group, H3R2 site mutant, and simultaneously over-expressing PRMT6 group and mutation H3R2 site HTR8 cell line by western blot. J, K Wound healing scratches were imaged immediately, 24 h and 48 h after initial scratch time to quantify relative migration, quantifying relative migration using ImageJ software. L, M HTR8 cells and JEG3 cells were suspended in serum-free medium and then inoculated into an insertion chamber pre-coated with diluted matrix gel and incubated for 48 h for invasion determination. Cells at the lower surface of the membrane were counted and analyzed under a light microscope in three random fields of view. The staining intensity was quantified using the ImageJ software
Fig. 6
Fig. 6
Inhibition of KLF4 can inhibit embryo absorption in miscarried mice. A Representative macroscopic views of the uterus in NP mice with and without APTO-253 injected treatment. BC The expression of PRMT6 and H3R2ME2a protein in placental tissue sections was determined by western blot. The expression of E-cadherin, N-cadherin, vimentin was determined by immunohistochemical. D Representative macroscopic views of the uterus in NP and AP mice, with and without Kenpaullone injected treatment, with and without EPZ020411 gavaged treatment. EF The expression of H3R2ME2a protein in placental tissue sections was determined by western blot. The expression of E-cadherin, N-cadherin, vimentin was determined by immunohistochemical. The protein imprinting strength and the staining intensity was quantified using ImageJ software.The protein imprinting strength and the staining intensity was quantified using ImageJ software
Fig. 7
Fig. 7
The KLF4/PRMT6/H3R2ME2a axis regulates mechanisms associated with unexplained recurrent spontaneous abortion by regulating trophoblast function

Similar articles

Cited by

References

    1. Rai R, Regan L. Recurrent miscarriage. Lancet. 2006;368(9535):601–11. - PubMed
    1. La XL, Wang WJ, Zhang M, Liang L. Definition and multiple factors of recurrent spontaneous abortion. Environ Female Reproductive Health. 2021;1300:231–57. - PubMed
    1. Ibrahaim Y, Hotaling J. Sperm epigenetics and its impact on male fertility, pregnancy loss, and somatic health of future offspring. Sem Reprod Med. 2018;36(3–4):233–5. - PubMed
    1. Adhikari D, Lee IW, Al-Zubaidi U, Liu J, Zhang QH, Yuen WS, et al. Depletion of oocyte dynamin-related protein 1 shows maternal-effect abnormalities in embryonic development. Sci Adv. 2022;8(24):eabl8070. - PMC - PubMed
    1. Huppertz B. Traditional and new routes of Trophoblast Invasion and their implications for pregnancy diseases. Int J Mol Sci. 2020;21(1):289. - PMC - PubMed

MeSH terms

LinkOut - more resources