. 2024 Oct 11;23(1):227.
doi: 10.1186/s12943-024-02138-0.

Chaperone-mediated autophagy modulates Snail protein stability: implications for breast cancer metastasis

Affiliations

Chaperone-mediated autophagy modulates Snail protein stability: implications for breast cancer metastasis

Ki-Jun Ryu et al. Mol Cancer. .

Abstract

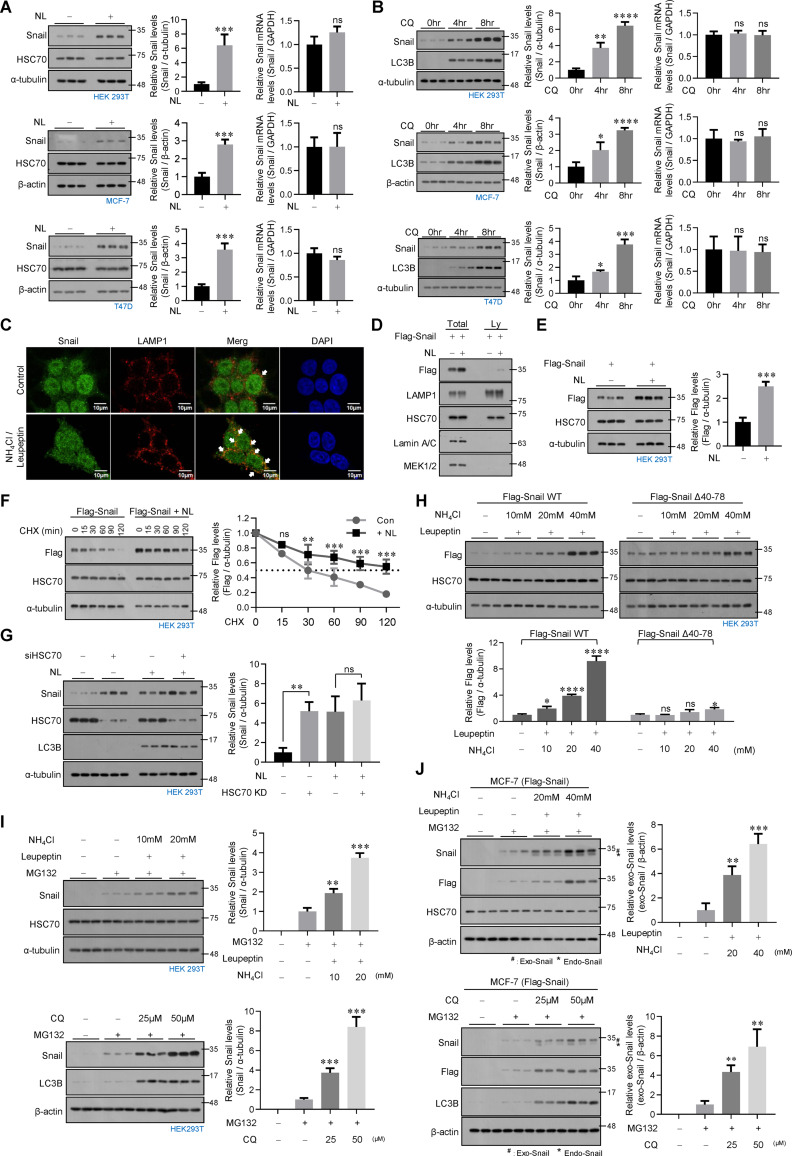
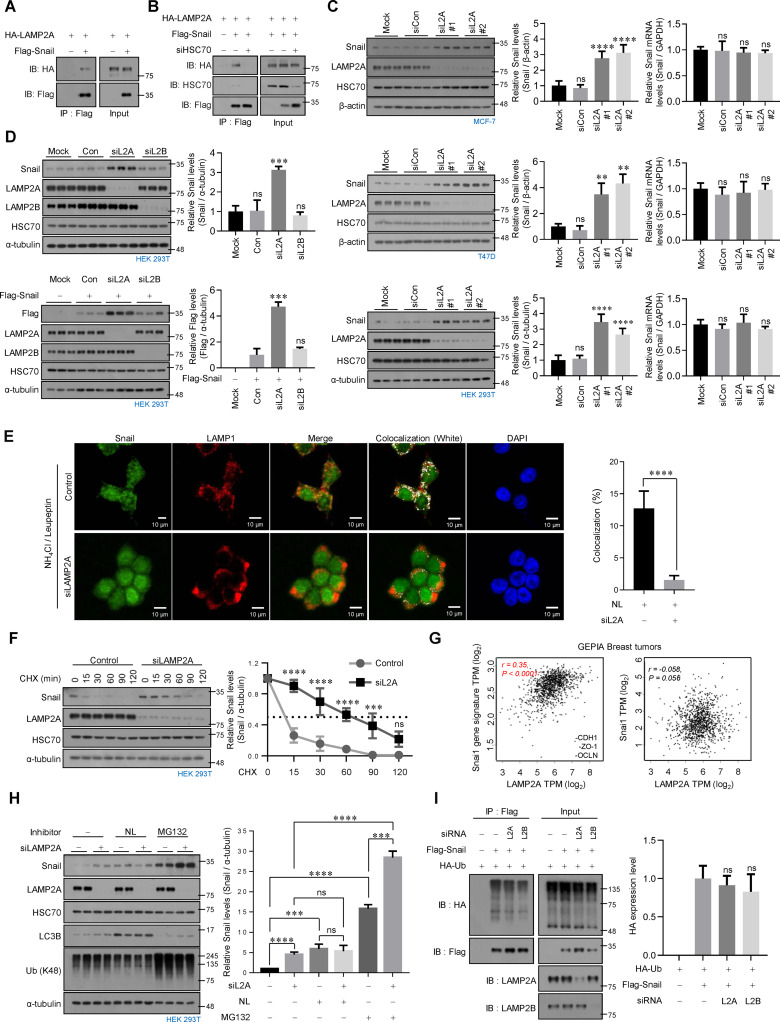
Breast cancer remains a significant health concern, with triple-negative breast cancer (TNBC) being an aggressive subtype with poor prognosis. Epithelial-mesenchymal transition (EMT) is important in early-stage tumor to invasive malignancy progression. Snail, a central EMT component, is tightly regulated and may be subjected to proteasomal degradation. We report a novel proteasomal independent pathway involving chaperone-mediated autophagy (CMA) in Snail degradation, mediated via its cytosolic interaction with HSC70 and lysosomal targeting, which prevented its accumulation in luminal-type breast cancer cells. Conversely, Snail predominantly localized to the nucleus, thus evading CMA-mediated degradation in TNBC cells. Starvation-induced CMA activation downregulated Snail in TNBC cells by promoting cytoplasmic translocation. Evasion of CMA-mediated Snail degradation induced EMT, and enhanced metastatic potential of luminal-type breast cancer cells. Our findings elucidate a previously unrecognized role of CMA in Snail regulation, highlight its significance in breast cancer, and provide a potential therapeutic target for clinical interventions.

Keywords: Breast cancer; Chaperone-mediated autophagy; EMT; Metastasis; Snail.


Conflict of interest statement

The authors declare no competing interests.

Figures

Fig. 1
Fig. 1
HSC70 interacts with Snail in the cytosol and decreases its protein stability. (A) Interaction between exogenous HSC70 and Snail. HEK293T cells were transfected with HA-HSC70 and Flag-Snail. Cell lysates were immunoprecipitated with anti-Flag or anti-HA antibodies and analyzed by western blot. The presence of HA-HSC70 was detected using anti-HA antibody (upper panel), and the presence of Flag-Snail was detected using anti-Flag antibody (lower panel). (B) Interaction between endogenous HSC70 and Snail. Lysates from MCF-7 and T47D cells were immunoprecipitated with an anti-Snail or anti-HSC70 antibodies and analyzed by western blot. The presence of HSC70 was detected using anti-HSC70 antibody (upper panel), and the presence of Snail was detected using anti-Snail antibody (lower panel). (C) Colocalization of exogenous HSC70 with Snail in the cytoplasm. HEK293T cells transfected with HA-HSC70 and Flag-Snail were visualized by confocal microscopy after immunostaining with the indicated antibodies (left). Scale bars, 10 μm. The intensity profiles of the fluorescence signals along the yellow lines indicated in the merge images (right). (D) Colocalization of endogenous HSC70 with Snail. HEK293T and MCF-7 cells were visualized by confocal microscopy after immunostaining with the indicated antibodies. Scale bars, 10 μm. (E) Interaction between exogenous HSC70 and Snail in the cytoplasm. HEK293T cells transfected with HA-HSC70 and Flag-Snail were fractionated into cytosolic and nuclear fractions. Each fraction was immunoprecipitated with an anti-Flag antibody and analyzed by western blot using anti-HA antibody. MEK1/2: a representative cytosolic marker protein, Lamin A/C: a representative nuclear marker protein. (F) Immunoblot analysis in HSC70-depleted MCF-7, T47D or HEK293T cells (left). Relative Snail levels were quantified using ImageJ (middle). *, P < 0.05: **, P < 0.01: ***, P < 0.001: ****, P < 0.0001 as determined by t-test. Snail mRNA levels were analyzed by qRT-PCR (right), normalized to GAPDH. ns, not significant. (G) HSC70-depleted HEK293T cells were treated with CHX (100 µg/ml) for the indicated times before harvest. Cell lysates were immunoblotted with the indicated antibodies (upper), and data quantified using ImageJ (lower). Normalized to α-tubulin. *, P < 0.05: **, P < 0.01: ***, P < 0.001: ****, P < 0.0001 as determined by t-test. (H) Correlation of HSC70 expression with E-cadherin (CDH1) or Snail expression in published microarray data sets (GSE5460, n = 128, left). Scatter plots show the correlation between HSC70 and Snail gene signature (E-cadherin, ZO-1, and Occludin) genes or between HSC70 and Snail gene according to Pearson correlation analysis (GEPIA2, right)
Fig. 2
Fig. 2
HSC70 induces Snail protein degradation through lysosome. (A, B) Immunoblot analysis in ammonium chloride and leupeptin (NL)-treated (A) or chloroquine (CQ)-treated (B) HEK293T, MCF-7, or T47D cells (left). Relative Snail levels were quantified using ImageJ (middle). ***, P < 0.001 as determined by t-test. Snail mRNA levels were analyzed by qRT-PCR (right), normalized to GAPDH. ns, not significant. (C) Colocalization of Snail with LAMP1. HEK293T cells treated with or without NL were visualized by confocal microscopy after immunostaining with the indicated antibodies. Scale bars, 10 μm. (D) Snail accumulation in lysosomes. HEK293T cells transfected with Flag-Snail and treated with NL. Lysosome lysates were immunoblotted with indicated antibodies. (E) HEK293T cells transfected with Flag-Snail were treated with NL. Cell lysates were immunoblotted with the indicated antibodies (left). Relative Snail (Flag) levels were quantified using ImageJ (right). ***, P < 0.001 as determined by t-test. (F) HEK293T cells transfected with Flag-Snail and treated with NL were subjected to CHX treatment (100 µg/ml) for the indicated times before harvest. Cell lysates were immunoblotted with the indicated antibodies (left), and data quantified using ImageJ (right). Normalized to α-tubulin. **, P < 0.01: ***, P < 0.001 as determined by t-test. ns, not significant. (G) HSC70-depleted HEK293T cells were treated with NL. Cell lysates were immunoblotted with the indicated antibodies (left). Relative Snail levels were quantified using ImageJ (right). **, P < 0.01 as determined by t-test. ns, not significant. (H) HEK293T cells transfected with Flag-Snail WT or Flag-Snail-∆40–78 were treated with NL. Cell lysates were immunoblotted with the indicated antibodies (upper). Relative Snail (Flag) levels were quantified using ImageJ (right). *, P < 0.05: ****, P < 0.0001 as determined by t-test. ns, not significant. (I) Immunoblot analysis in NL (upper left) or CQ (lower left) and/or MG132-treated HEK293T cells. Relative Snail levels were quantified using ImageJ (right). **, P < 0.01: ***, P < 0.001 as determined by t-test. (J) Immunoblot analysis in NL (upper left) or CQ (lower left) and/or MG132-treated Flag-Snail-expressing MCF-7 cells. Relative Snail levels were quantified using ImageJ (right). **, P < 0.01: ***, P < 0.001 as determined by t-test. #, exogenously expressed Snail. *, endogenously expressed Snail
Fig. 3
Fig. 3
Snail is a novel substrate of CMA. (A) Interaction between exogenous LAMP2A and Snail. HEK293T cells transfected with HA-LAMP2A and Flag-Snail were immunoprecipitated with an anti-Flag antibody and analyzed by western blot using anti-HA antibody. (B) Interaction between exogenous LAMP2A and Snail in the absence of HSC70. HEK293T cells transfected with HA-LAMP2A and Flag-Snail were depleted of HSC70. Cell lysates were immunoprecipitated with an anti-Flag antibody and analyzed by western blot using anti-HA antibody. (C) Immunoblot analysis in LAMP2A-depleted MCF-7, T47D or HEK293T cells (left). Relative Snail levels were quantified using ImageJ (middle). **, P < 0.01: ****, P < 0.0001 as determined by t-test. Snail mRNA levels were analyzed by qRT-PCR (right), normalized to GAPDH. ns, not significant. (D) Immunoblot analysis in LAMP2A or LAMP2B-depleted HEK293T cells (left). Relative Snail levels were quantified using ImageJ (right). ***, P < 0.001 as determined by t-test. ns, not significant. (E) Colocalization of Snail with LAMP1 in LAMP2A-depleted HEK293T cells. Control or LAMP2A-depleted HEK293T cells treated with NL were visualized by confocal microscopy after immunostaining with the indicated antibodies. Scale bars, 10 μm. (F) LAMP2A-depleted HEK293T cells were treated with CHX (100 µg/ml) for the indicated times before harvest. Cell lysates were immunoblotted with the indicated antibodies (left), and data quantified using ImageJ (right). Normalized to α-tubulin. ***, P < 0.001: ****, P < 0.0001 as determined by t-test. ns, not significant. (G) Scatter plots show the correlation between LAMP2A and Snail gene signature (E-cadherin, ZO-1, and Occludin) genes or between LAMP2A and Snail gene according to Pearson correlation analysis (GEPIA2). (H) LAMP2A-depleted HEK293T cells were treated with NL or MG132. Cell lysates were immunoblotted with the indicated antibodies (left). Relative Snail levels were quantified using ImageJ (right). ***, P < 0.001: ****, P < 0.0001 as determined by t-test. ns, not significant. (I) LAMP2A or LAMP2B-depleted HEK293T cells transfected with Flag-Snail and HA-ubiquitin were treated with MG132. Cell lysates were immunoprecipitated with an anti-Flag antibody and analyzed by immunoblot using anti-HA antibody
Fig. 4
Fig. 4
Evasion of CMA-mediated Snail degradation induces EMT and increases metastatic abilities in luminal-type breast cancer cells. (A) Immunoblot analysis of NL-treated WT-Snail- or 58AAAA-Snail-expressing MCF-7 cells (upper). Relative Snail levels were quantified using ImageJ (lower). *, P < 0.05: **, P < 0.01: ***, P < 0.001 as determined by t-test. ns, not significant. (B) Immunoblot analysis in LAMP2A-depleted WT-Snail- or 58AAAA-Snail-expressing MCF-7 cells (left). Relative Snail levels were quantified using ImageJ (right). **, P < 0.01 as determined by t-test. ns, not significant. (C) WT-Snail or 58AAAA-Snail-expressing MCF-7 cells were treated with CHX (100 µg/ml) for the indicated times before harvest. Cell lysates were immunoblotted with the indicated antibodies (left), and data quantified using ImageJ (right). Normalized to α-tubulin. **, P < 0.01: ***, P < 0.001: ****, P < 0.0001 as determined by t-test. ns, not significant. (D) Morphological changes of WT-Snail or 58AAAA-Snail-expressing MCF-7 cells. WT-Snail-, 58AAAA-Snail-expressing MCF-7 and control cells were stained with TRITC-conjugated phalloidin and visualized by confocal microscopy. Scale bars, 40 μm–20 μm. (E) Expression levels of EMT marker proteins in WT-Snail-, 58AAAA-Snail-expressing MCF-7 and control cells were analyzed by immunoblotting. (F) WT-Snail, 58AAAA-Snail-expressing MCF-7 and control cells were analyzed in wound-healing assays by visualizing wound closure via phase-contrast microcopy (left). Wound areas were measured using WimScratch software (Wimasis). The data shown represent the percentage of the wound area and are expressed as the means ± SD of three individual experiments (right). **, P < 0.01: ****, P < 0.0001 as determined by t-test. (G) WT-Snail-, 58AAAA-Snail-expressing MCF-7 and control cells were seeded onto Matrigel matrix-coated top chambers, and the fold-changes of invading cells were measured after 30 h. The data shown are expressed as the means ± SD of three individual experiments, each performed in triplicate. **, P < 0.01: ****, P < 0.0001 as determined by t-test. (H) The indicated cells were seeded in a 6-well plate at a concentration of 1 × 105 cells per well. After incubation for 1 to 4 days, the viable cells were counted with a hemocytometer after trypan blue staining. (I) About 2 × 106 of the MCF-7 cells stably expressing WT-Snail, 58AAAA-Snail, or control cells were injected into the nude mice by tail-vein injection. Representative pictures of HE staining of lung sections (left). Scale bars, 200 μm. The number of metastatic lung nodules in individual mice was quantified at 6 weeks after tail-vein injection (right). The data are shown as the means ± SD of 7 mice/group. **, P < 0.01: ***, P < 0.001 as determined by t-test
Fig. 5
Fig. 5
Serum starvation induces Snail degradation by CMA in TNBC cells. (A) Immunoblot analysis of serum-starved MDA-MB-231 or BT549 cells (left). Relative LAMP2A and Snail levels were quantified using ImageJ (middle). **, P < 0.01: ***, P < 0.001: ****, P < 0.0001 as determined by t-test. Snail mRNA levels were analyzed by qRT-PCR (right), normalized to GAPDH. ns, not significant. (B) LAMP2A-depleted MDA-MB-231 or BT549 cells were serum starved. Cell lysates were immunoblotted with the indicated antibodies (left). Relative Snail levels were quantified using ImageJ (right). ****, P < 0.0001 as determined by t-test. ns, not significant. (C) MDA-MB-231 or BT549 cells transfected with LAMP2A were immunoblotted with the indicated antibodies (left). Relative Snail levels were quantified using ImageJ (right). **, P < 0.01: ***, P < 0.001: ****, P < 0.0001 as determined by t-test. ns, not significant. (D) Immunoblot analysis in LAMP2A-depleted luminal-type breast cancer cells or TNBC cells (left). Relative Snail levels were quantified using ImageJ (right). *, P < 0.05: **, P < 0.01: ***, P < 0.001 as determined by t-test. (E) Colocalization of Snail with LAMP1 upon NL treatment in serum-starved MDA-MB-231 cells. MDA-MB-231 cells treated with NL under serum starvation were visualized by confocal microscopy after immunostaining with the indicated antibodies. Scale bars, 20 μm. (F) Serum starved MDA-MB-231 cells were treated with NL. Cytosolic and nuclear fractions were immunoblotted with the indicated antibodies (upper). Relative Snail levels were quantified using ImageJ software (lower). ***, P < 0.001: ****, P < 0.0001 as determined by t-test. ns, not significant. (G) Immunoblot analysis of serum-starved MDA-MB-231 or BT549 cells treated with or without Leptomycin B (upper). Relative Snail levels were quantified using ImageJ software (lower). **, P < 0.01: ***, P < 0.001 as determined by t-test. ns, not significant. (H) Immunoblot analysis of serum-starved MDA-MB-231, BT549 or Hs578T cells (left). Relative Snail, p-PKD1, PAK1, p-GSK3β (inactive form) and p-Akt levels were quantified using ImageJ (right). *, P < 0.05: **, P < 0.01: ***, P < 0.001 as determined by t-test
Fig. 6
Fig. 6
Nuclear to cytoplasmic translocation of Snail is prerequisite for CMA-mediated degradation in luminal-type breast cancer cells. (A) Immunoblot analysis of Leptomycin B-treated MCF-7 or MDA-MB-231 cells (left). Relative Snail levels were quantified using ImageJ (middle). **, P < 0.01: ***, P < 0.001: ****, P < 0.0001 as determined by t-test. (B) Subcellular localization of endogenous Snail protein in Leptomycin B-treated MCF-7 or MDA-MB-231 cells. MCF-7 or MDA-MB-231 cells treated with or without Leptomycin B were visualized by confocal microscopy after immunostaining with the indicated antibodies. Scale bars, 10 μm. (C) Immunoblot analysis of LAMP2A-depleted HEK293T or MCF-7 cells treated with or without Leptomycin B (upper). Relative Snail levels were quantified using ImageJ (lower). **, P < 0.01 as determined by t-test. ns, not significant. (D) LAMP2A-depleted HEK293T cells were treated or without Leptomycin B. Cytosolic and nuclear fractions were immunoblotted with the indicated antibodies (left). Relative Snail levels were quantified using ImageJ (right). *, P < 0.05: ***, P < 0.001 as determined by t-test. ns, not significant. (E) Interaction between exogenous HSC70 and Snail with or without Leptomycin B treatment. HEK293T cells transfected with HA-HSC70 and Flag-Snail were treated with or without Leptomycin B. Cell lysates were immunoprecipitated with an anti-Flag antibody and analyzed by western blot using anti-HA antibody. (F) Colocalization of exogenous HSC70 with Snail with or without Leptomycin B treatment. HA-HSC70 and Flag-Snail were transfected into HEK293T cells, and treated or not with Leptomycin B. HEK293T cells were visualized by confocal microscopy after immunostaining with the indicated antibodies. Scale bars, 10 μm. (G) Immunoblot analysis of TGF-β-treated MCF-7 cells (left). Relative Snail and E-cadherin levels were quantified using ImageJ (right). *, P < 0.05: **, P < 0.01: ***, P < 0.001 as determined by t-test. ns, not significant. (H) Interaction between endogenous HSC70 and Snail with or without TGF-β treatment. MCF-7 cells treated with or without TGF-β were immunoprecipitated with an anti-Snail antibody and analyzed by western blot using anti-HSC70 antibody. (I) Colocalization of Snail with LAMP1 after NL treatment in MCF-7 cells treated with or without TGF-β. MCF-7 cells were visualized by confocal microscopy after immunostaining with the indicated antibodies. Scale bars, 10 μm. (J) Immunoblot analysis of TGF-β-treated WT-Snail or 58AAAA-Snail-expressing MCF-7 cells (left). Relative Snail and E-cadherin levels were quantified using ImageJ (right). *, P < 0.05: ***, P < 0.001 as determined by t-test. ns, not significant
Fig. 7
Fig. 7
Expression of HSC70 correlates with the expression of Snail target genes in patients with luminal-type breast cancer. (A) Correlation of HSC70 expression with E-cadherin (CDH1) or Vimentin (VIM) expression in breast cancer patients (GSE86166, luminal-type breast cancer patients, n = 242; TNBC patients, n = 67). (B) Correlation of HSC70 expression with the expression of EMT-related transcription factors in breast cancer patients (GSE86166, luminal-type breast cancer patients, n = 242; TNBC patients, n = 67). (C) Association of HSC70 expression with Relapse Free Survival (RFS) in patients with breast cancer. Kaplan-Meier plot showing HSC70 expression and prognosis in breast cancer patients (GSE11121, luminal-type breast cancer patients, n = 160; TNBC patients, n = 21). Statistical analysis was performed using log-rank tests. (D) Schematic diagram showing how CMA modulates Snail protein stability in breast cancer. In luminal-type breast cancer cells, Snail is predominantly localized in the cytoplasm and is susceptible to degradation by CMA, thereby inhibiting EMT. In TNBC cells, Snail remains in the nucleus, escaping CMA-mediated degradation, and promoting EMT

References

    1. Siegel RL, Miller KD, Jemal A. Cancer statistics, 2020. CA Cancer J Clin. 2020;70(1):7–30. - PubMed
    1. Bray F, Ferlay J, Soerjomataram I, Siegel RL, Torre LA, Jemal A. Global cancer statistics 2018: GLOBOCAN estimates of incidence and mortality worldwide for 36 cancers in 185 countries. CA Cancer J Clin. 2018;68(6):394–424. - PubMed
    1. Dent R, Trudeau M, Pritchard KI, Hanna WM, Kahn HK, Sawka CA, et al. Triple-negative breast cancer: clinical features and patterns of recurrence. Clin Cancer Res. 2007;13(15):4429–34. - PubMed
    1. Foulkes WD, Smith IE, Reis-Filho JS. Triple-negative breast cancer. N Engl J Med. 2010;363(20):1938–48. - PubMed
    1. Hudis CA, Gianni L. Triple-negative breast cancer: an unmet medical need. Oncologist. 2011;16(S1):1–11. - PubMed

MeSH terms

Substances

LinkOut - more resources