. 2024 Oct 10;22(1):919.
doi: 10.1186/s12967-024-05666-x.

AIMP2 accumulation in brain leads to cognitive deficits and blood secretion in Parkinson's disease

Affiliations

AIMP2 accumulation in brain leads to cognitive deficits and blood secretion in Parkinson's disease

Heejeong Kim et al. J Transl Med. .

Abstract

Background: Propagation of neuronal α-synuclein aggregate pathology to the cortex and hippocampus correlates with cognitive impairment in Parkinson's disease (PD) dementia and dementia with Lewy body disease. Previously, we showed accumulation of the parkin substrate aminoacyl-tRNA synthetase interacting multifunctional protein-2 (AIMP2) in the temporal lobe of postmortem brains of patients with advanced PD. However, the potential pathological role of AIMP2 accumulation in the cognitive dysfunction of patients with PD remains unknown.

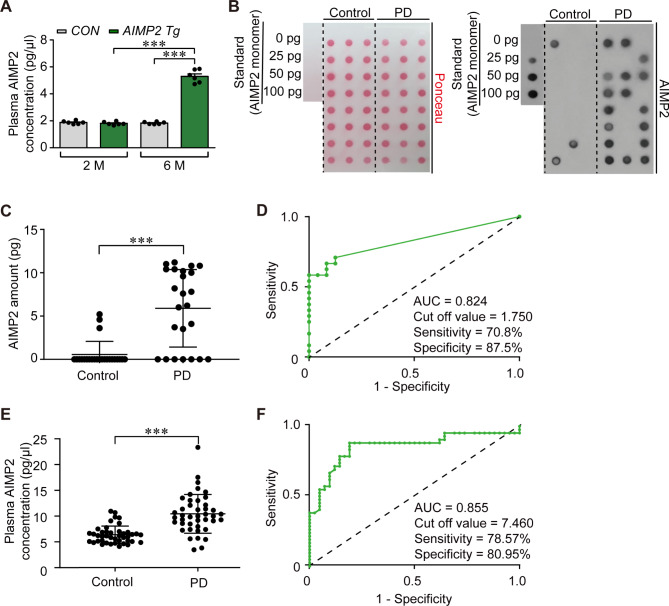
Methods: We performed immunofluorescence imaging to examine cellular distribution and accumulation of AIMP2 in brains of conditional AIMP2 transgenic mice and postmortem PD patients. The pathological role of AIMP2 was investigated in the AIMP2 transgenic mice by assessing Nissl-stained neuron counting in the hippocampal area and Barnes maze to determine cognitive functions. Potential secretion and cellular uptake of AIMP2 was monitored by dot blot analysis and immunofluorescence. The utility of AIMP2 as a new PD biomarker was evaluated by dot blot and ELISA measurement of plasma AIMP2 collected from PD patients and healthy control followed by ROC curve analysis.

Results: We demonstrated that AIMP2 is toxic to the dentate gyrus neurons of the hippocampus and that conditional AIMP2 transgenic mice develop progressive cognitive impairment. Moreover, we found that neuronal AIMP2 expression levels correlated with the brain endothelial expression of AIMP2 in both AIMP2 transgenic mice and in the postmortem brains of patients with PD. AIMP2, when accumulated, was released from the neuronal cell line SH-SY5Y cells. Secreted AIMP2 was taken up by human umbilical vein endothelial cells. Consistent with the fact that AIMP2 can be released into the extracellular space, we showed that AIMP2 transgenic mice have higher levels of plasma AIMP2. Finally, ELISA-based assessment of AIMP2 in plasma samples from patients with PD and controls, and subsequent ROC curve analysis proved that high plasma AIMP2 expression could serve as a reliable molecular biomarker for PD diagnosis.

Conclusions: The pathological role in the hippocampus and the cell-to-cell transmissibility of AIMP2 provide new therapeutic avenues for PD treatment, and plasma AIMP2 combined with α-synuclein may improve the accuracy of PD diagnosis in the early stages.

Keywords: AIMP2; Blood biomarker; Conditional transgenic mice; Diagnosis; Intercellular protein transmission; Lewy body dementia.


Conflict of interest statement

S.H., and Y.L. are inventors of the patent related to this work (South Korea domestic patent no. 10-2252879, “Method for diagnosing Parkinson’s disease using AIMP2 in blood plasma, composition therefor and kit containing the same”). The authors declare no conflicts of interest.

Figures

Fig. 1
Fig. 1
AIMP2 accumulation in neurons and endothelium of Parkinson’s disease brains. (A) Expression of AIMP2 in postmortem temporal lobe sections from patients with Parkinson’s disease (PD) and age-matched controls monitored by immunofluorescence. Neurons were costained with neuron marker microtubule-associated protein 2 (MAP2) and AIMP2 antibodies. Scale bar = 20 μm. (B) Quantification of AIMP2 immunofluorescence signals in MAP2-positive neurons from brains sections of patients with PD and age-matched control (n = 60 cells from six controls and 60 cells from six PD). (C) Expression of AIMP2 in postmortem temporal lobe sections from patients with PD and age-matched controls monitored by immunofluorescence. Endothelial cells were costained with CD31 and AIMP2 antibodies. Scale bar = 20 μm. (D) Quantification of AIMP2 immunofluorescence signals in CD31-positive cerebral endothelial cells in brain sections of patients with PD and age-matched controls (n = 60 cells from six controls and 60 cells from six PD). (E) Pearson correlation analysis between neuronal and endothelial AIMP2 expression levels in control and PD brain sections. Control samples (n = 6): gray dots; PD samples (n = 6): black dots. Quantitative data are expressed as the mean ± standard error of the mean (SEM), and statistical significance was determined using nonparametric two-tailed Mann–Whitney test. ***p < 0.001
Fig. 2
Fig. 2
Transgenic mice expressing AIMP2 in brain develop age-dependent cognitive dysfunction. (A) Representative immunohistochemistry images showing robust expression of AIMP2 in the cortex and hippocampus (CA1, and dentate gyrus (DG)) of AIMP2 transgenic mice (two months old) as compared to the age-matched control littermate. Scale bar = 50 μm. (B) Nissl-stained hippocampal coronal sections from two- and six-month-old AIMP2 transgenic mice and age-matched control littermates. Representative images show CA1 and DG. Scale bar = 100 μm. (C) Quantification of relative number of Nissl-positive neurons in the CA1 regions of hippocampus from two- and six-month-old AIMP2 transgenic mice and littermate controls (n = 7 each group). (D) Quantification of relative number of Nissl-positive neurons in the DG regions of hippocampus from two- and six-month-old AIMP2 transgenic mice and littermate controls (n = 7 each group). (E) Representative trace of mice finding the hiding cage (indicated as red circle) located underneath of the circular arena of the Barnes maze in repetitive trials (1 = the first training, 2 = on 3 days since the first training, 3 = 5 days since the second training) for AIMP2 transgenic mice and littermate controls of two and six months of age. (F, G) Assessment of spatial learning and memory, using the Barnes maze, as determined by the time and travel distance taken to find the hiding cage in the repeated trials (n = two-month-old Con: 5 male, 4 female; two-month-old Tg: 6 male, 3 female; six-month-old Con: 6 male, 6 female; six-month-old Tg: 5 male, 7 female). Quantitative data are expressed as the mean ± SEM, and statistical significance was determined using ANOVA with Tukey’s post hoc test. *p < 0.05, ***p < 0.001, and ****p < 0.0001
Fig. 3
Fig. 3
Intracellular AIMP2 accumulation leads to AIMP2 secretion and intercellular transmission. (A) Representative immunofluorescence images of endothelial marker CD31 and AIMP2 in the cortical brain subregions from two- and six-month-old AIMP2 transgenic mice and age-matched littermate controls. The nucleus was counterstained with 4′,6-diamidino-2-phenylindole dihydrochloride (DAPI). Scale bar = 10 μm. (B) Quantification of AIMP2 signal intensities in CD31-positive brain endothelium in the indicated mouse groups (n = 5 in two-month-age group, n = 5 in control six-month-age group, and n = 8 in AIMP2 Tg six-month-age group). (C) Anti-AIMP2 dot blot assessment of GFP-AIMP2 protein in the culture media from SH-SY5Y cells transiently transfected with either GFP or GFP-AIMP2 constructs. Ponceau staining was used to visualize the proteins in the culture media. Complete media was changed to serum-deprived media 24 h before analysis of AIMP2 secretion. (D) Quantification of secreted AIMP2 in the media from SH-SY5Y cells transfected with GFP or GFP-AIMP2 based on the dot blot result in the panel C (n = 3 separate experiments per group). (E) Anti-GFP dot blot assessment of GFP-AIMP2 protein in the culture media from SH-SY5Y cells transiently transfected with either GFP or GFP-AIMP2 constructs. Ponceau staining was used to visualize the proteins in the culture media. Complete media was changed to serum-deprived media 24 h before analysis of AIMP2 secretion. (F) Quantification of relative anti-GFP dot blot optical densities for experimental groups in the panel E (n = 3 separate experiments per group). (G) Dot blot assessment of AIMP2 protein in the culture media from SH-SY5Y cells transiently transfected with GFP-AIMP2 construct (0, 1, 2 μg). Ponceau staining was used to visualize the proteins in the culture media. Complete media was changed to serum-deprived media 24 h before analysis of AIMP2 secretion. (H) Quantification of secreted AIMP2 in the media from SH-SY5Y cells transfected with the indicated combination of GFP and GFP-AIMP2 (n = 3 separate experiments per group). (I) Representative immunofluorescence images showing GFP-AIMP2 uptake into HUVECs. HUVECs were treated with conditioned media (48 h) from GFP or GFP-AIMP2 transfected SH-SY5Y cells. Scale bar = 50 μm. (J) Percentage GFP-positive HUVECs in the indicated experimental groups (n = 3 separate experiments per group). (K) Quantification of GFP-AIMP2 immunofluorescence signals in HUVECs in the indicated experimental groups (n = 3 separate experiments per group). Quantitative data are expressed as the mean ± SEM, and statistical significance was determined by ANOVA with Tukey’s post hoc test. *p < 0.05, **p < 0.01 and ***p < 0.001. ns, non-significant
Fig. 4
Fig. 4
Blood AIMP2 as a potential biomarker for Parkinson’s disease diagnosis. (A) ELISA analysis of plasma AIMP2 levels in two- and six-month-old AIMP2 transgenic mice and age-matched littermate controls (n = 6 per group). (B) Dot blot analysis of AIMP2 in plasma samples collected from patients with PD and age matched subjects with musculo-skeletal diseases (Control). Recombinant AIMP2 was used for standard generation and quantification. (C) Quantification of plasma AIMP2 levels in PD (n = 24) and age-matched musculo-skeletal disease controls (n = 24) determined by dot blot analysis. (D) Receiver operating characteristic (ROC) curve analysis of the data set in the panel C obtained from dot blot analysis. AUC, cut off value, specificity, and sensitivity were calculated and presented in the graph. (E) ELISA quantification of plasma AIMP2 in the additional plasma samples collected from patients with PD (n = 42) and age matched healthy control subjects (n = 42). (F) ROC curve analysis of the data set in the panel E obtained from ELISA analysis. AUC, cut-off value, specificity, and sensitivity are presented in the graph. Quantitative data are expressed as the mean ± SEM, and statistical significance was determined by ANOVA with Tukey’s post hoc test. ***p < 0.001

Similar articles

References

    1. Tysnes OB, Storstein A. Epidemiology of Parkinson’s disease. J Neural Transm (Vienna). 2017;124:901–5. - PubMed
    1. Lang AE, Lozano AM. Parkinson’s disease. First of two parts. N Engl J Med. 1998;339:1044–53. - PubMed
    1. Poewe W. Non-motor symptoms in Parkinson’s disease. Eur J Neurol. 2008;15(Suppl 1):14–20. - PubMed
    1. Jellinger KA. Dementia with Lewy bodies and Parkinson’s disease-dementia: current concepts and controversies. J Neural Transm (Vienna). 2018;125:615–50. - PubMed
    1. Burke RE, Dauer WT, Vonsattel JP. A critical evaluation of the Braak staging scheme for Parkinson’s disease. Ann Neurol. 2008;64:485–91. - PMC - PubMed

LinkOut - more resources