. 2024 Oct 10;97(1):134-148.
doi: 10.1002/ana.27102. Online ahead of print.

Advanced MRI Measures of Myelin and Axon Volume Identify Repair in Multiple Sclerosis

Affiliations

Advanced MRI Measures of Myelin and Axon Volume Identify Repair in Multiple Sclerosis

Gretel Sanabria-Diaz et al. Ann Neurol. .

Abstract

Objective: Pathological studies suggest that multiple sclerosis (MS) lesions endure multiple waves of damage and repair; however, the dynamics and characteristics of these processes are poorly understood in patients living with MS.

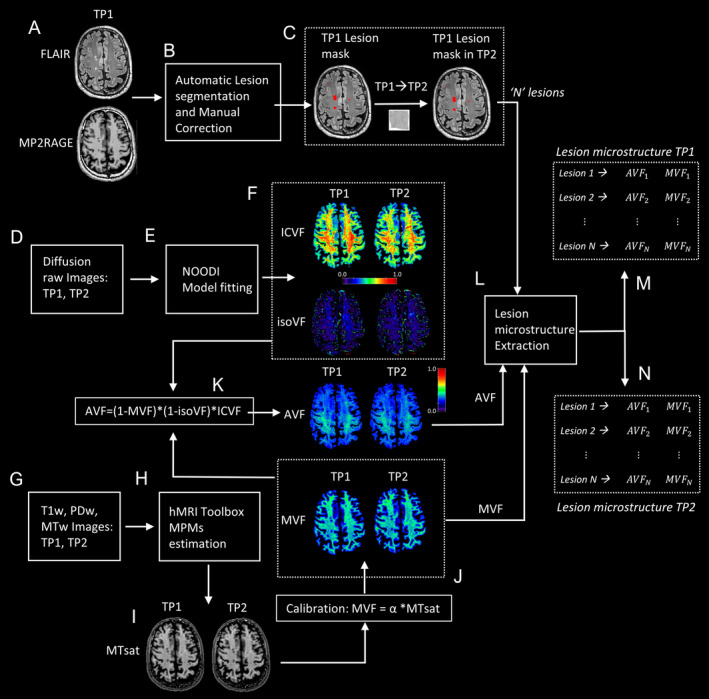
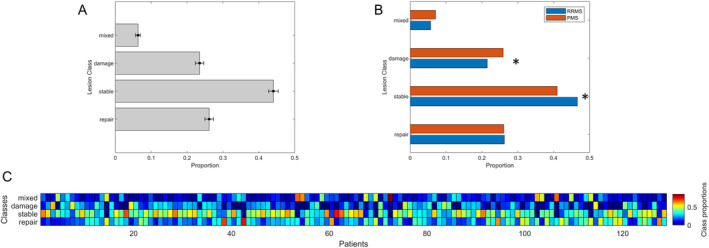
Methods: We studied 128 MS patients (75 relapsing-remitting, 53 progressive) and 72 healthy controls who underwent advanced magnetic resonance imaging and clinical examination at baseline and 2 years later. Magnetization transfer saturation and multi-shell diffusion imaging were used to quantify longitudinal changes in myelin and axon volumes within MS lesions. Lesions were grouped into 4 classes (repair, damage, mixed repair damage, and stable). The frequency of each class was correlated to clinical measures, demographic characteristics, and levels of serum neurofilament light chain (sNfL).

Results: Stable lesions were the most frequent (n = 2,276; 44%), followed by lesions with patterns of "repair" (n = 1,352; 26.2%) and damage (n = 1,214; 23.5%). The frequency of "repair" lesion was negatively associated with disability (β = -0.04; p < 0.001) and sNfL (β = -0.16; p < 0.001) at follow-up. The frequency of the "damage" class was higher in progressive than relapsing-remitting patients (p < 0.05) and was related to disability (baseline: β = -0.078; follow-up: β = -0.076; p < 0.001) and age (baseline: β = -0.078; p < 0.001). Stable lesions were more frequent in relapsing-remitting than in progressive patients (p < 0.05), and in younger patients versus older (β = -0.07; p < 0.001) at baseline. Further, "mixed" lesions were most frequent in older patients (β = 0.004; p < 0.001) at baseline.

Interpretation: These findings show that repair and damage processes within MS lesions occur across the entire disease spectrum and that their frequency correlates with patients disability, age, disease duration, and extent of neuroaxonal damage. ANN NEUROL 2024.


Conflict of interest statement

J.K. has received grants and consulting fees and has been part of the data safety monitoring board and advisor board for different companies (Biogen, Merck, Novartis, Roche). The remaining authors have no relevant conflicts of interest to declare. A.C. has received payment from lectures, presentations and as speaker from Novartis. L.C. has received grant contracts, consulting fees, payment as speaker, participate on data safety monitoring board and advisor board and as leadership for different companies such as Innosuisse, Novartis, Roche, Bayer, Biogen, Janssen, Sanofi, and Bristol Myers Squibb.

Figures

FIGURE 1
FIGURE 1
Study design. AVF, axon volume fraction; MVF, myelin volume fraction; PMS, progressive multiple sclerosis; RRMS, relapsing–remitting multiple sclerosis; sNfL, serum neurofilament light chain; TIV, total intracranial volume; vol, volume; WM, white matter. [Color figure can be viewed at www.annalsofneurology.org]
FIGURE 2
FIGURE 2
Schematic view of the workflow applied to obtain myelin, axon, and extracellular volume fraction maps and their lesion‐wise values. (A, B) Automatic lesion segmentation using FLAIR and MP2RAGE images followed by manual correction. (C) Coregistration of FLAIR in TP1 with FLAIR and M2PRAGE in TP2, application of transformation matrix to transform the TP1 lesion masks to take the same lesional tissue in TP2. (D–F) Diffusion image processing and NODDI model fitting to estimate ICVF and isoVF maps in TP1 and TP2. (G–I) MT protocol images processing using the hMRI toolbox to estimate MTsat maps in TP1 and TP2. (J) MVF estimation using a calibration step based on MTsat. (K) AVF map estimation combines information from MVF, isoVF, and ICVF. (L–N) Lesion‐wise microstructure estimation, taking the median across lesion voxels for AVF and MVF for TP1 and TP2 to be used for the percent of change estimation. AVF, axon volume fraction; FLAIR, fluid attenuated inversion recovery; ICVF, intra‐cellular volume fraction; isoVF, isotropic volume fraction; MP2RAGE, magnetization prepared 2 rapid acquisition gradient echoes; MT, magnetization transfer, MTsat, magnetization transfer saturation; MVF, myelin volume fraction; NOODI, neurite orientation dispersion and density imaging. [Color figure can be viewed at www.annalsofneurology.org]
FIGURE 3
FIGURE 3
Definition of WMLs classes based on MVF and AVF percent of change regarding reference values obtained in the WM of HC. (A) AVF and MVF for all HC at TP1 and TP2. (B) The patient lesion mask is translated to all HC spaces. Estimation of the median value for AVF and MVF in TP1 and TP2 for each lesion ROI in the HC space. (C) Computation of the percent of change (PoC) from TP1 to TP2 for each lesion and microstructure measures. (D) Definition of the lesion wise PoC normal range for AVF and MVF in HC. The 5th and 95th percentiles are used as cut‐off values to define a significant change. (F) Lesion classes definition. Four different classes: repair, damage, stable, and mixed repair‐damage. AVF, axon volume fraction; HC, healthy controls; MVF, myelin volume fraction; ROI, region of interest; WM, white matter; WMLs, white matter lesions. [Color figure can be viewed at www.annalsofneurology.org]
FIGURE 4
FIGURE 4
Relapsing–remitting multiple sclerosis patient with a repaired and a stable lesions (39.86 years old, male, Expanded Disability Status Scale: 2, disease duration = 10.52 years and sNfL = 12.9pg/ml). (A) FLAIR with 2 lesions identified as myelin invariant (PoC in the healthy [HC] reference range, stable [0, 0], green arrows) and 1 remyelinated lesion (PoC over the HC reference range, repair class [0, 1], red arrow). (B) MVF and AVF maps and remyelinated lesion highlighted (red square) in the 2‐time points. (C) Zoom of the remyelinated lesion on the MVF and AVF maps. AVF, axon volume fraction; FLAIR, fluid attenuated inversion recovery; MVF, myelin volume fraction; PoC, percent of change. [Color figure can be viewed at www.annalsofneurology.org]
FIGURE 5
FIGURE 5
White matter lesion (WML) classes in the entire multiple sclerosis cohort and separated by disease phenotype. (A) WMLs classes frequency in people living with multiple sclerosis. The bars represent the frequency of WML in each class. (B) Frequency of WMLs classes in relapsing–remitting multiple sclerosis (RRMS) and progressive multiple sclerosis (PMS) patients. Bars represent the lesion frequency in each WML class, RRMS in blue and PMS in red. (C) Frequency of WML classes per patient. [Color figure can be viewed at www.annalsofneurology.org]
FIGURE 6
FIGURE 6
Correlation of the lesions classes frequency with age, disease disability, disease duration, and NfL Z‐scores. Scatter plots between (A) damage lesion class frequency versus disease disability (EDSS); (B) damage lesion class frequency versus disease duration; (C) damage lesion class frequency versus age; (D) mixed repair‐damage lesion class frequency versus age; (E) repair lesion class frequency versus EDSS; (F) repair lesion class frequency versus sNfL Z‐score; (G) stable lesion class frequency versus disease duration; (H) stable class frequency versus EDSS. The association analysis was performed using a generalized linear model (binomial model with a logit as a canonical link function named logit [p]. The logit[p] defines the logarithm of the proportion odds as log[p/(1‐p)]). The patient's total lesion number (log‐transformed) was introduced in the model as a weight to account for the uncertainty of the proportion (frequency) estimation. A 2‐tailed p < 0.05 was considered statistically significant. An increased value on the y‐axis indicates an increase in the lesion class frequency (represented by a logit value). Dots represent each patient. The colors of the dots represent the patients' lesion numbers. Red lines indicate the partial dependence model fitting. The + on the color scale indicates a threshold of 100 lesions to visualize better patients with a lower lesion number. EDSS, Expanded Disability Status Scale; p, class proportion; sNfL, serum neurofilament light chain (Z‐scores); WM, white matter. [Color figure can be viewed at www.annalsofneurology.org]

References

    1. Oh J, Bar‐Or A. Emerging therapies to target CNS pathophysiology in multiple sclerosis. Nat Rev Neurol 2022;18:466–475. 10.1038/s41582-022-00675-0. - DOI - PubMed
    1. Oh J, Ontaneda D, Azevedo C, et al. Imaging outcome measures of neuroprotection and repair in MS: A consensus statement from NAIMS. Neurology 2019;92:519–533. 10.1212/WNL.0000000000007099. - DOI - PMC - PubMed
    1. Kuhlmann T, Moccia M, Coetzee T, et al. Multiple sclerosis progression: time for a new mechanism‐driven framework. Lancet Neurol 2023;22:78–88. 10.1016/S1474-4422(22)00289-7. - DOI - PMC - PubMed
    1. Reich DS, Lucchinetti CF, Calabresi PA. Multiple Sclerosis. N Engl J Med 2018;378:169–180. 10.1056/NEJMRA1401483/SUPPL_FILE/NEJMRA1401483_DISCLOSURES.PDF. - DOI - PMC - PubMed
    1. Ferguson B, Matyszak MK, Esiri MM, Perry VH. Axonal damage in acute multiple sclerosis lesions. Brain 1997;120:393–399. 10.1093/BRAIN/120.3.393. - DOI - PubMed

LinkOut - more resources