. 2024 Oct 3;34(10):bhae407.
doi: 10.1093/cercor/bhae407.

Functional specialization and distributed processing across marmoset lateral prefrontal subregions

Affiliations

Functional specialization and distributed processing across marmoset lateral prefrontal subregions

Raymond Ka Wong et al. Cereb Cortex. .

Abstract

A prominent aspect of primate lateral prefrontal cortex organization is its division into several cytoarchitecturally distinct subregions. Neurophysiological investigations in macaques have provided evidence for the functional specialization of these subregions, but an understanding of the relative representational topography of sensory, social, and cognitive processes within them remains elusive. One explanatory factor is that evidence for functional specialization has been compiled largely from a patchwork of findings across studies, in many animals, and with considerable variation in stimulus sets and tasks. Here, we addressed this by leveraging the common marmoset (Callithrix jacchus) to carry out large-scale neurophysiological mapping of the lateral prefrontal cortex using high-density microelectrode arrays, and a diverse suite of test stimuli including faces, marmoset calls, and spatial working memory task. Task-modulated units and units responsive to visual and auditory stimuli were distributed throughout the lateral prefrontal cortex, while those with saccade-related activity or face-selective responses were restricted to 8aV, 8aD, 10, 46 V, and 47. Neurons with contralateral visual receptive fields were limited to areas 8aV and 8aD. These data reveal a mixed pattern of functional specialization in the lateral prefrontal cortex, in which responses to some stimuli and tasks are distributed broadly across lateral prefrontal cortex subregions, while others are more limited in their representation.

Keywords: auditory; electrophysiology; faces; marmoset; prefrontal cortex; visual; vocalizations; working memory.


Figures

Fig. 1
Fig. 1
Reconstruction of array implantation sites. T-2-weighted MRIs were acquired and nonlinearly registered to the NIH template brain that contains the location of cytoarchitectonic boundaries of the Paxinos atlas (see Methods). Images were rendered in 3D using MRIcroGL and overlayed with the Paxinos atlas cytoarchitectural boundaries on: the Marmoset Brain Template (left panel); marmoset B (middle panel); marmoset a (right panel).
Fig. 2
Fig. 2
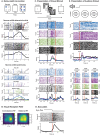
Example single marmoset lPFC neurons modulated by task and stimulus. A) Top panel, task timeline. Rasters and spike density functions in the panels below depict single units exhibiting significant modulations in discharge rate during the delay epoch. Panels below depict a single neuron exhibiting spatial tuning. B) Example of neurons with contralateral and bilateral receptive fields. C) Top panel, task timeline. Below depicts a single neuron exhibiting visual response to all categories of images, but selectivity for human faces (visual stimuli set 1) and another neuron showing selectivity to faces compared to arms and bodies (visual stimuli set 2). D) Rasters and spike density functions of example neurons exhibiting presaccadic and postsaccadic activity. E) Top panel, task schematic. Middle panel depicts a single neuron’s response in different contexts. Bottom panel shows a single neuron’s response to different call types in different contexts.
Fig. 3
Fig. 3
Distribution of task-modulated units and units responsive to different stimulus modalities. Array locations were reconstructed using high-resolution MRIs and superimposed on a standardized marmoset brain, area boundaries from Paxinos et al. (2012). The first column (left column) represents the total number of units found across sessions and its distribution on the array. Second column represents the proportion of units compared to the first column. The third and/or fourth column represents the proportion of units compared to the second column. Gray depicts array locations at which well-isolated single units were not observed.
Fig. 4
Fig. 4
Population responses from neuron classes with different types of selectivity. Dashed line represents neurons that exhibited an increased firing rate compared to baseline (P < 0.02; excitation), and the solid line represents neurons that exhibited a decreased firing rate compared to baseline (P < 0.02; suppression). Firing rates are normalized, and the standard error is plotted in a lighter shade. Vertical black lines represent the start of the epoch/event. Vertical red lines represent the end of the epoch/event. n represents the number of neurons.
Fig. 5
Fig. 5
Natural grouping of neural discharge rates reveals spatially segregated clusters. For each session, we identified natural physiological groupings of recorded units based on the dissimilarity of their discharge rates (see Methods). To create a low-dimensional representation and to explore the spatial relationship between recording channels, we chose a unique color for each recording channel based on its location in the 2D MDS map and a 2D color map (a spatial color map is used for the projection of unit colors onto recording electrodes). Locations on the array with similar colors represent natural physiological groupings of recorded units. The color map is provided to indicate which colors are closer to one another. Note: Similar colors between animals do not represent similar physiological groups.
Fig. 6
Fig. 6
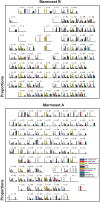
Proportions of task-modulated units and units responsive to different stimulus modalities at each electrode contact in marmoset B A) and marmoset A B). n indicates the overall total number of units at each electrode contact. Proportions were not calculated with respect to the overall total number of units, but rather in respect to the total number of units found in task-specific sessions.

Similar articles

References

    1. Ainsworth M, Sallet J, Joly O, Kyriazis D, Kriegeskorte N, Duncan J, Schüffelgen U, Rushworth MFS, Bell AH. Viewing ambiguous social interactions increases functional connectivity between frontal and temporal nodes of the social brain. J Neurosci. 2021:41:6070–6086. 10.1523/JNEUROSCI.0870-20.2021. - DOI - PMC - PubMed
    1. Arnsten AFT, Wang MJ, Paspalas CD. Neuromodulation of thought: flexibilities and vulnerabilities in prefrontal cortical network synapses. Neuron. 2012:76:223–239. 10.1016/j.neuron.2012.08.038. - DOI - PMC - PubMed
    1. Avants BB, Tustison NJ, Song G, Cook PA, Klein A, Gee JC. A reproducible evaluation of ANTs similarity metric performance in brain image registration. NeuroImage. 2011:54:2033–2044. 10.1016/j.neuroimage.2010.09.025. - DOI - PMC - PubMed
    1. Averbeck BB, Lee D. Effects of noise correlations on information encoding and decoding. J Neurophysiol. 2006:95:3633–3644. 10.1152/jn.00919.2005. - DOI - PubMed
    1. Barbas H, Pandya DN. Architecture and intrinsic connections of the prefrontal cortex in the rhesus monkey. J Comp Neurol. 1989:286:353–375. 10.1002/cne.902860306. - DOI - PubMed

Publication types

LinkOut - more resources