. 2024 Nov 19;123(22):3935-3950.
doi: 10.1016/j.bpj.2024.10.005. Epub 2024 Oct 10.

High-fidelity predictions of diffusion in the brain microenvironment

Affiliations

High-fidelity predictions of diffusion in the brain microenvironment

Nels Schimek et al. Biophys J. .

Abstract

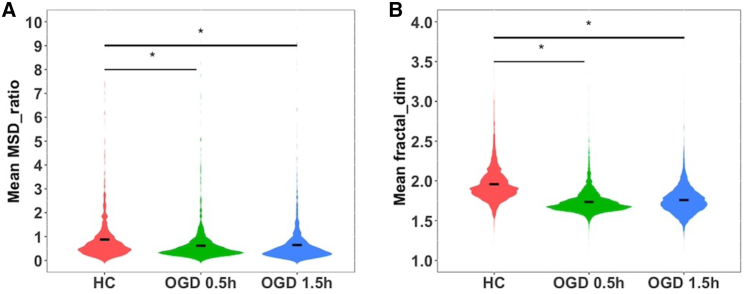
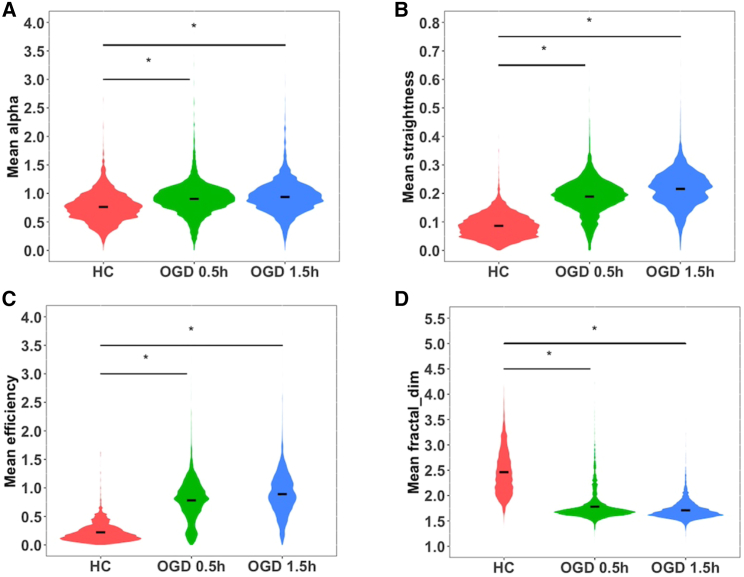
Multiple-particle tracking (MPT) is a microscopy technique capable of simultaneously tracking hundreds to thousands of nanoparticles in a biological sample and has been used extensively to characterize biological microenvironments, including the brain extracellular space (ECS). Machine learning techniques have been applied to MPT data sets to predict the diffusion mode of nanoparticle trajectories as well as more complex biological variables, such as biological age. In this study, we develop a machine learning pipeline to predict and investigate changes to the brain ECS due to injury using supervised classification and feature importance calculations. We first validate the pipeline on three related but distinct MPT data sets from the living brain ECS-age differences, region differences, and enzymatic degradation of ECS structure. We predict three ages with 86% accuracy, three regions with 90% accuracy, and healthy versus enzyme-treated tissue with 69% accuracy. Since injury across groups is normally compared with traditional statistical approaches, we first used linear mixed effects models to compare features between healthy control conditions and injury induced by two different oxygen glucose deprivation exposure times. We then used machine learning to predict injury state using MPT features. We show that the pipeline predicts between the healthy control, 0.5 h OGD treatment, and 1.5 h OGD treatment with 59% accuracy in the cortex and 66% in the striatum, and identifies nonlinear relationships between trajectory features that were not evident from traditional linear models. Our work demonstrates that machine learning applied to MPT data is effective across multiple experimental conditions and can find unique biologically relevant features of nanoparticle diffusion.


Conflict of interest statement

Declaration of interests The authors declare no competing interests.

Figures

Figure 1
Figure 1
SHAP values of normal and Y-scrambled models for each data set. (A) Ranked SHAP features for XGBoost model trained on age data set with all features. (B) Ranked SHAP features for XGBoost model trained on Y-scrambled age data set with all features. (C) Ranked SHAP features for XGBoost model trained on region data set with all features. (D) Ranked SHAP features for XGBoost model trained on Y-scrambled region data set with all features. (E) Ranked SHAP features for XGBoost model trained on enzyme-treated data set with all features. (F) Ranked SHAP features for XGBoost model trained on Y-scrambled enzyme-treated data set with all features.
Figure 2
Figure 2
Distributions of statistically significant features for age data set when accounting for fixed effects. (A) Violin plots showing the distributions of the mean Deff1 feature for each age. (B) Violin plots showing the distribution of the mean straightness feature for each age. (C) Violin plots showing the distributions of the mean Deff1 feature for each age. (D) Violin plots showing the distribution of the mean straightness feature for each age. (E) Violin plots showing the distributions of the mean Deff1 feature for each age. (F) Violin plots showing the distribution of the mean straightness feature for each age. Statistical significance is indicated by p < 0.05, ∗∗p < 0.01, ∗∗∗p < 0.001.
Figure 3
Figure 3
Distributions of statistically significant features for region data set when accounting for fixed effects. (A) Violin plots showing the distributions of the mean Deff1 feature for each region. (B) Violin plots showing the distribution of the mean D_fit feature for each region. (C) Violin plots showing the distributions of the mean efficiency feature for each region. (D) Violin plots showing the distribution of the mean kurtosis feature for each region. (E) Violin plots showing the distributions of the mean fractal_dim feature for each region. (F) Violin plots showing the distribution of the mean Deff2 feature for each region. Statistical significance is indicated by p < 0.05, ∗∗p < 0.01, ∗∗∗p < 0.001.
Figure 4
Figure 4
Distributions of statistically significant features from cortex when accounting for fixed effects. (A) Violin plots showing the distributions of the mean MSD_ratio feature for HC, OGD 0.5 h, and OGD 1.5 h conditions in the cortex. (B) Violin plots showing the distribution of the mean fractal_dim feature for HC, OGD 0.5 h, and OGD 1.5 h conditions in the cortex. Statistical significance compared with HC (p < 0.05).
Figure 5
Figure 5
Distributions of statistically significant features from striatum when accounting for fixed effects. (A) Violin plots showing the distributions of the mean alpha feature for HC, OGD 0.5 h, and OGD 1.5 h conditions in the striatum. (B) Violin plots showing the distribution of the mean straightness feature for HC, OGD 0.5 h, and OGD 1.5 h conditions in the striatum. (C) Violin plots showing the distributions of the mean efficiency feature for HC, OGD 0.5 h, and OGD 1.5 h conditions in the striatum. (D) Violin plots showing the distributions of the mean fractal_dim feature for HC, OGD 0.5 h, and OGD 1.5 h conditions. Statistical significance compared with HC (p < 0.05).
Figure 6
Figure 6
Confusion matrices and feature importance values for disease progression predictions. (A) XGBoost predictions of 0.5 h OGD, 1.5 h OGD, and nontreated brain slices in the cortex. (B) SHAP feature importance values of 0.5 h OGD, 1.5 h OGD, and nontreated brain slices in the cortex. (C) XGBoost predictions of 0.5 h OGD, 1.5 h OGD, and nontreated brain slices in the cortex. (D) SHAP feature importance values for 0.5 h OGD, 1.5 h OGD, and nontreated brain slices in the cortex.
Figure 7
Figure 7
SHAP analysis of XGBoost models for each data set shows that mode of injury can be differentiated by unique subsets of trajectory features. Top 5 features determined by SHAP for the cortex for (A) HC, (B) 0.5 h OGD treatment, and (C) 1.5 h OGD treatment. (D) Top 5 features determined in the striatum by SHAP for (D) HC, (E) 0.5 h OGD treatment, and (F) 1.5 h OGD treatment.

References

    1. Long K.R., Huttner W.B. How the extracellular matrix shapes neural development. Open Biol. 2019;9 - PMC - PubMed
    1. Barros C.S., Franco S.J., Müller U. Extracellular matrix: functions in the nervous system. Cold Spring Harbor Perspect. Biol. 2011;3:a005108. - PMC - PubMed
    1. Suttkus A., Morawski M., Arendt T. Protective Properties of Neural Extracellular Matrix. Mol. Neurobiol. 2016;53:73–82. - PubMed
    1. Kamali-Zare P., Nicholson C. Brain extracellular space: geometry, matrix and physiological importance. Basic Clin. Neurosci. 2013;4:282–286. - PMC - PubMed
    1. Syková E., Nicholson C. Diffusion in Brain Extracellular Space. Physiol. Rev. 2008;88:1277–1340. - PMC - PubMed

Publication types

LinkOut - more resources