. 2024 Jul 30;11(10):uhae214.
doi: 10.1093/hr/uhae214. eCollection 2024 Oct.

Single-cell transcriptomic analysis of flowering regulation and vernalization in Chinese cabbage shoot apex

Single-cell transcriptomic analysis of flowering regulation and vernalization in Chinese cabbage shoot apex

Yun Dai et al. Hortic Res. .

Abstract

In Chinese cabbage development the interplay between shoot apex activity and vernalization is pivotal for flowering timing. The intricate relationship between various cell types in the shoot apex meristem and their roles in regulating flowering gene expression in Chinese cabbage is not yet fully understood. A thorough analysis of single-cell types in the Chinese cabbage shoot apex and their influence on flowering genes and vernalization is essential for deeper insight. Our study first established a single-cell transcriptomic atlas of Chinese cabbage after 25 days of non-vernalization. Analyzing 19 602 single cells, we differentiated them into 15 distinct cell clusters using established marker genes. We found that key genes in shoot apex development and flowering were primarily present in shoot meristematic cells (SMCs), companion cells (CCs), and mesophyll cells (MCs). MADS-box protein FLOWERING LOCUS C 2 (BrFLC2), a gene suppressing flowering, was observed in CCs, mirroring patterns found in Arabidopsis. By mapping developmental trajectories of SMCs, CCs, and MCs, we elucidated the evolutionary pathways of crucial genes in shoot apex development and flowering. The creation of a single-cell transcriptional atlas of the Chinese cabbage shoot apex under vernalization revealed distinct alterations in the expression of known flowering genes, such as VERNALIZATION INSENSITIVE 3 (VIN3), VERNALIZATION 1 (VRN1), VERNALIZATION 2 (VRN2), BrFLC, and FLOWERING LOCUS T (FT), which varied by cell type. Our study underscores the transformative impact of single-cell RNA sequencing (scRNA-seq) for unraveling the complex differentiation and vernalization processes in the Chinese cabbage shoot apex. These insights are pivotal for enhancing breeding strategies and cultivation management of this vital vegetable.


Conflict of interest statement

The authors confirm that they have no conflicts of interest concerning this research.

Figures

Figure 1
Figure 1
Generation of a cell atlas for the Chinese cabbage shoot apex. A This schematic illustrates the isolation of protoplast cells from the Chinese cabbage shoot apex and their subsequent placement on the 10× Genomics platform. Short scale bar represents 200 μm; long scale bar represents 1000 μm. B  t-SNE visualization shows 15 identified cell clusters in the Chinese cabbage shoot apex. Each dot represents an individual cell, with colors indicating the corresponding clusters. C Bubble plot demonstrating expression patterns and distributions of cluster-specific genes, aiding in cell type identification within the Chinese cabbage shoot apex. These plots show both the average expression level (by color) and the proportion of cells expressing each gene (by dot size).
Figure 2
Figure 2
Discovery of novel marker genes in cell-type clusters. A The heat map displays the top five DEGs with the highest log2 TPM expression levels in each subcluster (Supplementary Data Table S2). Red signifies high expression levels, while blue denotes low expression levels. B Expression patterns of 12 new marker genes distributed on the t-SNE map. The color gradient in each t-SNE plot represents the expression level of the gene, with darker points indicating higher expression and lighter points indicating lower expression.
Figure 3
Figure 3
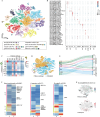
Comparison of Chinese cabbage and Arabidopsis shoot apexes at single-cell resolution. A  t-SNE visualization shows 19 identified cell clusters in the Arabidopsis shoot apex. Each dot represents an individual cell, with colors indicating the corresponding clusters. B Bubble plot demonstrating expression patterns and distributions of cluster-specific genes, aiding in cell type identification within the Arabidopsis shoot apex. These plots show both the average expression level (by color) and the proportion of cells expressing each gene (by dot size). C Pairwise correlations of Chinese cabbage (top) and Arabidopsis (left) shoot apex cell clusters, with dots indicating statistically significant correlations. CC, companion cell; EC, epidermal cell; GC, guard cell; MC, mesophyll cell; PC, primordial cell; SMC, shoot meristematic cell; VC, vascular cell; UC, unknown cell. D  t-SNE plot depicting cell clusters in Chinese cabbage and Arabidopsis shoot apex cells, with dotted circles marking common MC, CC, and SMC clusters. E Sankey diagrams showing the similarity of Chinese cabbage to Arabidopsis across cell clusters. All clusters were generated after merging the Arabidopsis and Chinese cabbage scRNA data on the left (Supplementary Data Fig. S5B). Cluster numbers for Chinese cabbage (Fig. 1B) and Arabidopsis (Fig. 3A) shoot apex cells are given on the right. F Gene clustering of the SMC, CC, and MC clusters. A = C indicates genes with conserved expression in Arabidopsis (A) and Chinese cabbage (C), and A > C and A < C indicate genes specifically expressed in Arabidopsis or Chinese cabbage, respectively. The displayed genes are related to shoot development and flowering genes. Red shows high expression levels, while blue represents low expression levels. G  BrFLC2 and AtFLC expression pattern in Arabidopsis and Chinese cabbage, as plotted using t-SNE.
Figure 4
Figure 4
Preliminary analysis of the molecular function of Chinese cabbage BrFLC2. A Illustration of BrFLC2 genome structure. B Phylogenetic tree of BrFLC2 homologs in various plant species. C Subcellular localization of BrFLC2 protein in the tobacco nucleus. Scale bar, 25 μm. D  BrFLC2 coding sequences from BrFLC2-OX lines cloned by PCR. E, F Phenotypes of BrFLC2-OX, flc, and WT lines grown in medium for 10 and 25 days after planting. GI Relative expression of BrFLC2, AtFT, and AtSOC in BrFLC2-OX, flc, and WT lines. Error bars indicate the standard error (n = 3). JL Days to bolting, flowering, and seed setting in BrFLC2-OX, flc, and WT lines. Error bars indicate the standard error (n = 10). M Expression pattern of BrFT and BrSOC in Chinese cabbage, as plotted on t-SNE. N Transcriptional activation function of BrFLC2 and BrMSI4 in yeast, with DDO representing SD/−Trp/−Leu, and TDO/X representing SD/−Trp/−His/−Leu medium supplemented with X-α-gal. O BrFLC2 and BrMSI4 interaction in tobacco epidermal cells, demonstrated by the luciferase complementation assay.
Figure 5
Figure 5
Pseudo-time trajectory analysis of cell types in the Chinese cabbage shoot apex. A Development trajectory of all shoot apex cells and the placement of each cell cluster in the trajectory map. B Placement of each individual cell cluster in the trajectory map. C Trajectory analysis dividing single cells into five differentiation states. D Pseudo-time trajectory analysis of five key marker genes’ expression patterns across five states. E Cell distribution within each cluster and pseudo-time trajectory. F Heat map showing the average expression levels of flowering genes across all cell trajectories. Red represents a high expression level. G Heat map showing average expression levels of flowering genes in five states, with red representing high expression and blue representing low expression. H Distribution of expression of eight flowering genes in the t-SNE map and heat map.
Figure 6
Figure 6
Developmental trajectory of companion cells from mesophyll cells and shoot meristematic cells. AC Distribution of cell clusters, differentiation states, and branches along the pseudo-time trajectory of mesophyll development. D Clustering and expression dynamics of DEGs along the main stem of the pseudo-time trajectory. E Heat map showing average expression of relevant genes across five cell differentiation states, with red representing high expression and blue denoting low expression. F Expression distribution of six representative flowering genes in the cell differentiation state. G Expression distribution of six representative flowering genes in different branches. H A putative model for the developmental and differentiation patterns of companion cells from mesophyll cells and shoot meristematic cells.
Figure 7
Figure 7
Differential gene expression patterns across various cell types during vernalization. A Chinese cabbage shoot apex sample pattern maps for control and vernalization treatments Short scale bar, 200 μm; long scale bar, 1000 μm; le, leaf or leaf primordium. B DEGs between control and vernalization treatments in different cell types. C Average expression and flowchart of each gene of the vernalization pathway in different cell types. V represents vernalization; NV represents non-vernalization. Red and blue represent high and low expression levels, respectively. D Venn diagram showing the distribution of overlapping DEGs between different cell types. E Relative expression of TFs in two samples in each cell type. Red signifies high expression levels, while blue indicates low expression levels. F GO-annotated DEG information related to flowering and shoot development and expression levels of SOBIR1 genes in different cell types of the two samples. The depth of red represents the number of DEGs.

Similar articles

Cited by

References

    1. Dai Y, Sun X, Wang CG. et al. Gene co-expression network analysis reveals key pathways and hub genes in Chinese cabbage (Brassica rapa L.) during vernalization. BMC Genomics. 2021;22:236. - PMC - PubMed
    1. Luo X, He YH. Experiencing winter for spring flowering: a molecular epigenetic perspective on vernalization. J Integr Plant Biol. 2020;62:104–17 - PubMed
    1. Searle I, He YH, Turck F. et al. The transcription factor FLC confers a flowering response to vernalization by repressing meristem competence and systemic signaling in Arabidopsis. Genes Dev. 2006;20:898–912 - PMC - PubMed
    1. Levy YY, Mesnage S, Mylne JS. et al. Multiple roles of Arabidopsis VRN1 in vernalization and flowering time control. Science. 2002;297:243–6 - PubMed
    1. He YH, Chen T, Zeng XL. Genetic and epigenetic understanding of the seasonal timing of flowering. Plant Commun. 2019;1:100008 - PMC - PubMed

LinkOut - more resources