. 2024 Oct 8;7(4):e70006.
doi: 10.1002/jsp2.70006. eCollection 2024 Dec.

Inactivation of Tnf-α/Tnfr signaling attenuates progression of intervertebral disc degeneration in mice

Affiliations

Inactivation of Tnf-α/Tnfr signaling attenuates progression of intervertebral disc degeneration in mice

Chu Tao et al. JOR Spine. .

Abstract

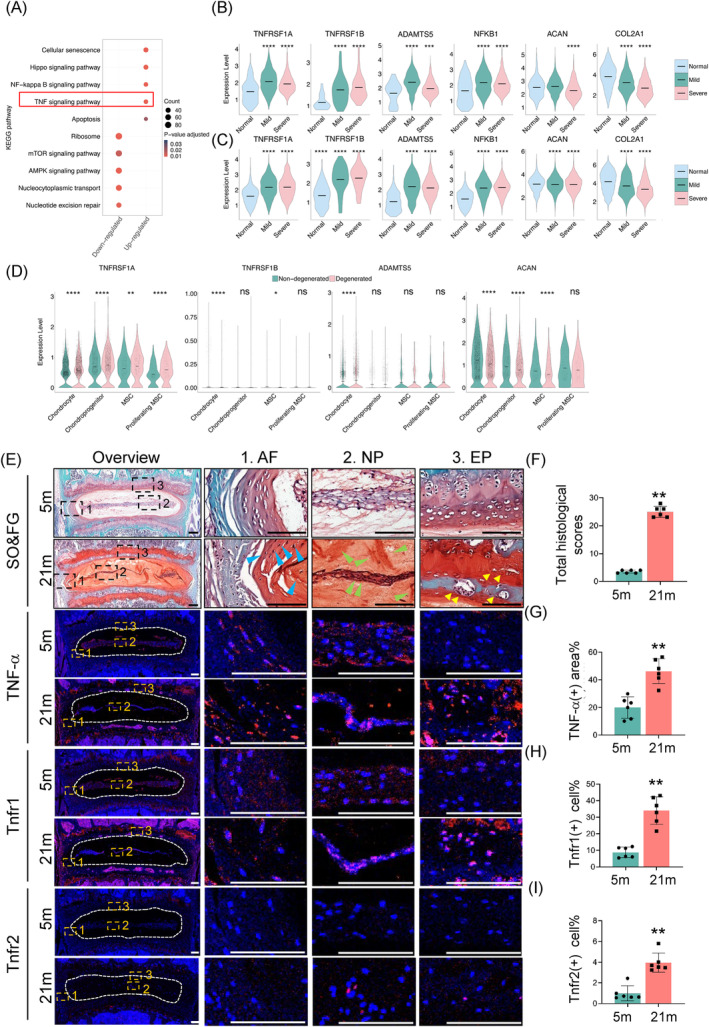
Background: Intervertebral disc degeneration (IVDD) is a major cause of low back pain (LBP), worsened by chronic inflammatory processes associated with aging. Tumor necrosis factor alpha (Tnf-α) and its receptors, Tnf receptor type 1 (Tnfr1) and Tnf receptor type 2 (Tnfr2), are upregulated in IVDD. However, its pathologic mechanisms remain poorly defined.

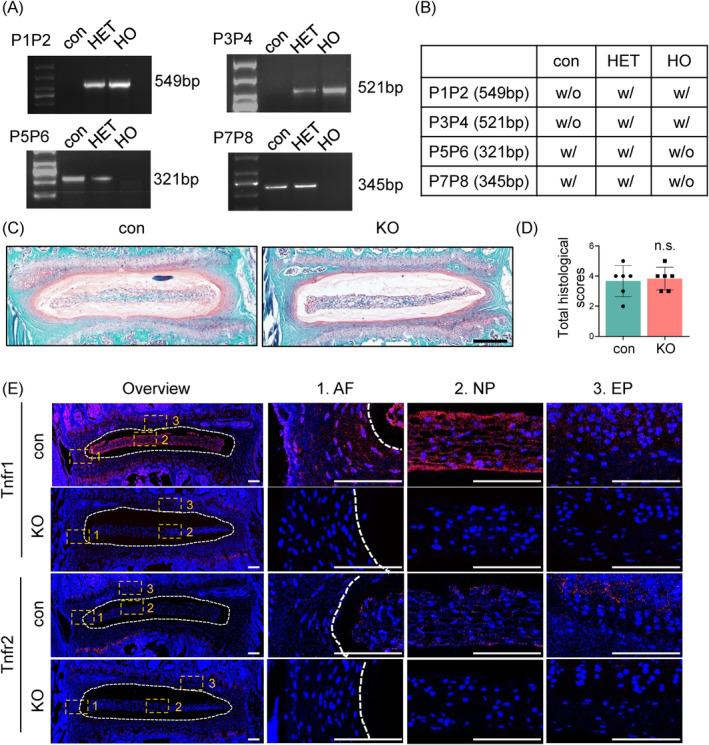
Methods: To investigate the role of Tnfr in IVDD, we generated global Tnfr1/2 double knockout (KO) mice and age-matched control C57BL/6 male mice, and analyzed intervertebral disc (IVD)-related phenotypes of both genotypes under physiological conditions, aging, and lumbar spine instability (LSI) model through histological and immunofluorescence analyses and μCT imaging. Expression levels of key extracellular matrix (ECM) proteins in aged and LSI mice, especially markers of cell proliferation and apoptosis, were evaluated in aged (21-month-old) mice.

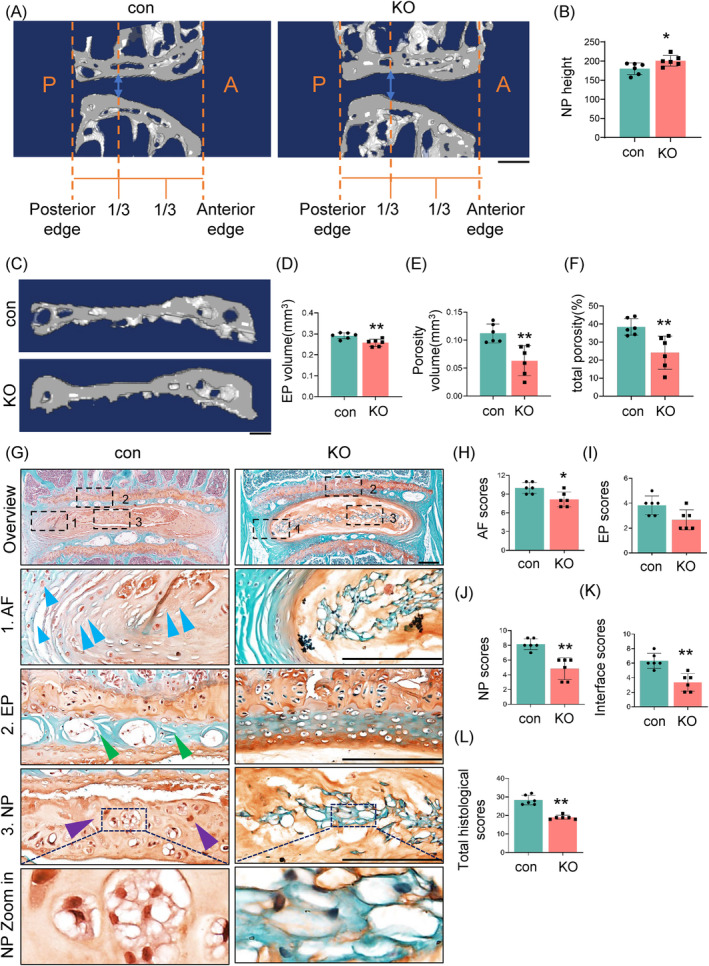
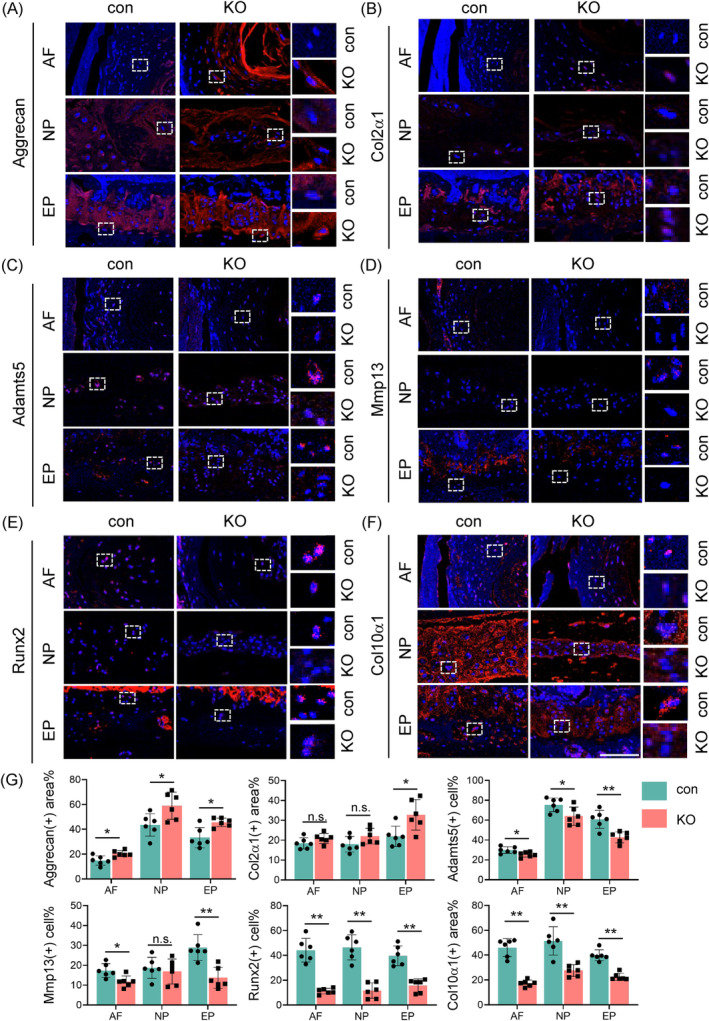
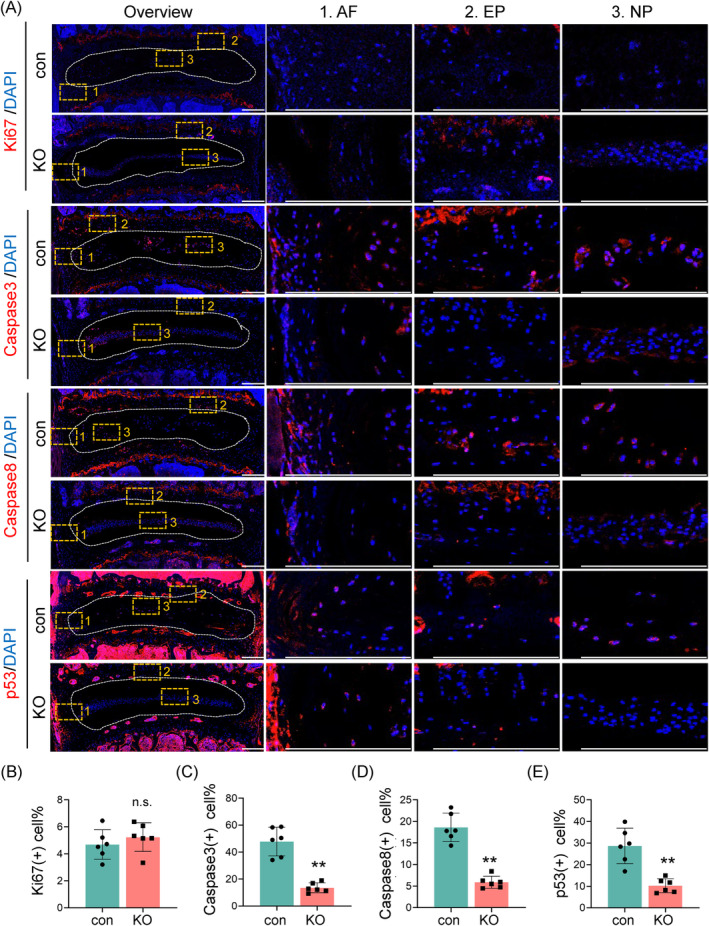
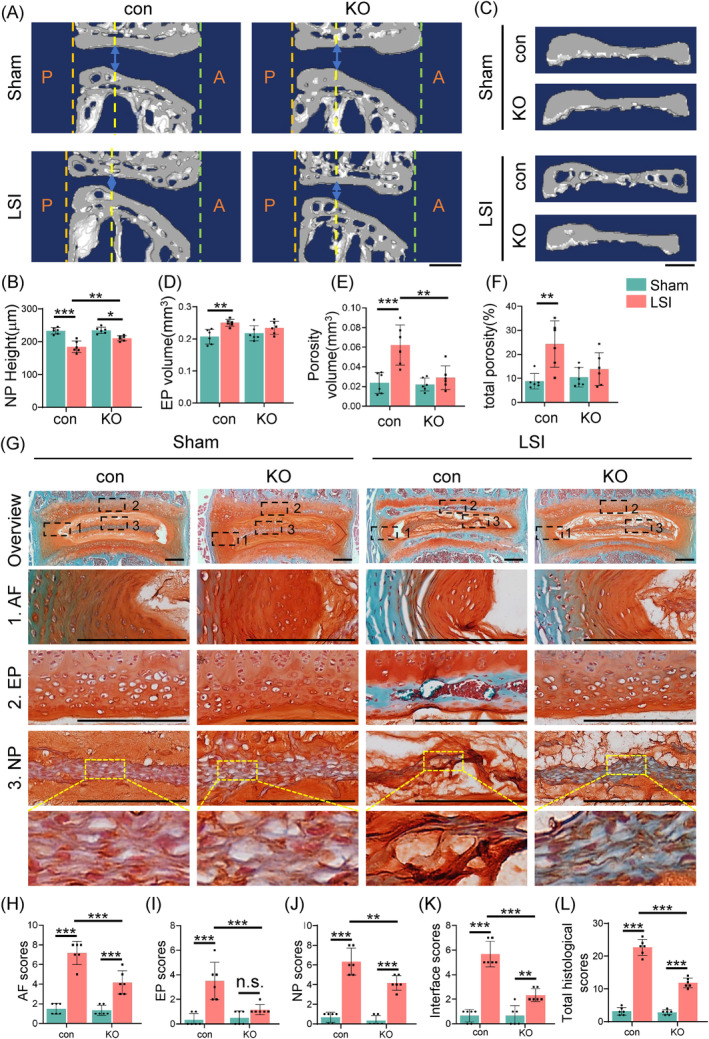
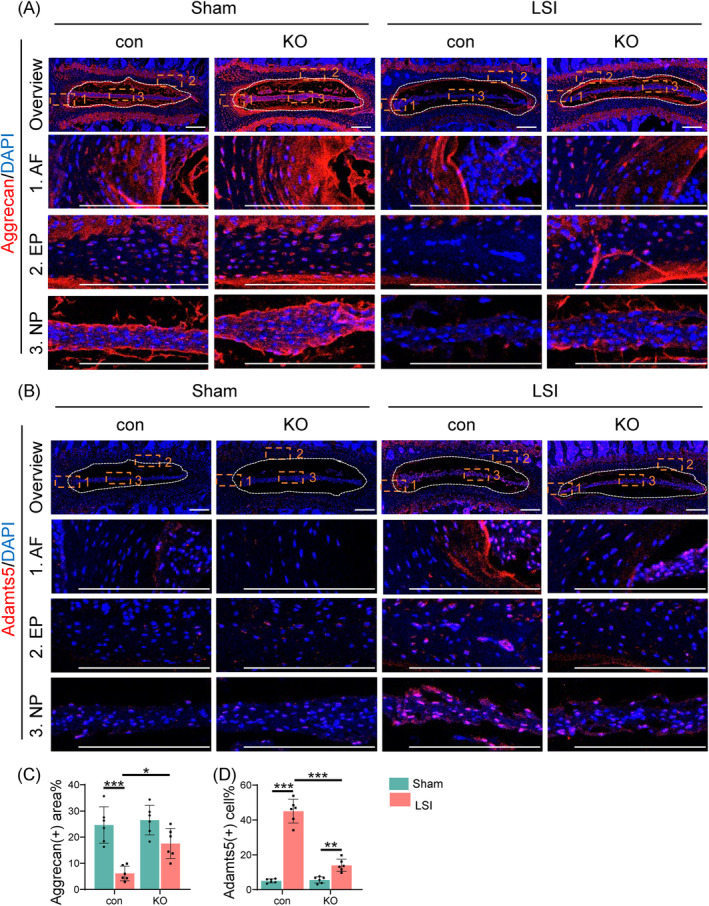
Results: At 4 months, KO and control mice showed no marked differences of IVDD-related parameters. However, at 21 months of age, the loss of Tnfr expression significantly alleviated IVDD-like phenotypes, including a significant increase in height of the nucleus pulposus (NPs) and reductions of endplates (EPs) porosity and histopathological scores, when compared to controls. Tnfr deficiency promoted anabolic metabolism of the ECM proteins and suppressed ECM catabolism. Tnfr loss largely inhibited hypertrophic differentiation, and, in the meantime, suppressed cell apoptosis and cellular senescence in the annulus fibrosis, NP, and EP tissues without affecting cell proliferation. Similar results were observed in the LSI model, where Tnfr deficiency significantly alleviated IVDD and enhanced ECM anabolic metabolism while suppressing catabolism.

Conclusion: The deletion of Tnfr mitigates age-related and LSI-induced IVDD, as evidenced by preserved IVD structure, and improved ECM integrity. These findings suggest a crucial role of Tnf-α/Tnfr signaling in IVDD pathogenesis in mice. Targeting this pathway may be a novel strategy for IVDD prevention and treatment.

Keywords: TNF receptor; intervertebral disc degeneration; tumor necrosis factor‐α.


Conflict of interest statement

The authors declare that they have no competing financial interests.

Figures

FIGURE 1
FIGURE 1
The expression of TNF signaling pathway is up‐regulated in IVD in IVDD humans and mice. (A) KEGG ontology enrichment results of up‐regulated and down‐regulated gene sets of NPCs. (B) Violin plots illustrating the expression levels of key differentially expressed genes (TNFRSF1A, TNFRSF1B, ADAMTS5, NFKB1, ACAN, and COL2A1) in NPCs between normal, mild and severe groups. (C) Violin plots illustrating the expression levels of key differentially expressed genes (TNFRSF1A, TNFRSF1B, ADAMTS5, NFKB1, ACAN, and COL2A1) in AFCs between normal, mild and severe groups. (D) Typical gene expression profiles in each cell cluster from EP (TNFRSF1A, TNFRSF1B, ADAMTS5, and ACAN), comparing non‐degenerated and degenerated groups. (E) Safranin O and Fast Green (SO&FG) staining and immunofluorescence (IF) staining of TNF‐α, Tnfr1, and Tnfr2 of lumbar IVD sections from the 5‐ and 21‐month‐old male C57BL/6 mice. Images of high magnification views of AF, NP, and EP were detailed on the right panels. White dashed lines showed the boundary between NP and AF. Scale bar, 100 μm. (F) Total histological scores of lumbar IVDs of (E). N = 6 mice per group. (G)–(I) Quantitative analysis of the positive areas or cells for TNF‐α (G), Tnfr1(H), and Tnfr2(I) in lumbar IVDs. N = 6 for each group. Results were expressed as mean ± standard deviation (s.d.). ns, no significant difference, *p <0.05, **p <0.01, ***p <0.001, ****p <0.0001.
FIGURE 2
FIGURE 2
Genetic deletion of Tnfr1/2 in mice. (A) PCR genotyping using tail DNA. P1&P2: TNFR1/2 KO band, ~549 bp; wildtype (WT) showed no band; P3&P4: TNFR1/2 KO band, ~521 bp; WT showed no band; P5&P6: TNFR1/2 KO showed no band; WT band, ~321 bp; P7&P8:TNFR1/2 KO showed no band; wildtype (WT) band, ~345 bp; (B) Genotype determination table. Based on the agarose gel results (A), the mouse genotype was determined as homozygous (HO), heterozygous (HET), or control (con) according to the combinations in the table. w/o, without; w/, with. (C) SO&FG staining of lumbar IVD sections from 4‐month‐old male con and KO mice. Scale bar, 200 μm. (D) Total histological scores of lumbar IVDs of (C). N = 6 for each group. (E), IF staining of Tnfr1 and Tnfr2 in lumbar IVDs from 4‐month‐old male con and KO mice. Images of high magnification views of AF, NP and EP (yellow dashed boxes) were detailed on the right panels. Yellow dashed lines showed the boundary between NP and AF. Scale bar, 100 μm. Results were expressed as mean ± standard deviation (s.d.). ns, no significant difference.
FIGURE 3
FIGURE 3
Tnfr deletion improves age‐related IVDD‐like phenotypes in lumbar IVDs in aged mice. (A) Representative sagittal μCT image of a L4‐5 lumbar IVDs from 21‐month‐old con and KO male mice. The blue arrow indicated height of NP; (P, posterior; A, anterior) scale bars, 100 μm. (B) Quantification of NP height of L4‐5 lumbar IVDs from 21‐month‐old male con and KO mice, N = 6 mice per group. (C) Representative three‐dimensional images of L4‐5 EPs from 21‐month‐old male con and KO mice. Scale bars, 100 μm. (D)–(F) Quantitative analysis of EP volume (D), Porosity volume (E) and the percentage of porosity (F) of L4‐5 EPs from 21‐month‐old male con and KO mice, N = 6 mice per group. (G), SO&FG staining of lumbar IVDs from 21‐month‐old male con and KO mice. Images of high magnification views of AF, NP, and EP (black dashed boxes) were detailed on the lower panels. Scale bar, 200 μm. (H)–(L) Evaluation of AF scores (H), EP scores (I), NP scores (J), Interface scores (K), and total histological scores (L), N = 6 mice per group. Results were expressed as mean ± standard deviation (s.d.). ns, no significant difference, *p <0.05, **p <0.01.
FIGURE 4
FIGURE 4
Tnfr deletion modulates ECM homeostasis in IVDs in aged mice. (A)–(F) IF staining of AF, NP, and EP of Aggrecan (A), Col2α1 (B), Adamts5 (C), Mmp13 (D), Runx2 (E), and Col10α1(F) of lumbar IVDs from 21‐month‐old male con and KO mice. Scale bars, 100 μm. (G) Quantitative analysis of the positive areas or cells for Aggrecan, Col2α1, Adamts5, Mmp13, Runx2, and Col10α in AF, NP and EP tissues. N = 6 mice per group. Results were expressed as mean ± standard deviation (s.d.). ns, no significant difference, *p <0.05, **p <0.01.
FIGURE 5
FIGURE 5
Effects of Tnfr deletion on cell proliferation and apoptosis in IVDs in aged mice. (A) IF staining of Ki‐67, Caspase3, Caspase8 and p53 of lumbar IVDs from 21‐month‐old male con and KO mice. Images of high magnification views of AF, NP, and EP (yellow dashed boxes) were detailed on the right panels. Scale bar, 200 μm. (B)–D) Quantitative analysis of the positive cells for Ki‐67 (B), Caspase3 (C), Caspase8 (D) and p53 (E) in lumbar IVDs. N = 6 mice per group. Results were expressed as mean ± standard deviation (s.d.). ns, no significant difference, **p <0.01.
FIGURE 6
FIGURE 6
Tnfr deletion mitigates LSI‐induced IVDD‐like phenotypes in mice. (A) Representative sagittal μCT image of L4‐5 lumbar IVDs from control and KO male mice post 8 weeks of LSI or sham surgery at 3 months of age. The blue arrow indicated the height of NP (P, posterior; A, anterior), scale bars, 100 μm. (B) Quantification of NP height of L4‐5 lumbar IVDs from (A), N = 6 mice per group. (C) Representative 3D images of L4‐5 EPs from (A). Scale bars, 100 μm. (D)–(F) Quantitative analysis of EP volume (D), Porosity volume (E) and the percentage of porosity (F) of L4‐5 EPs from (C), N = 6 mice per group. (G) SO&FG staining of lumbar IVDs from control and KO male mice post 8 weeks of LSI or sham surgery at 3 months of age. Images of high magnification views of AF, EP and NP (black dashed boxes) were detailed on the lower panels. Scale bar, 200 μm. (H)–(L) Evaluation of AF scores (H), EP scores (I), NP scores (J), Interface scores (K), and total histological scores (L), N = 6 mice per group. Results were expressed as mean ± standard deviation (s.d.). ns, no significant difference, *p <0.05, **p <0.01, ***p < 0.001.
FIGURE 7
FIGURE 7
Tnfr deletion enhances ECM homeostasis in LSI‐induced IVD in mice. (A) IF staining of Aggrecan in lumbar IVDs from control and KO male mice post 8 weeks of LSI or sham surgery at 3 months of age. Images of high magnification views of AF,EP and NP (yellow dashed boxes) were detailed on the below panels. (B) IF staining of Adamts5 in lumbar IVDs from control and KO male mice post 8 weeks of LSI or sham surgery at 3 months of age. Images of high magnification views of AF,EP and NP (yellow dashed boxes) were detailed on the below panels. (C), Quantification of aggrecan‐positive areas in lumbar IVDs. N = 6 mice per group. (D) Quantification of Adamts5‐positive cells in lumbar. N = 6 mice per group. Results were expressed as mean ± standard deviation (s.d.). *p <0.05, **p <0.01, ***p <0.001.

Similar articles

Cited by

References

    1. Balagué F, Mannion AF, Pellisé F, Cedraschi C. Non‐specific low back pain. Lancet. 2012;379(9814):482‐491. - PubMed
    1. Zhou T, Salman D, McGregor AH. Recent clinical practice guidelines for the management of low back pain: a global comparison. BMC Musculoskelet Disord. 2024;25(1):344. - PMC - PubMed
    1. Chen S, Chen M, Wu X, et al. Global, regional and national burden of low back pain 1990‐2019: a systematic analysis of the global burden of disease study 2019. J Orthop Transl. 2022;32:49‐58. - PMC - PubMed
    1. Wu X, Lin S, Liao R, et al. Brief research report: effects of pinch deficiency on cartilage homeostasis in adult mice. Front Cell Dev Biol. 2023;11:1116128. - PMC - PubMed
    1. van Uden S, Silva‐Correia J, Oliveira JM, Reis RL. Current strategies for treatment of intervertebral disc degeneration: substitution and regeneration possibilities. Biomater Res. 2017;21:22. - PMC - PubMed