. 2024 Sep 26:4:1397036.
doi: 10.3389/fbinf.2024.1397036. eCollection 2024.

Pangenome comparison via ED strings

Affiliations

Pangenome comparison via ED strings

Esteban Gabory et al. Front Bioinform. .

Abstract

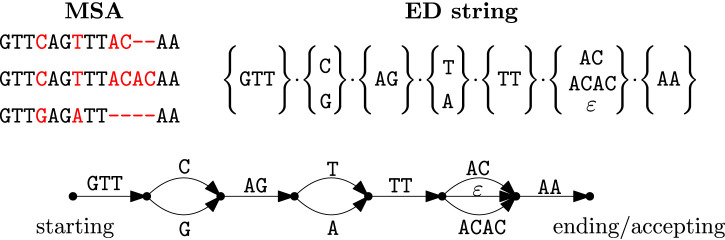
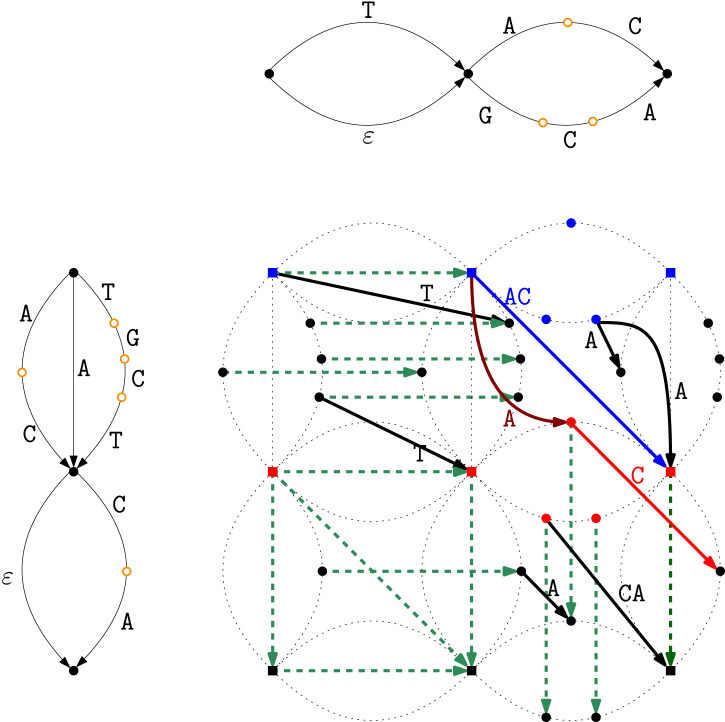
Introduction: An elastic-degenerate (ED) string is a sequence of sets of strings. It can also be seen as a directed acyclic graph whose edges are labeled by strings. The notion of ED strings was introduced as a simple alternative to variation and sequence graphs for representing a pangenome, that is, a collection of genomic sequences to be analyzed jointly or to be used as a reference.

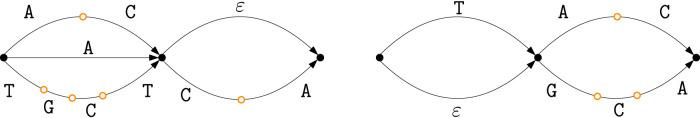
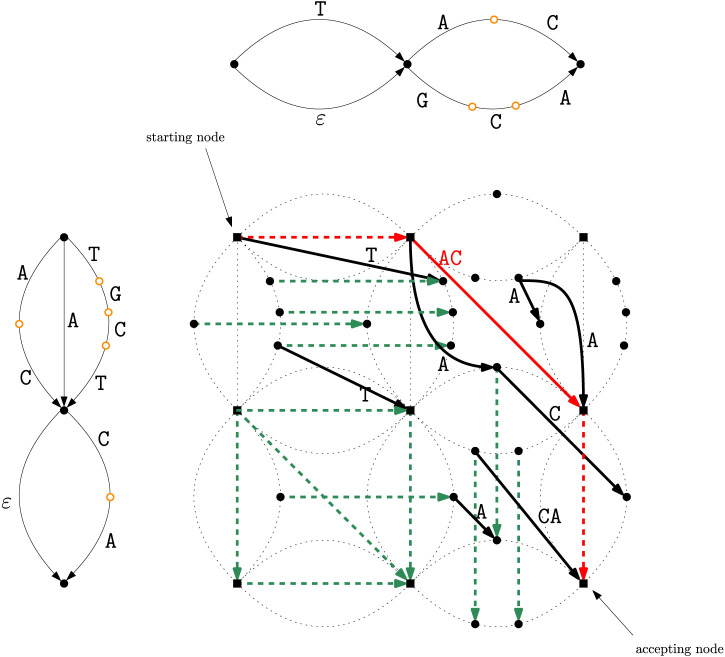
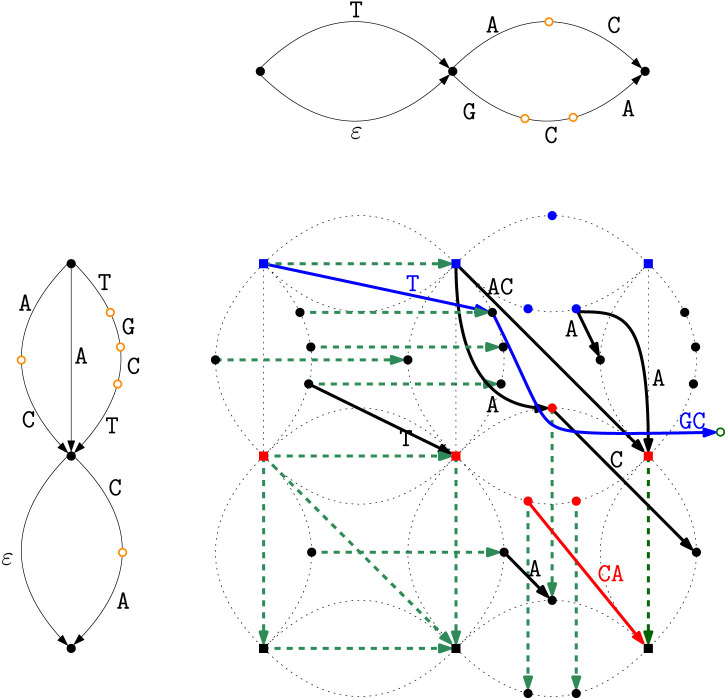
Methods: In this study, we define notions of matching statistics of two ED strings as similarity measures between pangenomes and, consequently infer a corresponding distance measure. We then show that both measures can be computed efficiently, in both theory and practice, by employing the intersection graph of two ED strings.

Results: We also implemented our methods as a software tool for pangenome comparison and evaluated their efficiency and effectiveness using both synthetic and real datasets.

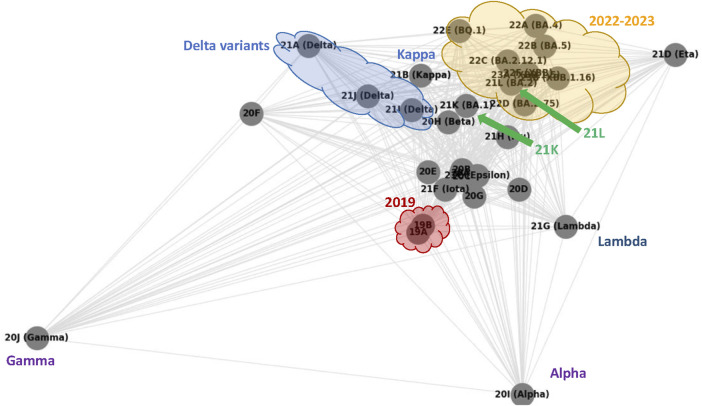
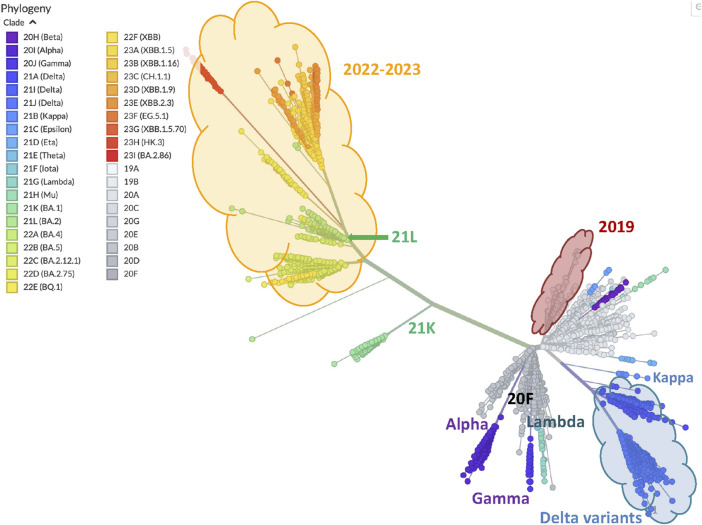
Discussion: As for efficiency, we compare the runtime of the intersection graph method against the classic product automaton construction showing that the intersection graph is faster by up to one order of magnitude. For showing effectiveness, we used real SARS-CoV-2 datasets and our matching statistics similarity measure to reproduce a well-established clade classification of SARS-CoV-2, thus demonstrating that the classification obtained by our method is in accordance with the existing one.

Keywords: SARS-CoV-2; elastic-degenerate string; intersection graph; matching statistics; pangenome comparison.


Conflict of interest statement

The authors declare that the research was conducted in the absence of any commercial or financial relationships that could be construed as a potential conflict of interest.

Figures

FIGURE 1
FIGURE 1
An example of an MSA (top left) and its corresponding (non-unique) ED string T of length n=7 , cardinality m=11 and size N=20 (top right), and edge-labeled DAG for T . Note that ε denotes the empty string. The DAG can also be viewed as an NFA with extended (multi-letter) transitions.
FIGURE 2
FIGURE 2
The two DAGs G1 and G2 for ED strings T1 and T2 . The filled black nodes are explicit states, while the orange empty nodes are implicit states.
FIGURE 3
FIGURE 3
Intersection graph G for T1 and T2 , where G1 and G2 are shown at the left and on the top, respectively, to simplify the understanding of G . A node (i,j) in the intersection is represented by a square if both i and j are explicit nodes, and by a circle if only one of them is. The dashed edges of the intersection graph G correspond to ε -transitions (namely, transitions such that no letter is read when traversed), while the solid edges correspond to the other extended transitions. A string in L(T1)L(T2) corresponds to a path from the starting node of G to the accepting node. Here the intersection is nonempty and contains a single string AC , which can be read on the red path.
FIGURE 4
FIGURE 4
Matching Statistics of T1 and T2 of our running example on their intersection graph G , where, again - to simplify the understanding - we also draw G1 and G2 at the left and on the top, respectively. Note that this time, the pairs of implicit nodes that are reachable in a single extended transition from a pair that was previously computed are added. In the figure, there is only one such extra node, which is represented by a green open circle at the right of the graph. Here we highlight the paths that are relevant for computing the Matching Statistics array MST1,T2 . To compute MST1,T2[1] , we look at the paths starting at nodes (i,j) where i is the explicit state one in the path-automaton of T1 , and return the length of the longest label of such a path. These are the paths starting in one of the blue nodes (these are the nodes that correspond to the uppermost explicit node of G1 paired with any node of G2 , that is, they correspond to the uppermost dotted copy of G2 ). The longest one of such paths (also drawn in blue) corresponds to the string TGC having length 3; therefore, MST1,T2[1]=3 . For MST1,T2[2] we do the same but using as starting nodes those in red that correspond to the internal explicit node of G1 paired with any node of G2 (i.e., the nodes of the middle dotted copy of G2 ). Here the longest path is drawn in red and it spells the string CA , and therefore we set MST1,T2[2]=2 . Computing MST2,T1 can be performed in a dual manner on the same graph, but using as starting nodes those of the leftmost dotted copy of G1 for MST2,T1[1] , and those of the middle dotted copy of G1 for MST2,T1[2] .
FIGURE 5
FIGURE 5
Breakpoint Matching Statistics computation in the intersection graph G of T1 and T2 . To compute BMST1,T2[1] , the candidate starting nodes of the match in G are those in blue: nodes (i,j) where i is an explicit state of T1 in the uppermost dotted copy of G2 , and j is either an explicit state of T2 (squared blue nodes) or an implicit one (circled blue nodes). Note that TGC is the longest match that starts at the first set of T1 but it does not fulfill the conditions for the Breakpoint Matching Statistics because it does not end at any breakpoint; for the same reason, TG is also not a good candidate match. The occurrence of AC corresponding to the blue edge starts at a blue square node; hence it is reachable from the node itself that corresponds to a pair of explicit states, and it ends at a node that is again a pair of explicit states, and hence a breakpoint for both T1 and T2 . There is no longer match satisfying these conditions; therefore we set BMST1,T2[1]=2 . For BMST1,T2[2] we do the same but use as starting nodes those in red that correspond to the internal explicit node of G1 paired with any node of G2 (i.e., the nodes of the middle dotted copy of G2 ). The red path spelling C : (i) is a prefix in T1[2] starting at an explicit node of T1 ; (ii) is reachable from a square node in G by spelling A in both strings (curved brown red edge labeled with A ); and (iii) ends where T2[2] does, that is, at a breakpoint. Since this is the longest such path in G , we set BMST1,T2[2]=1 . Note, for example, that the match CA that occurs in T1[2] and inside T2[2] cannot be used for BMST1,T2[2] because it starts at a node that is not reachable from a pair of explicit nodes, meaning that it is not upperbounded by a breakpoint in T2 . Computing BMST2,T1 , which is of size n2=2 , can be done in a dual manner on the very same graph, using as starting nodes those of the leftmost dotted copy of G1 for BMST2,T1[1]=2 (obtained by traversing an ε -transition and then AC ), and those of the middle dotted copy of G1 for BMST2,T1[2]=2 ( AC again).
FIGURE 6
FIGURE 6
SARS-CoV-2 clades pairwise similarity graph generated according to average Breakpoint Matching Statistics. The annotation (all non grey nor black graphics and text) highlights similarities with Figure 7.
FIGURE 7
FIGURE 7
Phylogeny of 3357 SARS-CoV-2 genomes samples. The figure is generated and downloaded from Nextstrain https://nextstrain.org/ncov/open/global/all-time (2024), and some annotation is added here to highlight similarities with the graph of Figure 6.

Similar articles

Cited by

References

    1. Alzamel M., Ayad L. A. K., Bernardini G., Grossi R., Iliopoulos C. S., Pisanti N., et al. (2018). “Degenerate string comparison and applications,”. 18th international workshop on algorithms in bioinformatics, WABI 2018, August 20-22, 2018, Helsinki, Finland. Editors Parida L., Ukkonen E. (Schloss Dagstuhl: LIPIcs; ), 21, 1–21:14. 113 of LIPIcs . 10.4230/LIPIcs.WABI.2018.21 - DOI
    1. Alzamel M., Ayad L. A. K., Bernardini G., Grossi R., Iliopoulos C. S., Pisanti N., et al. (2020). Comparing degenerate strings. Fundam. Inf. 175, 41–58. 10.3233/FI-2020-1947 - DOI
    1. Aoyama K., Nakashima Y., I T., Inenaga S., Bannai H., Takeda M. (2018). “Faster online elastic degenerate string matching,”. Annual symposium on combinatorial pattern matching, CPM 2018, july 2-4, 2018 - qingdao, China. Editors Navarro G., Sankoff D., Zhu B. (Schloss Dagstuhl: LIPIcs; ), 9, 1–9:10. 10.4230/LIPIcs.CPM.2018.9 - DOI
    1. Apostolico A., Guerra C., Landau G. M., Pizzi C. (2016). Sequence similarity measures based on bounded hamming distance. Theor. Comput. Sci. 638, 76–90. 10.1016/J.TCS.2016.01.023 - DOI
    1. Apostolico A., Guerra C., Pizzi C. (2014). “Alignment free sequence similarity with bounded hamming distance,” in Data compression conference, DCC 2014, snowbird, UT, USA, 26-28 march, 2014. Editors Bilgin A., Marcellin M. W., Serra-Sagristà J., Storer J. A. (IEEE; ), 183–192. 10.1109/DCC.2014.57 - DOI

LinkOut - more resources