. 2024 Sep 22;10(19):e38259.
doi: 10.1016/j.heliyon.2024.e38259. eCollection 2024 Oct 15.

Cross-species comparison of airway epithelium transcriptomics

Affiliations

Cross-species comparison of airway epithelium transcriptomics

Biyu Gui et al. Heliyon. .

Abstract

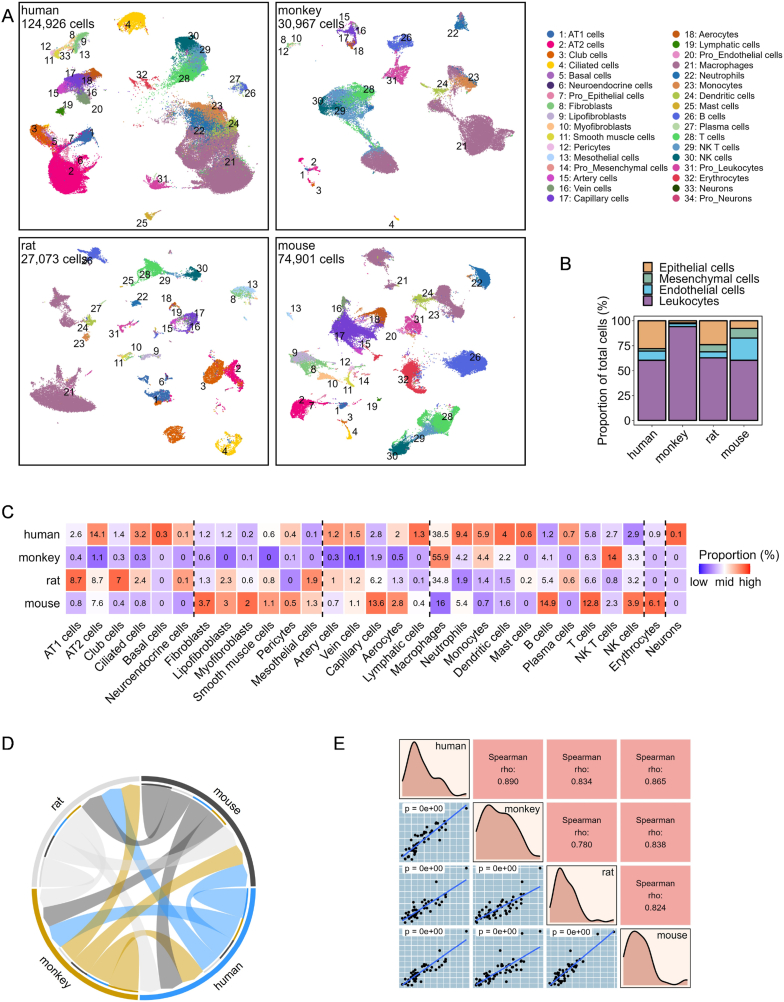
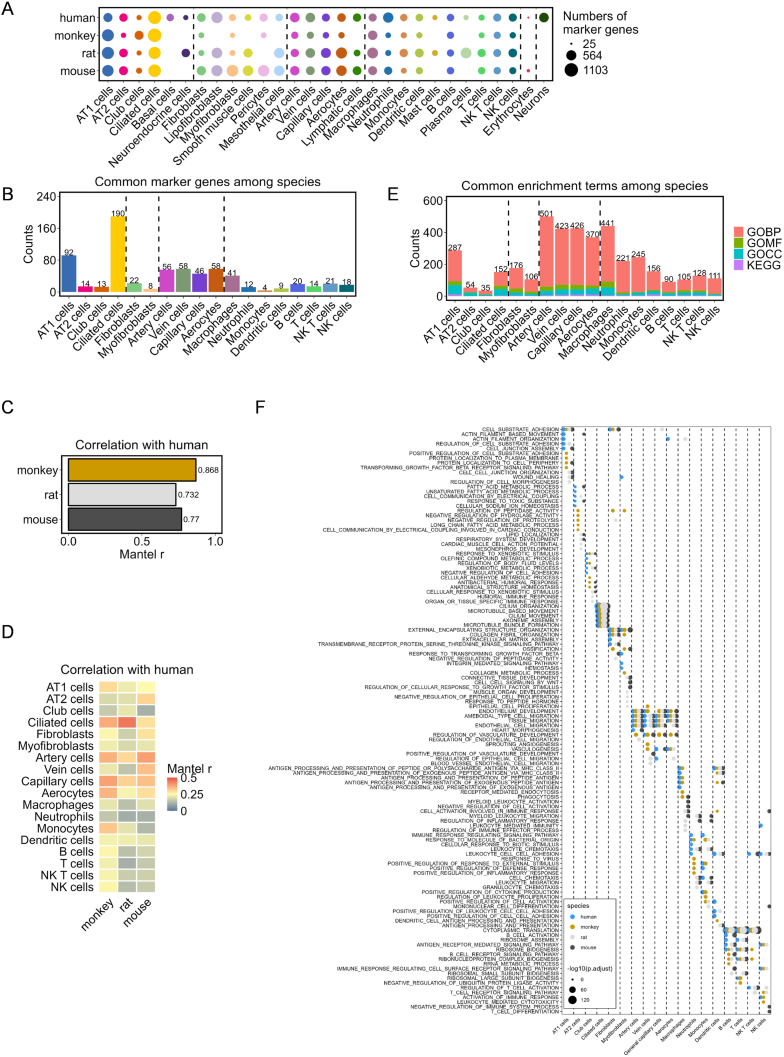
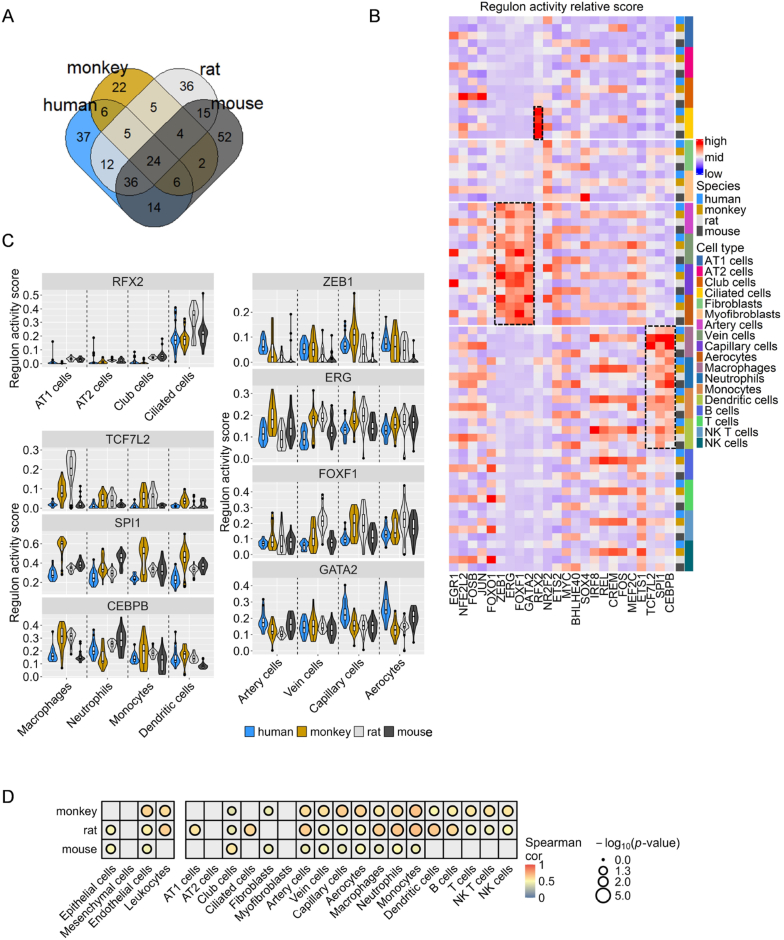
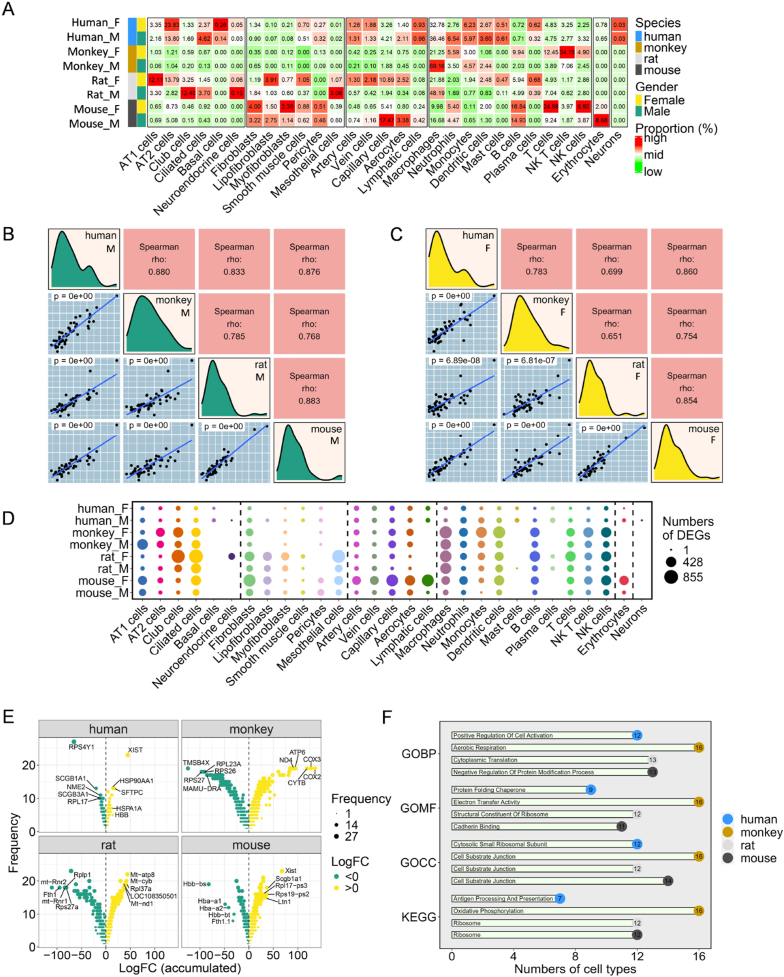
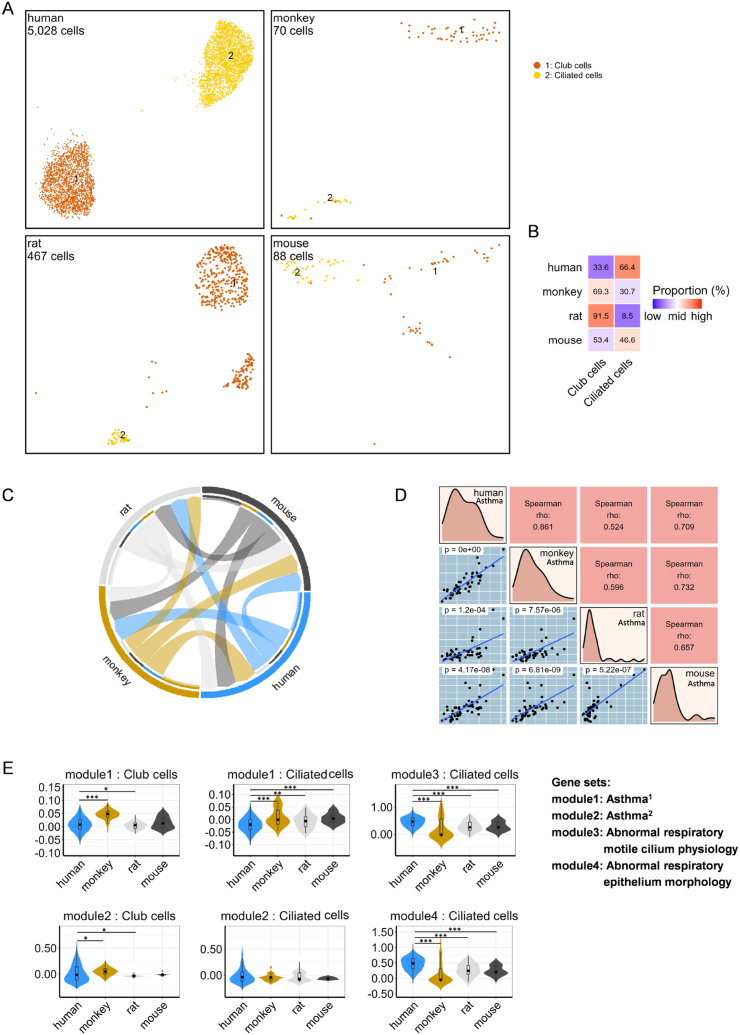
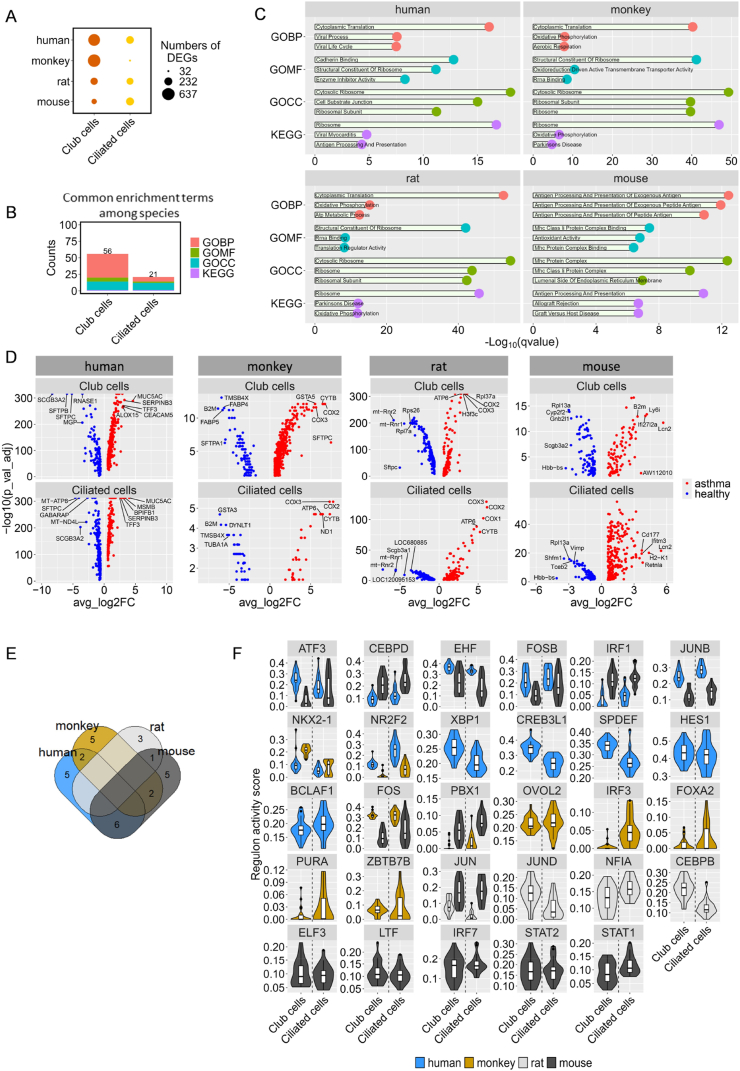
Studies of lung transcriptomics across species are essential for understanding the complex biology and disease mechanisms of this vital organ. Single-cell RNA sequencing (scRNA-seq) has emerged as a key tool for understanding cell dynamics across various species. However, comprehensive cross-species comparisons are limited. Therefore, the aims of this study was to investigate the transcriptomic similarities and differences in lung cells across four species-humans, monkeys, mice, and rats-in healthy and asthma conditions using scRNA-seq. The results revealed significant transcriptomic similarities between monkeys and humans and significant cross-species conservation of cell-specific marker genes, transcription factors (TFs), and biological pathways. Additionally, we explored sex differences, identifying distinct sex-specific expression patterns that may influence disease susceptibility. These insights refine our understanding of the mechanism underlying airway cell biology across species and have important implications for studying lung diseases, particularly the mechanisms of mucus clearance in asthma.

Keywords: Asthma; Cross-species comparison; Lung; scRNA-seq.


Conflict of interest statement

The authors declare that they have no known competing financial interests or personal relationships that could have appeared to influence the work reported in this paper.

Figures

Fig. 1
Fig. 1
Full-transcriptome landscape of healthy lung cells and cross-species comparisons. (A) UMAP plots show the distribution of 34 fine cell types in the lungs of healthy humans, monkeys, rats, and mice, respectively. Cell types are color-coded and numbered, with the total number of cells for each dataset showing in the top-left corner of each plot. (B) Proportions of four main cell clusters across different species. (C) Proportions of 29 fine cell types across different species. Numbers within the image represent cell ratios, and the proportions for each specific cell type are normalized across species, with color-filled based on the normalized values. (D) Chord plot illustrates the correlation of full-transcriptome expression levels and their percentage in randomly sampled lung cells across species. Arrow width represents the correlation coefficient from Mantel's test between species pairs connected by a chord. (E) Correlation analysis of randomly sampled lung cells cross-species utilizing module scores for 50 hallmark gene sets from the MsigDb dataset. Each black dot in the bottom-left part represents a gene set, with its coordinates representing the module scores for the corresponding two species labeled diagonally. Blue trend lines are derived from a linear model. The correlation coefficient for each dot plot is shown in the corresponding position in the top-right corner, with the chosen calculation method depending on the distribution of the data. Diagonal plots represent the density distribution of the four species.
Fig. 2
Fig. 2
Cross-species comparison of healthy lung cells at the cell type level. (A) Number of marker genes of various lung cell types across different species. (B) Number of common marker genes in various lung cell types across four species. (C) Mantel's correlation analysis compares the expression level and percentage of common marker genes in randomly sampled lung cells of the human dataset with the other three. (D) Mantel's correlation analysis for comparing the expression and percentage of common marker genes in lung cell types of the human dataset with those in the other three. (E) Number of common enrichment GO and KEGG terms for different lung cell types across four species. (F) Top five common enrichment GOBP terms ordered according to the P-values in various cell types across five species.
Fig. 3
Fig. 3
Common TFs in healthy lung cells across species. (A) Venn plot showing TFs across species. (B) Regulon activity for 24 common TFs across 18 common lung cell types of four species. The column is grouped into four main cell clusters, and TFs in rows are unsupervised clustered. Nine regulons from the three most active modules are highlighted with a dashed line. (C) Violin plots showing the activity distribution of each framed regulon in every cell type of various species. (D) Correlation analysis of the regulon activity of 24 common TFs in four main cell clusters (left) and 19 fine cell types (right) of lung cells. The analysis compares human data with those of other species; only p < 0.05 are shown.
Fig. 4
Fig. 4
Sex differences in healthy lung cells across species. (A) Proportions of 29 fine cell typesclassified by sex across different species. (BC) Correlation analysis of randomly sampled lung cells across species in various sex groups using module scores from 50 hallmark gene sets in the MsigDB dataset. (D) Sex-based DEGs across 29 fine celltypes. (E) Top five sex-based DEGs across species. The vertical axis of the volcano plot represents the number of occurrences across the 29 cell types, and the horizontal axis shows the accumulated LogFC in significant cell types. Label the top five genes on accumulated LogFC. (F) Top common enrichment terms for sex-based DEGs16 cell types across species.
Fig. 5
Fig. 5
Landscape of asthma lung cells and cross-species full-transcriptome comparison. (A) UMAP plots show two fine cell types in the lungs of humans, monkeys, rats, and mice, respectively. Each cell type is color-coded and numbered, with the total number of cells in each data set shown in the top-left corner. (B) Proportions of the two fine cell types in different species. (C) Chord plot showing the correlation of full-transcriptome expression level and percentage in randomly sampled lung cells across species. Arrow width denotes the correlation coefficient from Mantel's test between species connected by a chord. (D) Correlation analysis of randomly sampled lung cells across species based on module scores from 50 hallmark gene sets from the MsigDB dataset. (E) Comparative graph of asthma and ciliated cells gene sets scores across species, all nonhuman species were compared with human, highlighting variations in the expression of genes related to asthma-specific biological processes (∗p < 0.05, ∗∗p < 0.01, ∗∗∗p < 0.001).
Fig. 6
Fig. 6
Cross-species comparison of DEGs. (A) Number of DEGs across various lung cell types in different species. (B) Number of common enrichment GO and KEGG terms in different lung cell types across four species. (C) Top three enrichment terms for common DEGs across species. These common genes were filtered from sex-basedDEGs, appearing in at least one of 16 cell types in every species. (D) DEGs in two common cell types across four species. (E) Venn plot showing TFs across species. (F) Violin plots showing the distribution of regulon activity in each cell type across different species.

References

    1. Franks T.J., Colby T.V., Travis W.D., et al. Resident cellular components of the human lung: current knowledge and goals for research on cell phenotyping and function. Proc. Am. Thorac. Soc. 2008;5(7):763–766. doi: 10.1513/pats.200803-025HR. - DOI - PubMed
    1. Sikkema L., Ramírez-Suástegui C., Strobl D.C., et al. An integrated cell atlas of the lung in health and disease. Nat. Med. 2023;29(6):1563–1577. doi: 10.1038/s41591-023-02327-2. - DOI - PMC - PubMed
    1. Pennitz P., Kirsten H., Friedrich V.D., et al. A pulmonologist's guide to perform and analyse cross-species single lung cell transcriptomics. Eur. Respir. Rev. : an Official Journal of the European Respiratory Society. 2022;31(165) doi: 10.1183/16000617.0056-2022. - DOI - PMC - PubMed
    1. Chen D., Sun J., Zhu J., et al. Single cell atlas for 11 non-model mammals, reptiles and birds. Nat. Commun. 2021;12(1):7083. doi: 10.1038/s41467-021-27162-2. - DOI - PMC - PubMed
    1. Travaglini K.J., Nabhan A.N., Penland L., et al. A molecular cell atlas of the human lung from single-cell RNA sequencing. Nature. 2020;587(7835):619–625. doi: 10.1038/s41586-020-2922-4. - DOI - PMC - PubMed

LinkOut - more resources