. 2024 Sep 26:15:1470115.
doi: 10.3389/fmicb.2024.1470115. eCollection 2024.

Early warning of Aspergillus contamination in maize by gas chromatography-ion mobility spectrometry

Affiliations

Early warning of Aspergillus contamination in maize by gas chromatography-ion mobility spectrometry

Yucan Qin et al. Front Microbiol. .

Abstract

Introduction: As one of the main grain crops in China, maize is highly susceptible to Aspergillus infection during processing, storage and transportation due to high moisture at harvest, which results in the loss of quality. The aim of this study is to explore the early warning marker molecules when Aspergillus infects maize kernels.

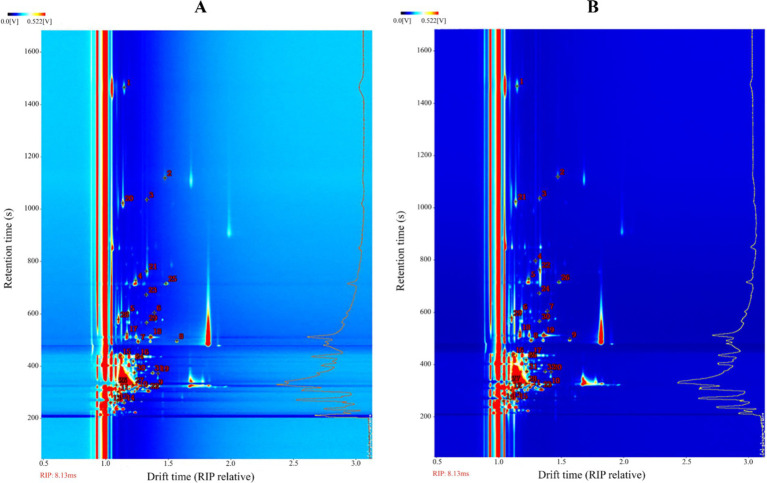
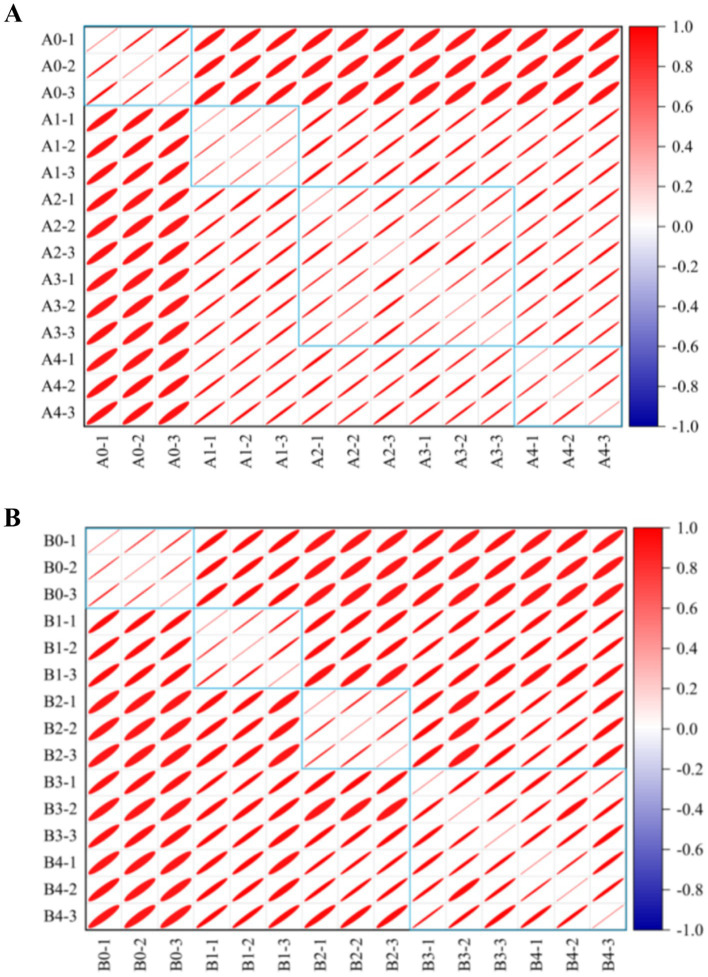
Methods: Firstly, strains MA and MB were isolated from moldy maize and identified by morphological characterization and 18S rRNA gene sequence analysis to be Aspergillus flavus (A. flavus) and Aspergillus niger (A. niger). Next, fresh maize was moldy by contaminated with strains MA and MB. The volatile organic compounds (VOCs) during the contamination process of two fungal strains were analyzed by gas chromatography-ion mobility spectrometry (GC-IMS). A total of 31 VOCs were detected in maize contaminated with strain MA, a total of 32 VOCs were detected in maize contaminated with strain MB, including confirmed monomers and dimers. Finally, heat maps and principal component analysis (PCA) showed that VOCs produced in different growth stages of Aspergillus had great differences. Combined with the results of GC-IMS, total fungal colony counts and fungal spores, it was concluded that the Aspergillus-contaminated maize was in the early stage of mold at 18 h.

Results: Therefore, the characteristic VOCs butan-2-one, ethyl acetate-D, Benzaldehyde, and pentan-2-one produced by maize at 18 h of storage can be used as early mildew biomarkers of Aspergillus infection in maize.

Discussion: This study provided effective marker molecules for the development of an early warning and monitoring system for the degree of maize mildew in granaries.

Keywords: Aspergillus flavus; Aspergillus niger; gas chromatography-ion mobility spectrometry (GC-IMS); maize; principal component analysis (PCA); volatile organic compounds (VOCs).


Conflict of interest statement

The authors declare that the research was conducted in the absence of any commercial or financial relationships that could be construed as a potential conflict of interest.

Figures

Figure 1
Figure 1
Morphological characteristics of strain MA and strain MB on PDA medium and under biological microscope. (A) Strain MA: (a) front side; (b) back side; (c) microscopic examination. (B) Strain MB: (a) front side; (b) back side; (c) microscopic examination.
Figure 2
Figure 2
Phylogenetic tree of strain MA and strain MB and close reference strains based on 18S rRNA genes. (A) Phylogenetic tree of Aspergillus flavus. (B) Phylogenetic tree of Aspergillus niger.
Figure 3
Figure 3
Total fungal colony counts in maize contaminated by dominant fungal strains MA and MB. The relative standard deviation of total fungi counts is represented with bars (n = 3).
Figure 4
Figure 4
Fungal spores in maize contaminated by dominant fungal strains MA and MB. Different lowercase letters indicate significant differences (p < 0.05).
Figure 5
Figure 5
Maize samples and GC-IMS topography of maize samples at different storage periods. (A) Samples of maize at different mold growth stages (tested every 18 h): (a) A. flavus-contaminated maize samples; (b) A. niger-contaminated maize samples. (B) Top view of GC-IMS for VOCs in maize at different times (direct comparison): (a) A. flavus-contaminated maize samples; (b) A. niger-contaminated maize samples. (C) GC-IMS for VOCs of maize at different times (comparison of differences): (a) A. flavus-contaminated maize samples; (b) A. niger-contaminated maize samples. A0, B0: maize samples infected with A. flavus and A. niger for 0 h; A1, B1: maize samples infected with A. flavus and A. niger for 18 h; A2, B2: maize samples infected with A. flavus and A. niger for 36 h; A3, B3: maize samples infected with A. flavus and A. niger for 54 h; A4, B4: maize samples infected with A. flavus and A. niger for 72 h.
Figure 6
Figure 6
Ion mobility spectra of moldy maize. (A) A. flavus-contaminated maize samples. (B) A. niger-contaminated maize samples. The numbers indicate the identified VOCs.
Figure 7
Figure 7
Comparison of the fingerprints of VOCs in uninoculated and inoculated Aspergillus samples determined by GC-IMS. (A) A. flavus-contaminated maize samples. (B) A. niger-contaminated maize samples.
Figure 8
Figure 8
Heat map and cluster analysis of maize samples with different degrees of infection. (A) A. flavus-contaminated maize samples. (B) A. niger-contaminated maize samples.
Figure 9
Figure 9
PCA analysis based on signal strength of maize samples. (A) Plot of the top two principal component scores: (a) A. flavus-contaminated maize samples; (b) A. niger-contaminated maize samples. (B) Plot of principal component loadings: (a) A. flavus-contaminated maize samples; (b) A. niger-contaminated maize samples.
Figure 10
Figure 10
Similarity analysis of different groups in maize samples. (A) A. flavus-contaminated maize samples. (B) A. niger-contaminated maize samples. The colors in the similarity analysis between VOCs represent the degree of similarity from no correlation (dark blue) to high correlation (dark red). The area of the ellipse from small to large represents the correlation between VOCs from strong to weak.

Similar articles

Cited by

References

    1. Arroyo-Manzanares N., Martín-Gómez A., Jurado-Campos N., Garrido-Delgado R., Arce C., Arce L. (2018). Target vs spectral fingerprint data analysis of Iberian ham samples for avoiding labelling fraud using headspace—gas chromatography-ion mobility spectrometry. Food Chem. 246, 65–73. doi: 10.1016/j.foodchem.2017.11.008, PMID: - DOI - PubMed
    1. Bocate K. P., Evangelista A. G., Luciano F. B. (2021). Garlic essential oil as an antifungal and anti-mycotoxin agent in stored corn. LWT 147:111600. doi: 10.1016/j.lwt.2021.111600 - DOI
    1. Brito V. D., Achimón F., Zunino M. P., Zygadlo J. A., Pizzolitto R. P. (2022). Fungal diversity and mycotoxins detected in maize stored in silo-bags: a review. J. Sci. Food Agric. 102, 2640–2650. doi: 10.1002/jsfa.11756, PMID: - DOI - PubMed
    1. Caligiore-Gei P. F., Moratalla-López N., Poggi L. M., Alonso G. L. (2023). Isolation, identification, and determination of the virulence of the causal agents of corm rot of saffron (Crocus sativus L.) in Valle de Uco, Argentina. Plants 12:2717. doi: 10.3390/plants12142717, PMID: - DOI - PMC - PubMed
    1. Cavanna D., Zanardi S., Dall’Asta C., Suman M. (2019). Ion mobility spectrometry coupled to gas chromatography: a rapid tool to assess eggs freshness. Food Chem. 271, 691–696. doi: 10.1016/j.foodchem.2018.07.204, PMID: - DOI - PubMed

LinkOut - more resources