. 2024 Sep 14;27(10):110937.
doi: 10.1016/j.isci.2024.110937. eCollection 2024 Oct 18.

C9orf72 poly-PR forms anisotropic condensates causative of nuclear TDP-43 pathology

Affiliations

C9orf72 poly-PR forms anisotropic condensates causative of nuclear TDP-43 pathology

Rachel E Hodgson et al. iScience. .

Abstract

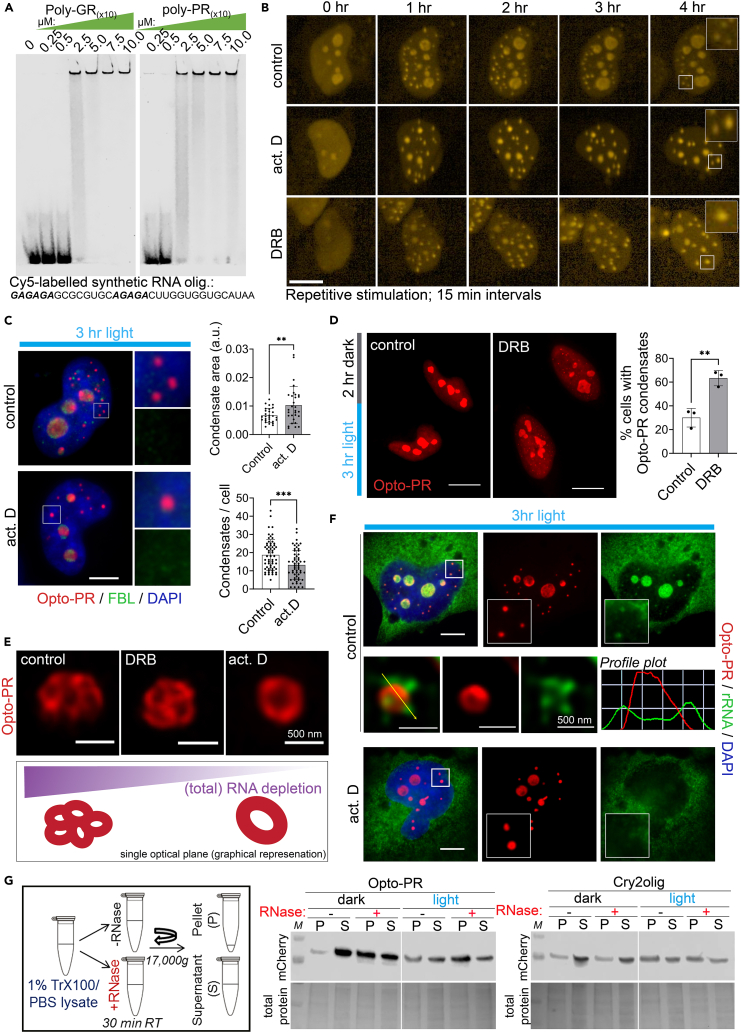
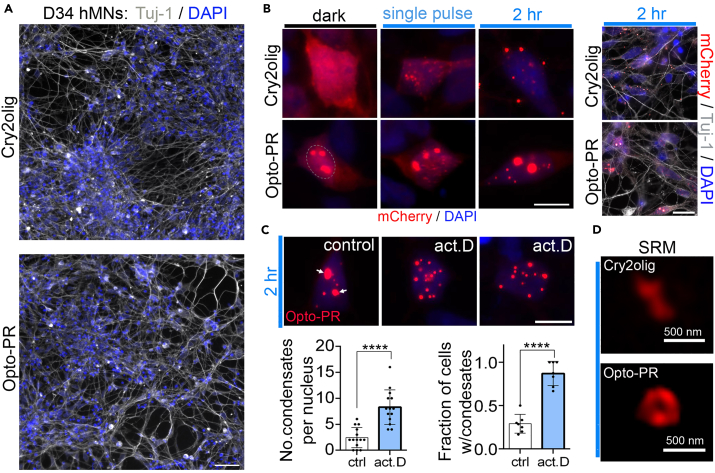
Proteinaceous inclusions formed by C9orf72-derived dipeptide-repeat (DPR) proteins are a histopathological hallmark in ∼50% of familial amyotrophic lateral sclerosis/frontotemporal dementia (ALS/FTD) cases. However, DPR aggregation/inclusion formation could not be efficiently recapitulated in cell models for four out of five DPRs. In this study, using optogenetics, we achieved chemical-free poly-PR condensation/aggregation in cultured cells including human motor neurons, with spatial and temporal control. Strikingly, nuclear poly-PR condensates had anisotropic, hollow-center appearance, resembling TDP-43 anisosomes, and their growth was limited by RNA. These condensates induced abnormal TDP-43 granulation in the nucleus without stress response activation. Cytoplasmic poly-PR aggregates forming under prolonged opto-stimulation were more persistent than its nuclear condensates, selectively sequestered TDP-43 in a demixed state and surrounded spontaneous stress granules. Thus, poly-PR condensation accompanied by nuclear TDP-43 dysfunction may constitute an early pathological event in C9-ALS/FTD. Anisosome-type condensates of disease-linked proteins may represent a common molecular species in neurodegenerative disease.

Keywords: Biochemistry; Cell biology; Molecular biology.


Conflict of interest statement

Authors declare no competing interests.

Figures

None
Graphical abstract
Figure 1
Figure 1
An optogenetic cellular system for controllable C9orf72 DPR condensation (A) Opto-DPR approach. (B) Opto-DPR condensation can be induced by a single-pulse blue light stimulation. HeLa cells expressing the respective opto-DPR(x36) or empty Cry2olig-mCherry vector were analyzed 24 h post-transfection. Blue-light array (single-pulse) was used. Scale bar, 10 μm. (C) Continuous opto-stimulation induces larger opto-PR condensates as compared to single light pulse. HeLa cells expressing opto-PR or empty vector were subjected to either a single-pulse or a 3-h continuous blue-light stimulation. 30 cells per condition were analyzed from a representative experiment. Error bars represent S.D. ∗∗p < 0.01, ∗∗∗∗p < 0.0001, Kruskal-Wallis test with Dunn’s post-hoc test. Scale bar, 10 μm. (D) Super-resolution microscopy (SRM) demonstrates structural differences between Cry2olig-only and opto-PR assemblies and between the condensates formed after single-pulse and continuous (3-h long) blue-light stimulation. Representative images and graphical representation are shown. (E) Opto-PR condensates can be detected using a PR-repeat specific antibody. Representative image (confocal single optical section) is shown. (F) Opto-PR condensate induction and tracking using confocal longitudinal imaging. Opto-PR expressing cells were stimulated with a 488 nm laser (at 80% for 500 ms), coupled with mCherry imaging. Cells were stimulated/imaged either every 2 min (“short-interval”) or every 15 min for up to 4 h (“long-interval”). Alternatively, cells with preformed condensates were imaged every 2 min without stimulation (“dissolution”). Representative images are shown. Scale bar, 10 μm. (G) Opto-PR condensate nucleation is concentration-dependent. mCherry fluorescence intensity was measured in the nucleoplasm of individual cells, outside the nucleolus, and the number of condensates was quantified in the same cells at the peak of their assembly (7-min interval repetitive stimulation for 49 min). 75 cells were analyzed. Also see Figure S1C. (H) FRAP analysis after full opto-PR condensate photobleaching reveals low protein mobility between the condensate and nucleoplasm. Representative image and FRAP curve for 25 cells from a representative experiment are shown. Error bars represent SEM. Scale bar, 10 μm. (I) Nuclear opto-PR condensates can become persistent. Opto-PR condensate were induced by 3-h continuous stimulation on blue-light array and the proportion of condensate-positive cells was quantified immediately post-stimulation or after 3 h of recovery in the dark. N = 3 (300 cells analyzed in total). Error bars represent S.D. (J) Opto-PR condensates are positive for nucleophosmin (NPM1). Opto-PR condensates induced by a 3-h continuous opto-stimulation were analyzed by SRM. Representative images and profile plots are shown. Scale bar, 2 μm.
Figure 2
Figure 2
RNA limits opto-PR condensation in the nucleus (A) Electrophoretic mobility shift assay (EMSA) with a natural GA-rich RNA sequence reveals R-DPR binding to RNA. Cy5-labeled synthetic nucleotide “Clip34nt” (34-mer) and synthetic poly-PR and poly-GR peptides (10 repeats) were used. Representative gel is shown. (B) RNA depletion promotes opto-PR condensate growth. Opto-PR expressing cells were pre-treated with actinomycin D or DRB for 1 h, followed by long-interval repetitive blue-light stimulation (every 15 min) coupled with time-lapse imaging for up to 4 h (in the presence of the inhibitor). Representative images are shown. Scale bar, 10 μm. (C) Opto-PR condensates formed under conditions of actinomycin D-induced RNA depletion are larger in size and less numerous than in RNA-sufficient cells. Cells were opto-stimulated for 3 h continuously. Representative images and quantification are shown. Note that the larger condensates remain FBL-negative. 30 and 60 cells (5–7 fields) per condition were included in analysis for condensate size and number, respectively, from a representative experiment. Error bars represent S.D. ∗∗p < 0.01, ∗∗∗p < 0.001, Student’s t test. Scale bar, 5 μm. (D) Opto-PR condensates formed in RNA-depleted conditions are more persistent. Opto-PR expressing cells were light-stimulated for 3 h continuously, with or without DRB addition, followed by DRB removal and recovery for 2 h in the dark. Representative images and quantification are shown. N = 3 (50 cells from 5 to 7 fields of view analyzed per biological repeat). Error bars represent S.D. ∗∗p < 0.01, unpaired t test. Scale bar, 10 μm. (E) Opto-PR condensates formed in actinomycin D-treated cells are structurally different, as revealed by SRM. Representative images of condensates of a comparable size from control, DRB- or actinomycin D-treated cells induced by 3-h continuous opto-stimulation are shown, alongside with graphical representation. (F) Ribosomal (r)RNA depletion from the nucleus and opto-PR condensates in actinomycin D treated cells. Representative images are shown. Scale bar, 5 μm. (G) RNA degradation in the lysate promotes opto-PR insolubility. Lysates of opto-stimulated and control cells were subjected to RNase A digest for 30 min, with subsequent fractionation by centrifugation. S, supernatant; P, pellet.
Figure 3
Figure 3
Nuclear opto-PR condensation induces TDP-43 pathology (A) Opto-PR self-assembly induces nuclear condensation of co-expressed TDP-43 GFP. Cells were opto-stimulated for 3 h continuously. Representative images and quantification are shown. Scale bar, 10 μm. N = 3 (≥100 cells from 5 to 7 fields of view analyzed per biological repeat). Error bars represent S.D. ∗∗p < 0.01, ∗∗∗p < 0.001, ∗∗∗∗p < 0.0001, mixed-effects model analysis with Tukey’s multiple comparisons test. (B) Spatial proximity of opto-PR and TDP-43 GFP nuclear condensates as revealed by SRM. Representative image is shown. (C) Reduced TDP-43 GFP solubility upon induction of opto-PR condensation. Cells co-expressing opto-PR and TDP-43 GFP were subjected to 3-h continuous blue-light stimulation before lysis and fractionation by centrifugation. Western blots and quantification of the relative TDP-43 GFP amount in the supernatant fraction are shown for a representative experiment. S, supernatant; P, pellet. (D) TDP-43 condensates induced by opto-PR self-assembly are devoid of polyA + RNA. Cells after 3-h continuous opto-stimulation were analyzed by poly(dT) RNA-FISH. Representative image is shown. Scale bar, 5 μm. (E) Opto-PR self-assembly promotes nuclear condensation of a TDP-43 acetylation mimic mutant (K145Q). Representative images and quantification are shown. 50 cells (5–7 fields of view) were analyzed from a representative experiment. Error bars represent S.D. ∗∗p < 0.01, Mann-Whitney U test. Scale bar, 5 μm. (F–H) R-DPRs promote TDP-43 clustering in vitro. Recombinant TDP-43 (supernatant fraction depleted of large aggregates; 1 μM) was incubated with equimolar amounts of poly-PR(x10) or poly-GR(x10) peptides or control peptide (V5) and analyzed by immunostaining and fractionation/western blot. Methodology (F), immunostaining/imaging (G) and fractionation/western blotting (H) data are shown. In (G), 10 min incubation was used and 4 fields of view from a representative experiment were analyzed; ∗∗p < 0.01, one-way ANOVA with Dunnett’s post-hoc test. Error bars represent S.D. Bottom left image is a control without any peptide added. In (H), representative western blot and band intensity quantification for the supernatant are shown. S, supernatant; P, pellet. Scale bar, 10 μm.
Figure 4
Figure 4
Prolonged opto-stimulation elicits cytoplasmic opto-PR/TDP-43 pathology (A and B) Prolonged, 24-h blue-light stimulation leads to cytoplasmic opto-PR redistribution and aggregation, with persistent assembly formation. Proportion of cells with opto-PR assemblies (nuclear and cytoplasmic) was quantified after 24-h blue-light array stimulation with and without 8-h recovery in the dark. Representative images (A) and quantification (B) are shown. Images for a 3-h stimulation and recovery are included for comparison. N = 3 (300 cells analyzed per condition). Error bars represent S.D. ns, non-significant. Scale bar, 10 μm. (C) Cytoplasmic opto-DPR foci surround spontaneous stress granules (SGs, visualized using G3BP1 as a marker). Representative image is shown. Cells were opto-stimulated for 24 h continuously. Scale bar, 5 μm. (D) Endogenous TDP-43 but, no other RBPs, joins opto-PR assemblies induced by prolonged opto-stimulation. Also note normal nuclear localization of all RBPs in cells with cytoplasmic opto-PR. Cells were opto-stimulated for 24 h continuously. Representative images are shown. Scale bars, 10 μm. (E) Cry2olig-only cytoplasmic assemblies are negative for TDP-43. Cells were opto-stimulated for 24 h continuously. Representative images are shown. Scale bars, 10 μm. (F) TDP-43 remains demixed within opto-PR within cytoplasmic assemblies, as revealed by SRM. Cells were opto-stimulated for 24 h continuously. Representative image is shown. (G) Cytoplasmic opto-PR assemblies are occasionally positive for p62. Representative image is shown. Insets 1 and 2 shows examples of p62-positive and -negative assemblies, respectively. Scale bars, 10 μm. (H) SG dissolution is affected in cells with cytoplasmically localized opto-PR. SGs Representative were induced NaAsO2 in cells expressing either opto-PR or Cry2olig-only, subjected to 24-h long opto-stimulation or kept in the dark. Efficiency of SG dissolution was analyzed 3 h into the recovery (post-NaAsO2 removal). Representative images and quantification are shown. N = 3 (120 cells analyzed per condition). Error bars represent S.D. ∗p < 0.05, two-way ANOVA with Sidak’s multiple comparisons test. Scale bars, 10 μm.
Figure 5
Figure 5
Opto-PR condensation in human motor neurons (hMNs) (A) Day 34 hMN cultures transduced with Cry2olig or opto-PR. Neuronal cultures stained for Tuj-1 imaged 48 h post-transduction demonstrate similar cell density. Scale bar, 50 μm. (B) Distribution and light-induced condensation of lentivirus-delivered Cry2olig and opto-PR expression constructs in hMNs. Note significant accumulation of opto-PR in the cytoplasm in the steady-state. 48 h post-transduction, neurons were either subjected to single pulse of blue-light and fixed after 4 min, or stimulated with blue-light for 2 h. General plane images of stimulated cultures co-stained for Tuj-1 are also shown (right). Dashed line indicates the nucleus. Scale bar, 5 μm (left) and 15 μm (right). (C) RNA depletion promotes opto-PR condensation in hMNs. Neurons were pre-treated with actinomycin D for 2, before a 2-h long blue-light stimulation. Number of condensates/nucleus was quantified for 15 neurons per condition. Arrows indicate nucleoli in untreated cells (note that due to nucleoli shrinking, they are indistinguishable by size from large opto-PR condensates). Fraction of cells was quantified from 7 fields of view (42 and 34 cells for control and actinomycin (D), respectively). Error bars represent S.D. ∗∗∗∗p < 0.0001, two-way t test. Scale bar, 5 μm. (D) Opto-PR condensate morphology in hMNs, as revealed by SRM analysis. Neurons were subjected to blue-light stimulation for 2 h. Representative images are shown.

References

    1. DeJesus-Hernandez M., Mackenzie I.R., Boeve B.F., Boxer A.L., Baker M., Rutherford N.J., Nicholson A.M., Finch N.A., Flynn H., Adamson J., et al. Expanded GGGGCC hexanucleotide repeat in noncoding region of C9ORF72 causes chromosome 9p-linked FTD and ALS. Neuron. 2011;72:245–256. - PMC - PubMed
    1. Renton A.E., Majounie E., Waite A., Simón-Sánchez J., Rollinson S., Gibbs J.R., Schymick J.C., Laaksovirta H., van Swieten J.C., Myllykangas L., et al. A hexanucleotide repeat expansion in C9ORF72 is the cause of chromosome 9p21-linked ALS-FTD. Neuron. 2011;72:257–268. - PMC - PubMed
    1. Van Mossevelde S., van der Zee J., Cruts M., Van Broeckhoven C. Relationship between C9orf72 repeat size and clinical phenotype. Curr. Opin. Genet. Dev. 2017;44:117–124. - PubMed
    1. Ash P.E.A., Bieniek K.F., Gendron T.F., Caulfield T., Lin W.L., Dejesus-Hernandez M., van Blitterswijk M.M., Jansen-West K., Paul J.W., 3rd, Rademakers R., et al. Unconventional translation of C9ORF72 GGGGCC expansion generates insoluble polypeptides specific to c9FTD/ALS. Neuron. 2013;77:639–646. - PMC - PubMed
    1. Mori K., Weng S.M., Arzberger T., May S., Rentzsch K., Kremmer E., Schmid B., Kretzschmar H.A., Cruts M., Van Broeckhoven C., et al. The C9orf72 GGGGCC repeat is translated into aggregating dipeptide-repeat proteins in FTLD/ALS. Science. 2013;339:1335–1338. - PubMed