. 2024 Sep 17;27(10):110985.
doi: 10.1016/j.isci.2024.110985. eCollection 2024 Oct 18.

Optimized intravital three-photon imaging of intact mouse tibia links plasma cell motility to functional states

Affiliations

Optimized intravital three-photon imaging of intact mouse tibia links plasma cell motility to functional states

Asylkhan Rakhymzhan et al. iScience. .

Abstract

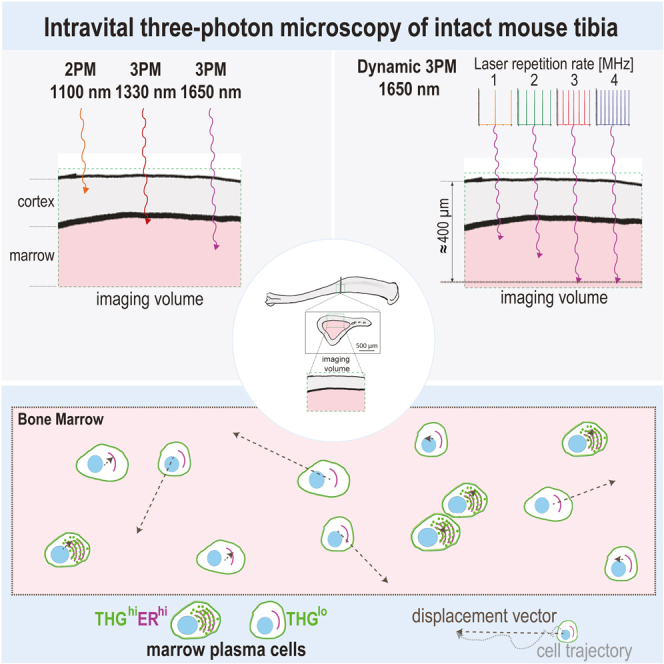
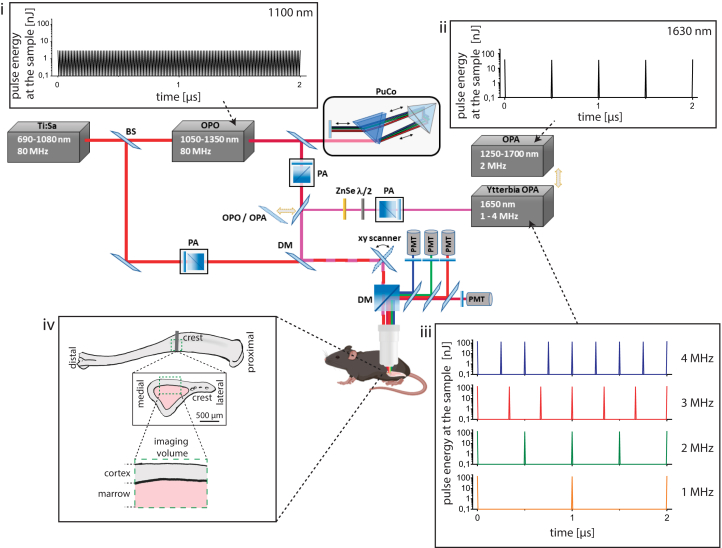
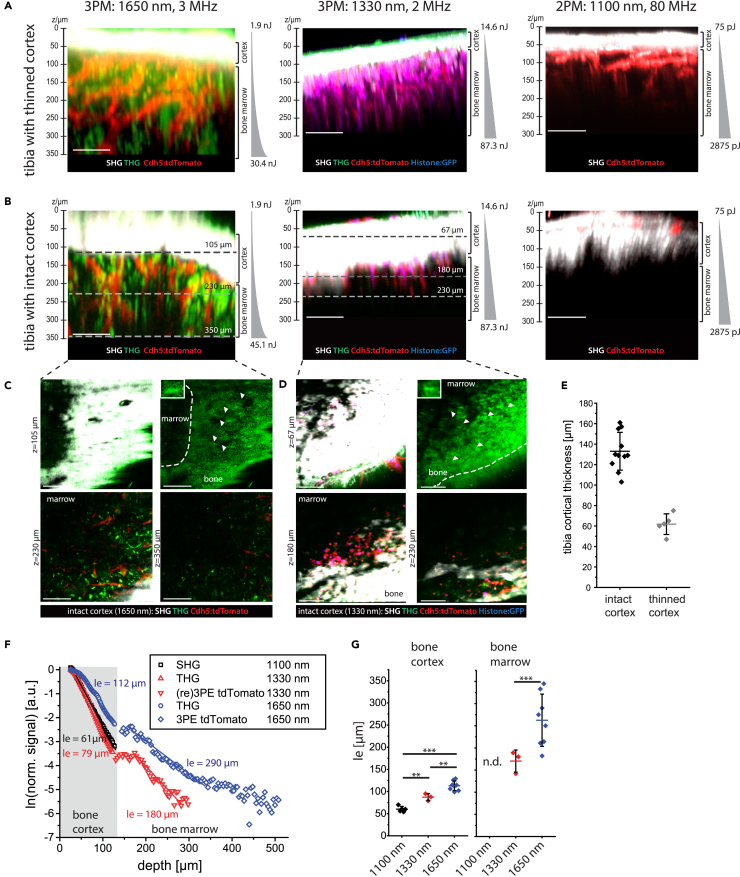
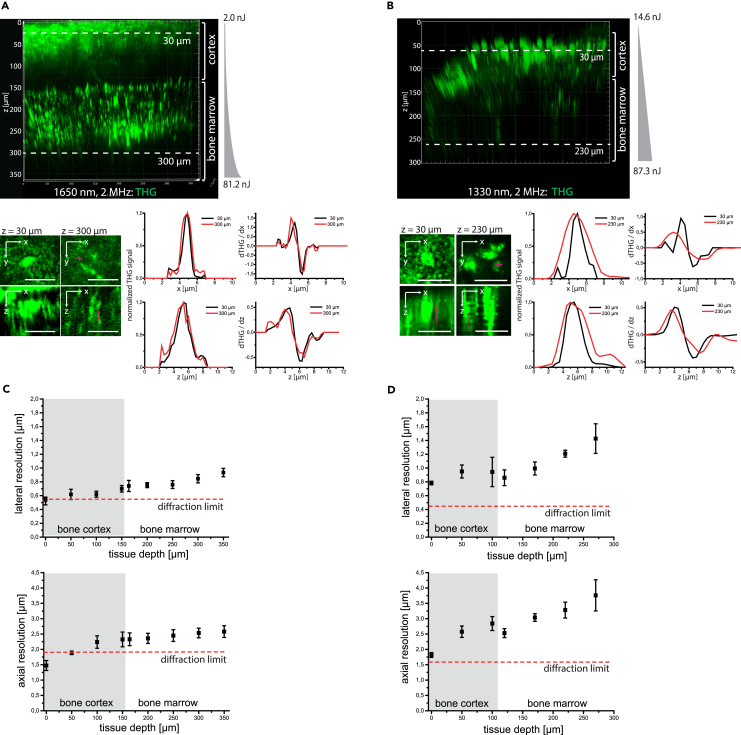
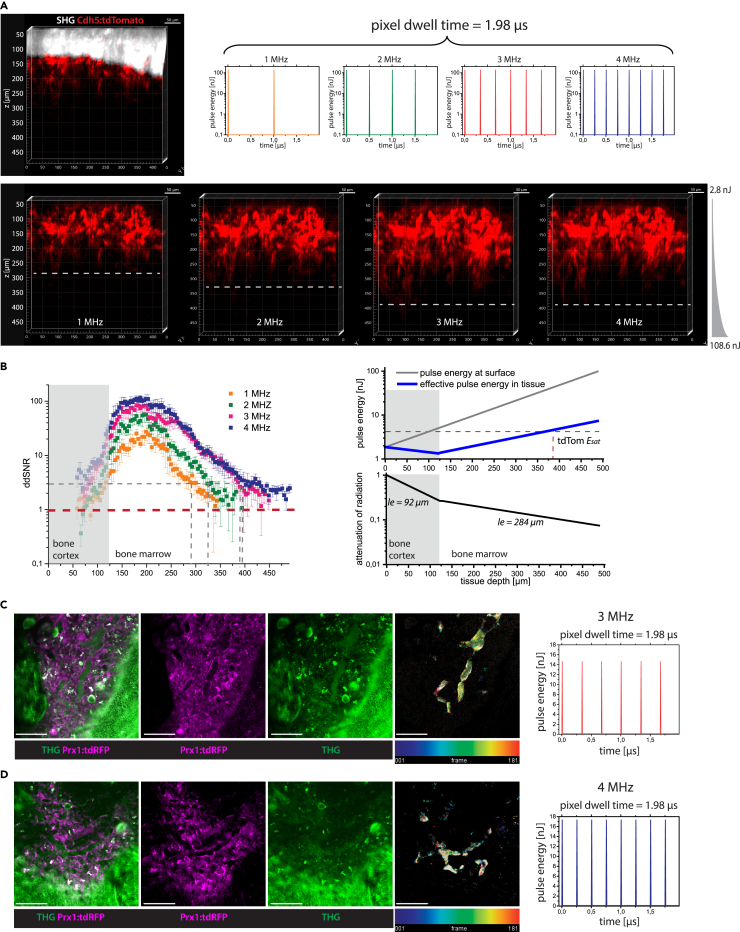
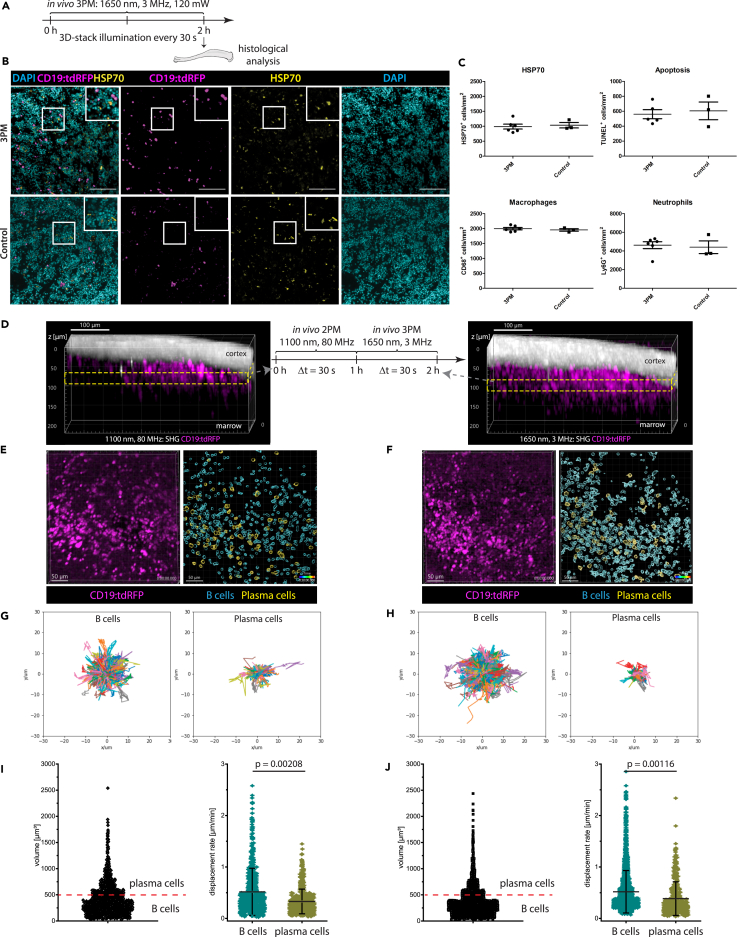
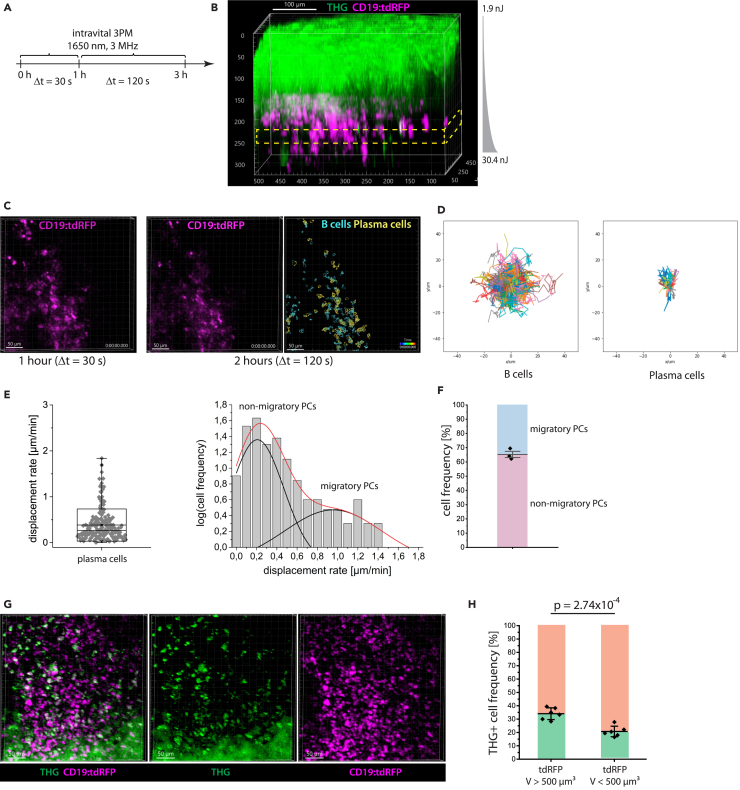
Intravital deep bone marrow imaging is crucial to studying cellular dynamics and functions but remains challenging, and minimally invasive methods are needed. We employed a high pulse-energy 1650 nm laser to perform three-photon microscopy in vivo, reaching ≈400 μm depth in intact mouse tibia. Repetition rates of 3 and 4 MHz allowed us to analyze motility patterns of fast and rare cells within unperturbed marrow and to identify a bi-modal migratory behavior for plasma cells. Third harmonic generation (THG) was identified as a label-free marker for cellular organelles, particularly endoplasmic reticulum, indicating protein synthesis capacity. We found a strong THG signal, suggesting high antibody secretion, in one-third of plasma cells while the rest showed low signals. We discovered an inverse relationship between migratory behavior and THG signal, linking motility to functional plasma cell states. This method may enhance our understanding of marrow microenvironment effects on cellular functions.

Keywords: Cell biology; Optical imaging; Small animal imaging.


Conflict of interest statement

S. Domingue and L. Wooldridge are with Thorlabs LASER Division CO, US. J. Heidelin and V. Andresen are with Miltenyi Biotec GmbH, Bergisch Gladbach, Germany.

Figures

None
Graphical abstract
Figure 1
Figure 1
Customized setup design for dynamic deep-tissue imaging within intact long bones in vivo The schematics depict the main components of the customized multi-photon microscope. State-of-the-art two-photon imaging is performed using low pulse energy (<2 nJ) lasers, at 80 MHz, i.e., Ti:Sa and optical parametric oscillator (OPO, (i). The Ti:Sa beam is separated by a beam splitter (BS) into two optical pathways, one being used to pump the OPO, and the other being coupled into the microscope. Thus, the microscope covers a broad excitation range, i.e., 690–1080 nm (Ti:Sa) and 1050–1350 nm (OPO). Two types of optical parametric amplifiers (OPA), delivering high pulse energy radiation, are used as three-photon excitation sources. The Ytterbia OPA, a new OPA prototype, emits at a fixed wavelength (1650 nm, bandwidth 60 nm) and variable repetition rate between 1 and 4 MHz and delivers up to 130 nJ pulse energy at the sample (iii). The state-of-the-art OPA is tunable between 1250 and 1700 nm, at 2 MHz, and delivers up to 40 nJ pulse energy at the sample (ii). Power control of laser pulses was performed using power attenuation (PA) units consisting of a half-wave plate and a polarizing cube beam splitter. Due to the slightly positive group-velocity dispersion of our microscope, we built in a single-prism pulse compressor (PuCo) in the OPO beam path and a ZnSe window in the Ytterbia OPA beam path. A flip mirror (FM) is used to accurately switch between OPA and OPO irradiation regimes. The Ti:Sa and OPO beam paths are overlapped before being coupled into the microscope, using a dichroic mirror (DM). For imaging, laser beams are scanned over the sample using an x/y galvanometric scanner. Fluorescence, higher-harmonics generation signals, and excitation beams are separated using dichroic mirrors (DM), high-pass filters, and band-pass interference filters. Up to four photomultiplier tubes (PMT) are used for signal detection. The pulse trains of OPO and the two OPA systems are shown in (i–iii). Box (iv) shows that imaging was performed in the medial region (crest) of the mouse tibia. Imaging requires the laser beam to surpass first the bone cortex and then the bone marrow, i.e., a soft lymphoid tissue, tissue compartments having distinct absorption and scattering properties.
Figure 2
Figure 2
Minimizing attenuation of radiation by wavelength and pulse energy optimization for in vivo deep-marrow imaging in the intact mouse tibia, through >100 μm thick cortical bone (A) Axial xz 3D image projections acquired by three- (3p.m.) or two-photon microscopy (2p.m.) in tibia bones of Cdh5:tdTomato/Histone:GFP (Cdh5:tdTom) mice, through mechanically thinned bone cortex, <100 μm thick. tdTomato and GFP in endothelial cells (vasculature) are shown in red and blue. Second harmonics generation (SHG) and third harmonics generation (THG) are shown in white and green. 3p.m. was performed either at 1650 nm, 3 MHz using the Ytterbia OPA (left) or at 1330 nm, 2 MHz using the tunable OPA (middle). 2p.m. was performed at 1100 nm, 80 MHz using the OPO (right). All excitation schemes enable bone marrow imaging, with imaging depths >350 μm at 1650 nm, ≈300 μm at 1330 nm, and ≈200 μm at 1100 nm. (B) Axial xz 3D image projections acquired by 3p.m. or 2p.m. in intact tibia bones of the same mouse strain, through >100 μm bone tissue. 3p.m. and 2p.m. was performed as indicated in (A), showing that bone marrow imaging through thick bone is possible only by 3p.m. Imaging depths >350 μm are achieved at 1650 nm, but only ≈230 μm (endosteal areas) at 1330 nm. 2 p.m. at 1100 nm, 80 MHz enable only signal detection in the bone cortex, not in the marrow. (A and B) Indicated pulse energy and z-adaptation of power were chosen to prevent tissue damage. (C) xy projections corresponding to the tissue layers indicated by dashed lines in (B), left panel (3p.m., 1650 nm). SHG and THG signals in the bone cortex (105 μm depth) are shown in the upper panels. Arrowheads indicate THG signal in single lacunae (right), with an enlarged lacuna of an osteocyte within the tibia cortex as inset. Blood vessels (tdTomato) and THG are shown in endosteal areas (230 μm depth) and in deep marrow (350 μm depth). (D) xy projections corresponding to the tissue layers indicated by dashed lines in (B), middle panel (3p.m., 1330 nm). Similar signals as in (C) are detected in the bone cortex (67 μm depth) and in endosteal areas (180 μm, 230 μm depth), but not in deep marrow. (A–D) Scale bar = 100 μm. (E) Thickness of tibia cortex in the analyzed mice, either with mechanically thinned (N = 5 mice) or with intact cortex (N = 11 mice), determined relying on THG at 1330 nm and 1650 nm, and on SHG at 1100 nm. Mean values with s.d. are displayed. (F) Effective attenuation length le dependence on imaging depth z in the intact mouse tibia (>100 μm thick cortex). (G) le distribution in bone tissue and marrow (N = 5 mice at 1100 nm; N = 3 mice at 1330 nm; N = 8 mice at 1650 nm, mean values with s.d. are displayed). n.d. – not detected. Statistical analysis was performed using two-way ANOVA with Bonferroni post-test or t-test, significance: ∗p > 0.05, ∗∗p > 0.01, ∗∗∗p > 0.001.
Figure 3
Figure 3
Three-photon imaging at 1650 nm enables sub-cellular resolution throughout the cortical bone and bone marrow in the intact tibia (A) 3D reconstruction (442 × 442 × 362 μm³, 1036 × 1036 × 362 voxel) of THG in the intact tibia, at 1650 nm, 2 MHz (upper panel). Representative xy and xz projections of THG in 30 μm depth in bone cortex and in 300 μm depth in bone marrow (bottom image array), tissue layers indicated in the upper panel. Scale bar = 30 μm. Representative intensity profiles of THG signal (left, corresponding to the magenta lines in the xy and xz projections) and their first derivatives (right), measured in 30 μm (black profiles) and 300 μm tissue depth (red profiles). (B) 3D reconstruction (442 × 442 × 300 μm³, 517 × 517 × 150 voxel) of THG in the intact tibia, at 1330 nm, 2 MHz (upper panel). Representative xy and xz projections of THG in 30 μm depth in the bone cortex, and in 230 μm depth in the endosteal area, as indicated in the upper panel. Scale bar = 30 μm. Similar to a THG intensity profiles (left, corresponding to the magenta lines in the xy and xz projections) and their first derivatives (right) are shown in 30 μm (black profiles) and 230 μm depth (red profiles). (A and B) Pulse energy and z-adaptation of power are indicated. (C) Depth dependence of lateral and axial resolution determined in the intact tibia upon excitation at 1650 nm, based on Gaussian approximation of THG intensity profiles and their first derivatives. For each tissue depth, at least 5 x- and 5 z-profiles were averaged (error bars show s.d.). (D) Depth dependence of lateral and axial resolution determined in the same manner as described for (C), at 1330 nm. (C and D) Axial and lateral resolution deteriorates with increasing imaging depth at both 1650 nm and 1330 nm excitation, with less degradation at 1650 nm. Thus, 3 p.m. at 1650 nm preserves subcellular resolution in the marrow cavity, with lateral resolution values better than 1 μm and axial resolution values of ≈2.5 μm, in 300 μm depth. The diffraction limit of the microscope was calculated based on the vectorial approximation, confirmed by 3p.m. of fluorescent nanospheres, at both 1650 nm and 1330 nm (Table S1), and displayed as dashed red lines. Mean values with s.d. for n = 5 measured structures are displayed for each data point in the graphs in (C) and (D).
Figure 4
Figure 4
Laser repetition rate optimization for fast image acquisition in deep tissue layers of intact tibia by three-photon excitation at 1650 nm in vivo (A) 3D reconstructions (400 × 400 × 500 μm³, 518 × 518 × 125 voxel) of tdTomato (red) and SHG (white) in the intact tibia of a Cdh5:tdTom mouse at 1650 nm, with 1, 2, 3, and 4 MHz. Deeper imaging was achieved at higher repetition rates, as indicated by the dashed lines. The pulse trains at each repetition rate for 1.98 μs pixel dwell time are shown in the graphs. (B) Left panel: Depth dependent SNR determined for tdTomato fluorescence at 1 MHz (orange), 2 MHz (green), 3 MHz (red), and 4 MHz (blue). The absolute detection limit is given by SNR = 1 (red line). SNR = 3 is needed for reliable 3D object segmentation (gray line), being reached in 300 μm depth at 1 MHz, 340 μm at 2 MHz, and ≈400 μm at both 3 and 4 MHz. Right panel: Depth dependent applied pulse energy at the tibia surface (gray line) and effective pulse energy in tissue (blue line), upper graph. The effective pulse energy is the product of the pulse energy at the tibia surface and of the normalized attenuation of radiation in tissue (bottom graph). (C) First xy image (400 × 400 μm2, 518x518 pixel) of a time-lapse 2D stack acquired by in vivo 3p.m. in the tibia of a Prx1:tdRFP mouse at 1650 nm, 3 MHz (pulse energy 16 nJ, in 126 μm tissue depth, pulse train shown in graph). (D) First xy image of a similar time-lapse 2D stack as in (C) acquired at 4 MHz (pulse energy 14 nJ, in 120 μm depth, pulse train shown in graph). (C and D) tdRFP fluorescence (stroma compartment) is shown in magenta and THG in green. Among other tissue components, erythrocytes show a THG signal, enabling to visualization of blood flow in a label-free manner. Videos were acquired over 3 min, every second. To generate the time color-coded image (right images), we calculated the difference between every two consecutive THG images, color-coded the resulting images according to the acquisition time-point, and summed them up. In this way, only regions with changing structures, such as blood flow, are highlighted. 3 p.m. at both 3 and 4 MHz enables blood flow visualization over large fields of view in the tibia marrow. As at the same pulse energy, the average laser power at 3 MHz is lower than at 4 MHz, imaging at 3 MHz is less prone to induce tissue photodamage. Scale bar = 100 μm.
Figure 5
Figure 5
Multimodal tissue analysis reveals no signs of photodamage by in vivo time-lapse three-photon imaging at 1650 nm in mouse tibia (A) Experimental design for immunofluorescence histological analysis of marrow tissue after intravital 3 p.m. at 1650 nm, 3 MHz in the tibia of CD19:tdRFP mice. 3D imaging was performed over 2 h, every 30 s, at 40 nJ (120 mW). (B) Representative immunofluorescence overlays of B lineage cells (tdRFP, magenta), heat shock protein (HSP70, yellow) and nuclear staining (DAPI, cyan) in tibia marrow tissue irradiated by 3p.m. and not irradiated (control). Scale bar = 100 μm. (C) Photodamage quantification by immunofluorescence analysis: frequencies of HSP70+ cells, apoptotic cells (TUNEL+), macrophages (CD68+), and neutrophil granulocytes (Lys6G+) at 3p.m. irradiated marrow tissue (n = 6 mice) is similar to controls (N = 3 mice). This indicates no signs of tissue photodamage by 3p.m. (D) Experimental design of in vivo imaging to compare the effect of 3p.m. to state-of-the-art 2p.m. on the motility of marrow B lineage cells. The same marrow tissue site in the tibia of CD19:tdRFP mice, with thinned cortex, was imaged by time-lapse 2 p.m. at 1100 nm, 80 MHz, followed by time-lapse 3 p.m. at 1650 nm, 3 MHz. Yellow rectangles indicate the repeatedly imaged volume acquired by 2p.m. (left) and 3p.m. (right). B lineage cells (tdRFP) are shown in magenta and SHG in white. Scale bar = 100 μm. (E and F) Representative 3D images (400 × 400 × 30 μm³, 518 × 518 × 11 voxel) of marrow B lineage cells (tdRFP) acquired by time-lapse 2p.m. (E) and 3p.m. (F) (left images). Corresponding results of tdRFP+ cell segmentation (right images). tdRFP+ cells with a cellular volume between 65 and 500 μm³ are defined as B cells (cyan), and those with a volume between 500 and 4189 μm³ as plasma cells (yellow). Scale bar = 50 μm. (G and H) Rose plots representing the cell tracks of B cells (left; n = 1121 cells for 2p.m. and n = 2006 cells for 3p.m., in the same mouse) and plasma cells (right; n = 56 cells for 2p.m. and n = 136 cells for 3p.m.) over 30 min (2p.m. in G, 3p.m. in H). (I and J) Cell volume distribution of segmented tdRFP+ cells from the time-lapse data (left). Volume threshold of 500 μm³ (cell diameter 10 μm) is indicated by the red line. Mean displacement rate distributions of B cells and plasma cells, respectively (right). 2p.m. data are shown in (I), 3p.m. data in (J). (D–J) As the cell motility behavior of both marrow B cells and plasma cells is similar when analyzed by 2p.m. and by 3p.m., we conclude that 3 p.m. at 1650 nm, 3 MHz is reliable for assessing cell dynamics in vivo. Statistical analysis was performed using t-test, p values indicated, mean values are displayed, with s.d. ranges for displacement rate and mean velocity.
Figure 6
Figure 6
Heterogeneity within the plasma cell population in the tibia marrow is defined by both their cellular migration patterns and THG signal (A) Experimental design of in vivo time-lapse 3 p.m. at 1650 nm, 3 MHz in the intact tibia of CD19:tdRFP mice to study the migratory behavior of marrow plasma cells. A first acquisition period of 1 h, every 30 s is followed by acquisition over 2 h, every 120 s. (B) 3D image of intact tibia acquired by 3 p.m. at 1650 nm, 3 MHz (exponential pulse-energy z-adaptation: 1.9 to 30.4 nJ). THG is shown in green, B lineage cells (tdRFP) in magenta. The yellow rectangle indicates the repeatedly imaged volume (≈300 μm depth). Scale bar = 100 μm. (C) Representative 3D images of B lineage cells (400 × 400 × 30 μm³, 518 × 518 × 11 voxel) acquired during the first (left) and second imaging period (middle). Result of B lineage cell segmentation based on the data acquired during the second imaging period (2 h, right). B cells (cyan) and plasma cells (yellow) were defined by volume. Scale bar = 50 μm. (D) Rose plots representing cell tracks of B cells (left; n = 765 cells) and plasma cells (right; n = 64 cells). (E) Mean displacement rate distribution of marrow plasma cells assessed from the cell tracks measured over the entire 3 h imaging period in a single mouse (left). Logarithmic representation of cell frequency histogram with respect to the mean displacement rate (right), fitted by a double Gauss-peak distribution, indicating two distinctly motile plasma cell subsets in the tibia marrow. The black lines represent the Gaussian fitting functions, the red line represents their sum. (F) Relative cell frequencies of migratory and non-migratory marrow plasma cells in N = 3 CD19:tdRFP mice (mean values with s.d. range are displayed). (G) Merged (left) and single channel (middle, right) 3D images (400 × 400 × 100 μm³, 518 × 518 × 51 voxel) of tdRFP fluorescence (magenta) in B lineage cells and THG (green) in the intact tibia of a CD19:tdRFP mouse, by in vivo 3 p.m. at 1650 nm, 3 MHz, 21 nJ pulse energy, showing heterogeneous THG signal distribution among B lineage cells. Scale bar = 50 μm. (H) Percentage of THG+ cell numbers within the B cell and plasma cell population, respectively (N = 6 mice, mean values with s.d. range are displayed). Whereas THG signal is enriched in marrow plasma cells as compared to B cells, only 1/3 of the detected plasma cells display the signal. Statistical analysis was performed using t-test, p value indicated.
Figure 7
Figure 7
THGhi signal defines two marrow plasma cell subsets with distinct functional capacity and migratory behavior (A) Representative 3D image (400 × 400 × 100 μm³, 518 × 518 × 11 voxel) of THG signal (green) in tibia cortex and marrow acquired by in vivo 3 p.m. at 1650 nm, 3 MHz. Scale bar = 50 μm. (i) Pixel distribution of THG signal in the tibia marrow: background (brown rectangle), THGlo (cyan rectangle), and THGhi (yellow rectangle). 2D image of THG signal in cells in the bone marrow, showing THGlo signal in cell membranes (cyan arrowheads) and granular intracellular THGhi signal (rose stars). Scale bar = 30 μm. (ii) Pixel distribution of THG signal in the tibia cortex, with the same color-coding for background, THGlo, and THGhi pixels as in the bone marrow. 2D image of THG signals in the bone tissue, showing lacunae and connecting canaliculi. Scale bar = 30 μm. (B) Cell segmentation distinguishing between THGlo (cyan) and THGhi (yellow) cells (magenta rectangle in A). (C) Merged (left) and single channel (middle and right) 3D image (442 × 442 × 102 μm³, 1036 × 1036 × 52 voxel) of THGhi (green) and endoplasmic reticulum (ER, magenta) in the bone marrow of an explanted C57/Bl6 mouse tibia (3 p.m. at 1650 nm). Scale bar = 50 μm. (D) Percentage of ER+ cells in the THGhi cell population and of THGhi cells in the ER+ cell population (N = 10 mice, each data point represents a mouse), showing a strong correlation of THGhi signal and ER staining at the single cell level in the tibia marrow. Mean values with s.d. range are displayed. (E) Representative close-up images of THGhiER+ cells, showing non-identical overlap of THGhi signal and ER staining. Scale bar = 5 μm. (F) Representative close-up images of THGhi cells in the tibia marrow, showing THGhi signal originates both from ER (ER Tracker Red) and mitochondria (MitoTracker Deep Red). Scale bare = 5 μm. (G) Representative 3D image from a 60 min time-lapse in vivo 3p.m. video at 1650 nm, 3 MHz in the tibia of a CD19:tdRFP mouse (400 × 400 × 30 μm³, 518 × 518 × 11 voxel), every 30s. Scale bar = 50 μm. (H) Percentage of THGhi cells in the CD19:tdRFP marrow cell populations with V > 500 μm³ (plasma cells) and with V < 500 μm³ (B cells), and in the Blimp1:GFP marrow cell population with V > 500 μm³ (plasma cells). The percentage of ER+THGhi cells in the Blimp1:GFP ER+ cell population with V > 500 μm³ (plasma cells) is shown in red (mean values with s.d. range are displayed for N = 5 to 6 mice per case (each data points in the graph represents the results for a mouse) and >300 analyzed cells per mouse). (I) Distributions of mean displacement rates in the THGhi and THGlo plasma cell subset, respectively, showing that THGhi plasma cells are less motile than their THGlo counterparts (mean values with s.d. range are displayed). (J) Histograms of the mean displacement rates of THGhi and THGlo marrow plasma cells (data shown in I), highlight a bimodal distribution for THGlo cells, in contrast to THGhi cells. Statistical analysis was performed using two-way ANOVA with Bonferroni post-test or two-tail t-test, with p values indicated.

References

    1. Hawkins E.D., Duarte D., Akinduro O., Khorshed R.A., Passaro D., Nowicka M., Straszkowski L., Scott M.K., Rothery S., Ruivo N., et al. T-cell acute leukaemia exhibits dynamic interactions with bone marrow microenvironments. Nature. 2016;538:518–522. doi: 10.1038/nature19801. - DOI - PMC - PubMed
    1. Upadhaya S., Krichevsky O., Akhmetzyanova I., Sawai C.M., Fooksman D.R., Reizis B. Intravital Imaging Reveals Motility of Adult Hematopoietic Stem Cells in the Bone Marrow Niche. Cell Stem Cell. 2020;27:336–345.e4. doi: 10.1016/j.stem.2020.06.003. - DOI - PMC - PubMed
    1. Kim S., Lin L., Brown G.A.J., Hosaka K., Scott E.W. Extended time-lapse in vivo imaging of tibia bone marrow to visualize dynamic hematopoietic stem cell engraftment. Leukemia. 2017;31:1582–1592. doi: 10.1038/leu.2016.354. - DOI - PMC - PubMed
    1. Ulbricht C., Cao Y., Niesner R.A., Hauser A.E. In good times and in bad: How plasma cells resolve stress for a life-long union with the bone marrow. Front. Immunol. 2023;14 doi: 10.3389/fimmu.2023.1112922. - DOI - PMC - PubMed
    1. Benet Z., Jing Z., Fooksman D.R. Plasma cell dynamics in the bone marrow niche. Cell Rep. 2021;34 doi: 10.1016/j.celrep.2021.108733. - DOI - PMC - PubMed

LinkOut - more resources