. 2025 Apr 3;148(4):1212-1227.
doi: 10.1093/brain/awae319.

Dysregulation of protein SUMOylation networks in Huntington's disease R6/2 mouse striatum

Affiliations

Dysregulation of protein SUMOylation networks in Huntington's disease R6/2 mouse striatum

Marketta Kachemov et al. Brain. .

Abstract

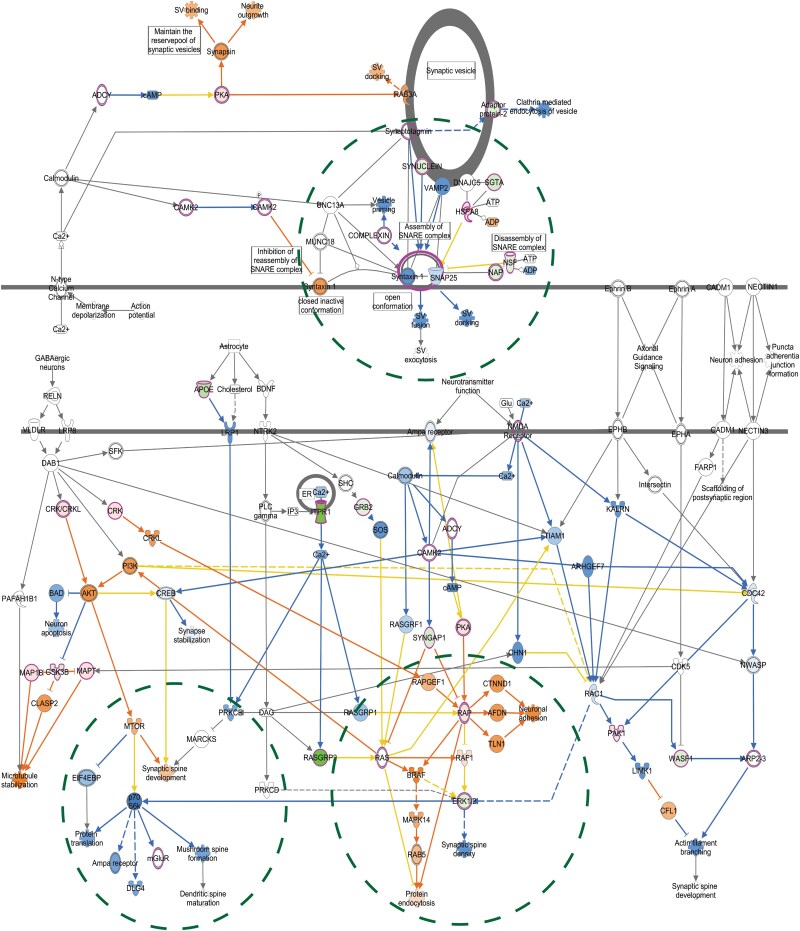
Huntington's disease is a neurodegenerative disorder caused by an expanded CAG repeat mutation in the Huntingtin (HTT) gene. The mutation impacts neuronal protein homeostasis and cortical/striatal circuitry. SUMOylation is a post-translational modification with broad cellular effects including via modification of synaptic proteins. Here, we used an optimized SUMO protein-enrichment and mass spectrometry method to identify the protein SUMOylation/SUMO interaction proteome in the context of Huntington's disease using R6/2 transgenic and non-transgenic mice. Significant changes in the enrichment of SUMOylated and SUMO-interacting proteins were observed, including those involved in presynaptic function, cytomatrix at the active zone, cytoskeleton organization and glutamatergic signalling. Mitochondrial and RNA-binding proteins also showed altered enrichment. Modified SUMO-associated pathways in Huntington's disease tissue include clathrin-mediated endocytosis signalling, synaptogenesis signalling, synaptic long-term potentiation and SNARE signalling. To evaluate how modulation of SUMOylation might influence functional measures of neuronal activity in Huntington's disease cells in vitro, we used primary neuronal cultures from R6/2 and non-transgenic mice. A receptor internalization assay for the metabotropic glutamate receptor 7 (mGLUR7), a SUMO-enriched protein in the mass spectrometry, showed decreased internalization in R6/2 neurons compared to non-transgenic neurons. SiRNA-mediated knockdown of the E3 SUMO ligase protein inhibitor of activated STAT1 (Pias1), which can SUMO modify mGLUR7, reduced this Huntington's disease phenotype. In addition, microelectrode array analysis of primary neuronal cultures indicated early hyperactivity in Huntington's disease cells, while later time points demonstrated deficits in several measurements of neuronal activity within cortical neurons. Huntington's disease phenotypes were rescued at selected time points following knockdown of Pias1. Collectively, our results provide a mouse brain SUMOome resource and show that significant alterations occur within the post-translational landscape of SUMO-protein interactions of synaptic proteins in Huntington's disease mice, suggesting that targeting of synaptic SUMO networks may provide a proteostatic systems-based therapeutic approach for Huntington's disease and other neurological disorders.

Keywords: E3 SUMO ligase; Huntington’s disease; PIAS1; SUMO; mGLUR7; proteomics; synaptic.


Conflict of interest statement

The authors report no competing interests.

Figures

Figure 1
Figure 1
R6/2 Huntington’s disease mice display altered SUMO-enrichment profiles of synaptic proteins. (A) Schematic of SUMO capture/mass spectrometry approach (n = 4/group, males and females). Created in BioRender (BioRender.com/i31q922). (B) Overlap between the number of peptides detected from the SUMO-enriched isolation and the peptides from the total striatal lysate. (C) Number of unique significantly differentially enriched proteins (DEPs) identified within the SUMO-enriched protein normalised to total protein and the total protein datasets. Values of −log2fold-change (FC) > 0 and −log2(FC) < 0 indicate higher and lower enrichment in Huntington’s disease (HD) conditions compared to non-transgenic (NT), respectively. (D) Representative SUMOylated proteins identified in the discovery-based proteomic experiments and predicted SUMO motifs (high probability in black and low probability in grey) within the HOMER1, PICK1 and NMDZ1 proteins (https://www.abcepta.com/sumoplot). (E) SUMO and (F) total proteomics of the HD striatum and cortico-striatal connections display significant associations with proteins from synaptic protein pathways. Synaptogenesis signalling was one of the top shared canonical pathways identified between both the normalized SUMO-enriched [−log(P-value) = 4.27; positive z-score activation of 2.121 SD from the mean] and total protein [−log(P-value) = 20.2; negative z-score activation of −2.832 SD from the mean] datasets. HPLC = high-performance liquid chromatography.
Figure 2
Figure 2
Ingenuity pathway analysis of differentially enriched proteins. Significantly differentially enriched proteins from the normalized SUMO-enriched dataset overlaid on the synaptogenesis signalling pathway include CACNA2D2, EPHA4, GRIN1 (NMDZ1), GRM5, NAPG, PRKAR1A, PRKCE, RAC1 and SYT7 (outlined in pink), although other proteins were observed. Darker orange colours indicate greater predicted activation states, while darker blue colours indicate greater predicted inhibition.
Figure 3
Figure 3
Visualization analysis of pathways identified from normalized, significantly differentially-SUMO-enriched proteins. (A) An ontology network, constructed from the protein interaction network extractor (PINE) tool, yielded enrichment-related relationships based on peptide-level fold-changes for Huntington’s disease (HD) versus non-transgenic (NT) conditions between the following Gene Ontology terms: regulation of synaptic plasticity; synaptic vesicle membrane; activation of NMDA receptors and postsynaptic events; neuron to neuron synapse; and activation of the mRNA on binding of cap-binding complex and eIFs and binding to 43S pathways. The fold-change of each peptide is projected onto its corresponding protein and is represented in red (for upregulated peptides) and/or blue (for downregulated peptides); the darker the shade, the greater the degree of fold-change between the HD versus NT conditions. For proteins with more than one significantly differentially expressed peptide (for example, SYNPO), the node is sectioned into multiple peptides, with each section depicting the fold-change associated with its corresponding peptide. Additionally, the central enrichment nodes (showing the various ontologies) are in orange or blue to depict overall up- or down-regulation, respectively, based on whether the majority of their associated peptides were up- or down-regulated. (B) The doughnut network depicts protein–protein interactions for proteins associated with the pathway terms in A. Each protein is shaped in the form of a doughnut, with the colour of the doughnut representing the associated pathway terms. For proteins associated with more than one pathway term (for example, ACTN2), the doughnut is sectioned into multiple colours, each representing a different pathway term.
Figure 4
Figure 4
Validation of PICK1 SUMOylation. In-cell HeLa SUMOylation assay showing a Myc-tagged PICK1 protein is SUMO modified by His-tagged SUMO1. SUMOylated proteins were enriched via a denaturing His-tag isolation. The area outlined in orange indicates SUMOylated PICK1, which has a higher molecular weight than negative His-SUMO1 controls. The full blot is provided in Supplementary Fig. 3. n = 2 for Myc-PICK1-only transfection, n = 3 for Myc-PICK1 and His-SUMO1 transfections.
Figure 5
Figure 5
mGLUR7 SUMOylation and endocytosis. (A) SUMO-limiting experiment in HeLa cells transfected with His-SUMO1, Myc- mGLUR7 and PIAS1. Top: His-pulldown of His-SUMO1 protein. Bottom: Trichloroacetic acid protein precipitation (TCA) whole-cell lysate. Full SUMO transfections (e.g. ‘+’) included 2 µg of SUMO1 per replicate, whereas one-quarter SUMO1 (e.g. ‘1/4’) were transfected with 0.5 µg of SUMO1 plasmid. The area outlined in orange is an example of the area used to quantify each lane. The full blot is provided in Supplementary Fig. 3. (B) Quantification of the Myc-mGLUR7 signal is shown in the His-isolated (left) and whole-cell lysate (right) conditions. His-isolated samples showed a significant difference in levels of SUMO-mGLUR7 isolated. F(4,9) = 34.42, P < 0.0001 with Šídák’s multiple comparisons test: mGLUR7 versus mGLUR7 + SUMO1, Padj = 0.0173; mGLUR7 + SUMO1 versus mGLUR7 + 1/4 SUMO1, Padj = 0.0165; mGLUR7 + 1/4 SUMO1 versus mGLUR7 + 1/4 SUMO1 + PIAS1, Padj = 0.0001; mGLUR7 + SUMO1 versus mGLUR7 + 1/4 SUMO1 + PIAS1, Padj = 0.0190; analysed by one-way ANOVA. TCA samples show no change in mGLUR7 levels. One-way ANOVA with Šídák’s multiple comparisons test: F(4,9) = 0.6085, P = 0.6668. n = 2 for His-SUMO1-only control transfections, n = 3 transfections for all other conditions. (C) Schematic of mGLUR7 internalization experiment. Created in BioRender (BioRender.com/i50e678). (D) The endocytosis of mGLUR7 was assessed by antibody uptake internalization assay. Non-transgenic (NT) and Huntington’s disease (HD) primary striatal neurons (PSNs) from R6/2 pups were treated with Pias1 or control siRNA, transfected with Myc-tagged mGLUR7, labelled with anti-c-Myc antibody, washed and returned to conditioned media at 37°C for 15 min. Representative images are of transfected mGLUR7 receptor internalization. Internalized receptors, green; surface receptors, magenta (false-coloured from red for clarity); nuclei, blue. The internalization ratio was the fluorescence intensity of the internalized receptor (green) over the total amount of receptor (sum of green and red intensity shown in magenta). Individual channels are shown in Supplementary Fig. 6. (E) Receptor internalization assay for mGLUR7 in R6/2 primary striatal neurons (PSNs) demonstrated a significant decrease in mGLUR7 internalization in HD neurons compared to NT cells. Treatment by Pias1 siRNA-mediated knockdown significantly reversed levels of mGLUR7 internalization. mGLUR7 internalization: treatment, F(1,29) = 18.81, P = 0.0002; genotype, F(1,29) = 0.001509, P = 0.9693; analysed by two-way ANOVA. *P < 0.05, ***P < 0.001, ****P < 0.0001, n = branch areas, three per neuron. Graphs represent mean ± standard error of the mean.
Figure 6
Figure 6
PIAS1 knockdown rescues alterations to neuronal activity in Huntington’s disease primary cortical neurons. (A) Experimental schematic of microelectrode array (MEA) workflow. Created in BioRender (BioRender.com/s52a685). (B) Significant differences identified in various MEA metrics at three time points [14, 16 and 19 days in vitro (DIV14, DIV16 and DIV19)] between conditions: Genotype effect [significant difference between non-transgenic (NT) control knockdown and Huntington’s disease (HD) control knockdown cells], PIAS1 knockdown effect in HD cells (significant difference between control knockdown and PIAS1 knockdown in HD cells) and PIAS1 knockdown effect in NT cells (significant difference between control knockdown and PIAS1 knockdown in NT cells). Blue or yellow indicates significantly decreased or increased, respectively, values in the HD cells (compared to NT cells) and PIAS1 knockdown cells [compared to control siRNA (in either HD or NT cells)], respectively. ‘X’ indicates no significant difference detected. (C) Weighted mean firing rate (WMFR) was significantly higher in control knockdown-treated HD cells compared to control knockdown-treated NT cells at DIV14 and DIV16. This pattern reversed at DIV19. The increases seen in the WMFR in HD at DIV14 and DIV16 were significantly reduced upon knockdown with Pias1 siRNA. Primary cortical neurons (PCNs) DIV14 WMFR: treatment, F(1,20) = 0.8446, P = 0.3690, genotype, F(1,20) = 12.11, P = 0.0024; PCN DIV 16 WMFR: treatment, F(1,20) = 13.63, P = 0.0014, genotype, F(1,20) = 14.75, P = 0.0010; PCN DIV 19 WMFR: treatment, F(1,20) = 1.243, P = 0.2781, genotype, F(1,20) = 2.793, P = 0.1102. *P < 0.05, ***P < 0.001. Graphs represent means ± standard error of the mean analysed by two-way ANOVA. A master analysis sheet of all significant differences in the remaining time points of PCNs can be found in the Supplementary material, File 016. n = 6 wells/condition.

References

    1. Huntington’s Disease Collaborative Research Group . A novel gene containing a trinucleotide repeat that is expanded and unstable on Huntington’s disease chromosomes. Cell. 1993;72:971–983. - PubMed
    1. Barron JC, Hurley EP, Parsons MP. Huntingtin and the Synapse. Front Cell Neurosci. 2021;15:689332. - PMC - PubMed
    1. Li H, Wyman T, Yu ZX, Li SH, Li XJ. Abnormal association of mutant huntingtin with synaptic vesicles inhibits glutamate release. Hum Mol Genet. 2003;12:2021–2030. - PubMed
    1. Vitet H, Brandt V, Saudou F. Traffic signaling: New functions of huntingtin and axonal transport in neurological disease. Curr Opin Neurobiol. 2020;63:122–130. - PubMed
    1. Harding RJ, Tong Y-F. Proteostasis in Huntington’s disease: Disease mechanisms and therapeutic opportunities. Acta Pharmacol Sin. 2018;39:754–769. - PMC - PubMed

Substances