. 2024 Nov 1;32(6):778-792.
doi: 10.4062/biomolther.2024.083. Epub 2024 Oct 11.

Atractylodes Lancea and Its Constituent, Atractylodin, Ameliorates Metabolic Dysfunction-Associated Steatotic Liver Disease via AMPK Activation

Affiliations

Atractylodes Lancea and Its Constituent, Atractylodin, Ameliorates Metabolic Dysfunction-Associated Steatotic Liver Disease via AMPK Activation

Ga Yeon Song et al. Biomol Ther (Seoul). .

Abstract

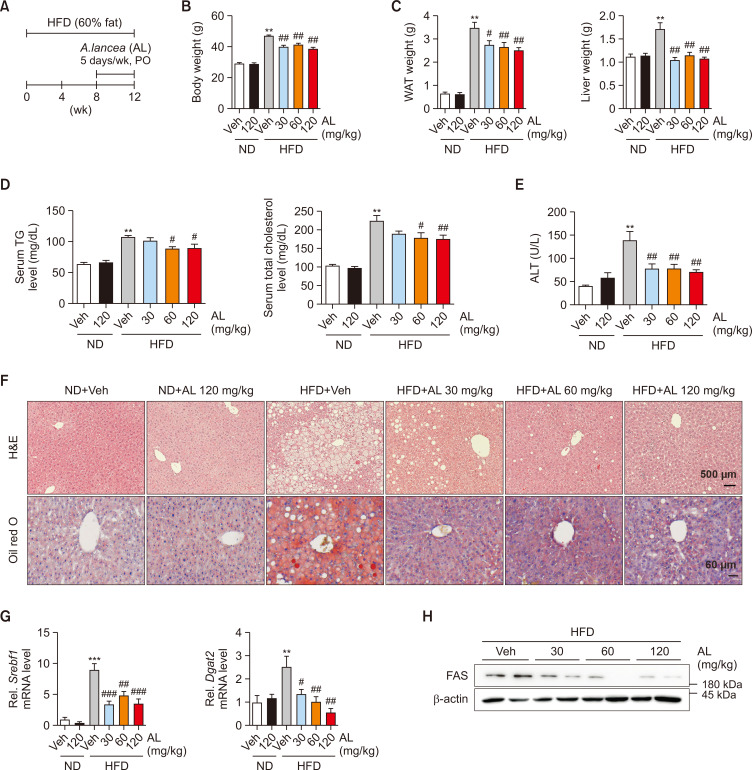
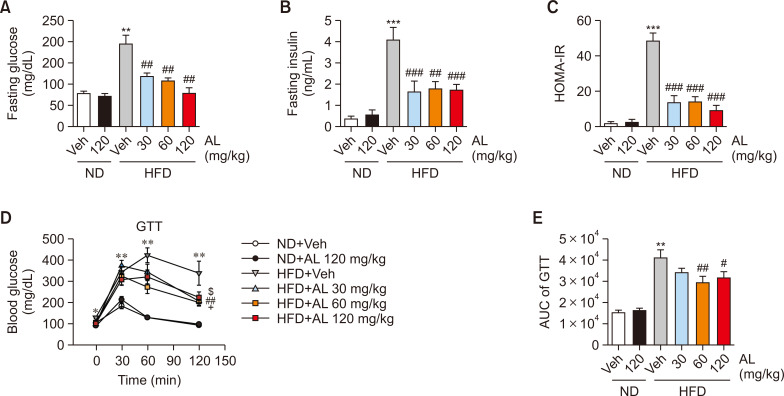
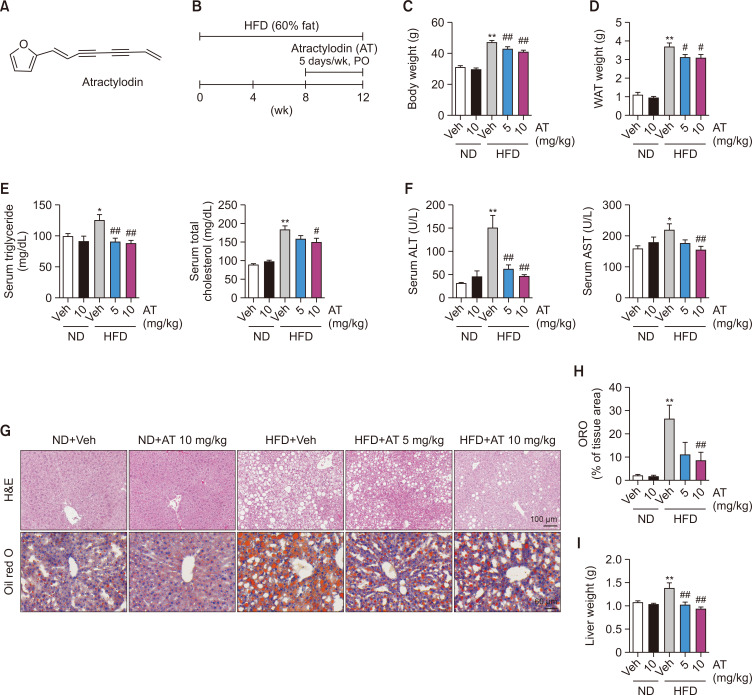
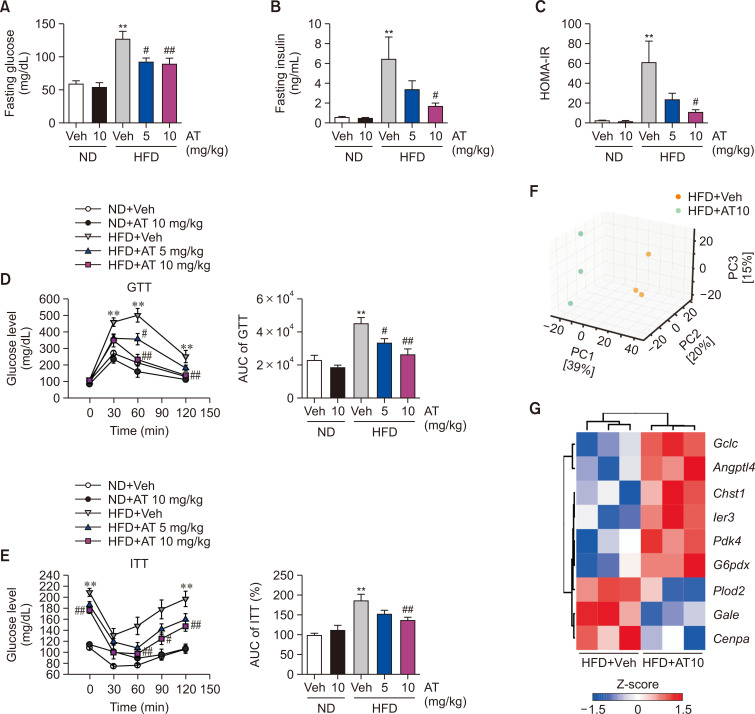
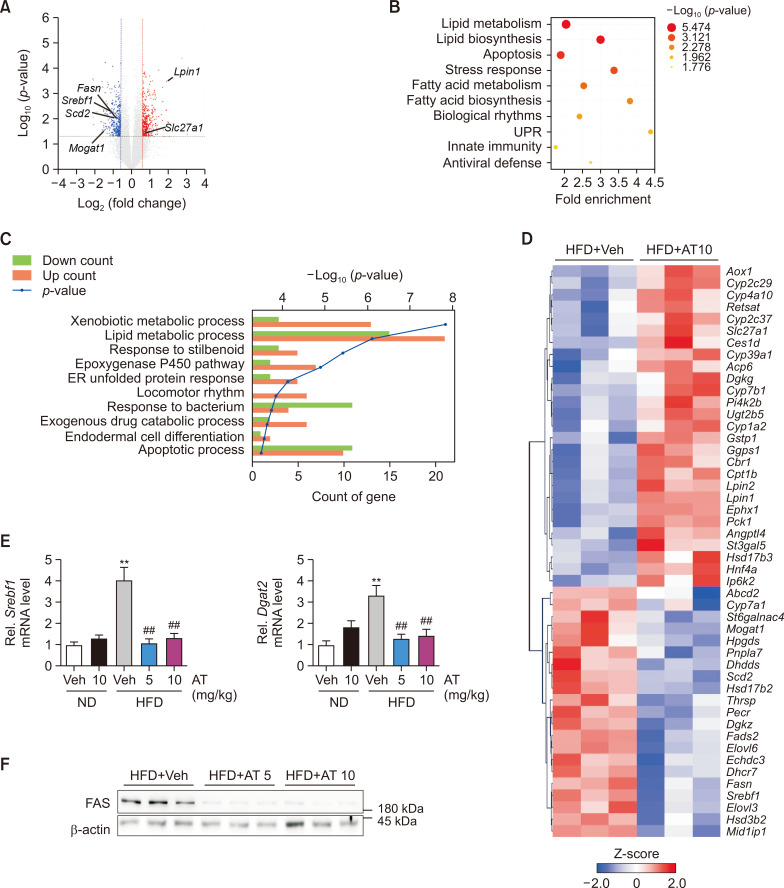
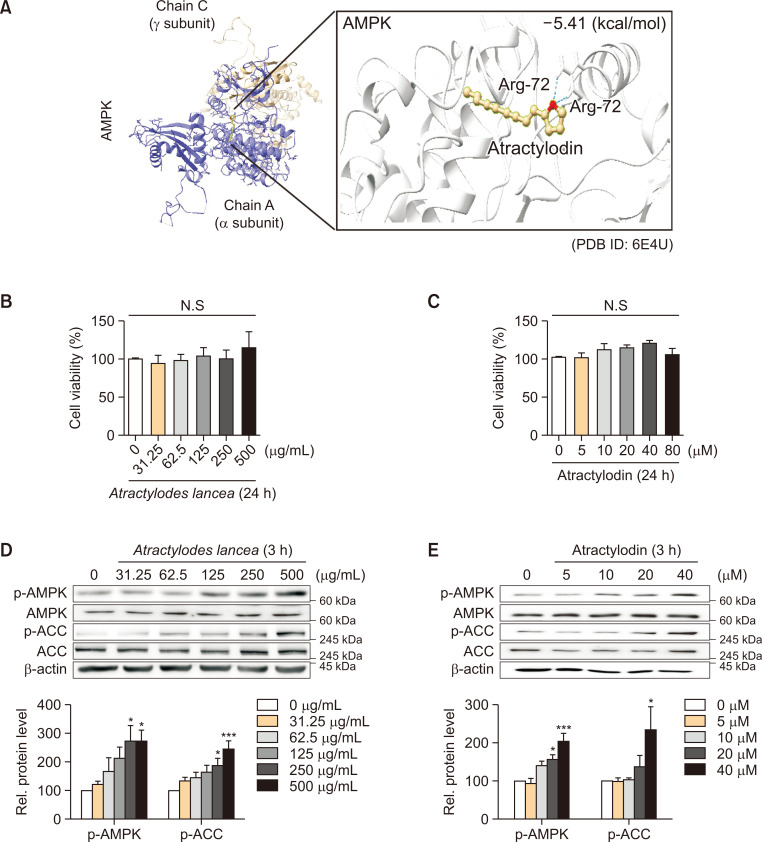
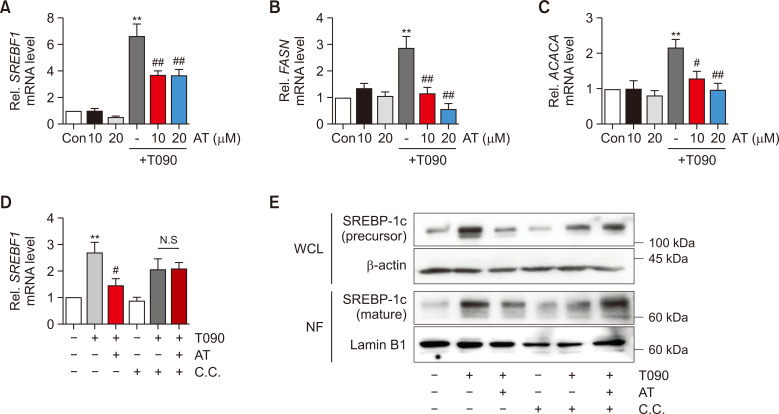
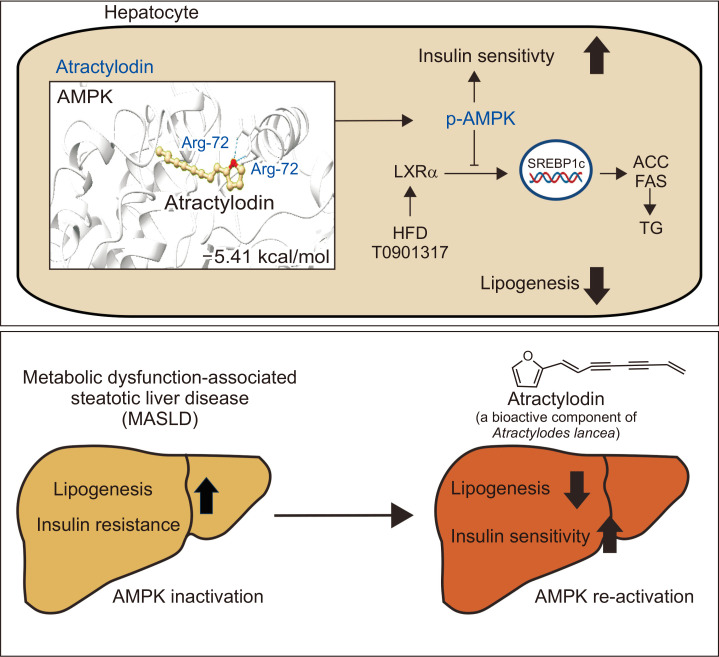
Metabolic dysfunction-associated steatotic liver disease (MASLD), which encompasses a spectrum of conditions ranging from simple steatosis to hepatocellular carcinoma, is a growing global health concern associated with insulin resistance. Since there are limited treatment options for MASLD, this study investigated the therapeutic potential of Atractylodes lancea, a traditional herbal remedy for digestive disorders in East Asia, and its principal component, atractylodin, in treating MASLD. Following 8 weeks of high-fat diet (HFD) feeding, mice received oral doses of 30, 60, or 120 mg/kg of Atractylodes lancea. In HFD-fed mice, Atractylodes lancea treatment reduced the body weight; serum triglyceride, total cholesterol, and alanine aminotransferase levels; and hepatic lipid content. Furthermore, Atractylodes lancea significantly ameliorated fasting serum glucose, fasting serum insulin, and homeostatic model assessment of insulin resistance levels in response to HFD. Additionally, a glucose tolerance test demonstrated improved glucose homeostasis. Treatment with 5 or 10 mg/kg atractylodin also resulted in anti-obesity, anti-steatosis, and glucose-lowering effects. Atractylodin treatment resulted in the downregulation of key lipogenic genes (Srebf1, Fasn, Scd2, and Dgat2) and the upregulation of genes regulated by peroxisome proliferator-activated receptor-α. Notably, the molecular docking model suggested a robust binding affinity between atractylodin and AMP-activated protein kinase (AMPK). Atractylodin activated AMPK, which contributed to SREBP1c regulation. In conclusion, our results revealed that Atractylodes lancea and atractylodin activated the AMPK signaling pathway, leading to improvements in HFD-induced obesity, fatty liver, and glucose intolerance. This study suggests that the phytochemical, atractylodin, can be a treatment option for MASLD.

Keywords: AMP-activated protein kinase; Atractylodes lancea; Atractylodin; Fatty liver; Insulin resistance; MASLD.


Conflict of interest statement

CONFLICT OF INTEREST

The authors have no conflicts of interest to declare.

Figures

Fig. 1
Fig. 1
HFD-induced obesity and fatty liver is attenuated by Atractylodes lancea treatment. (A) Schematic of the experimental design. Mice were maintained on a normal diet (ND) or high-fat diet (HFD) for 12 weeks, and 30 mg/kg, 60 mg/kg, or 120 mg/kg of Atractylodes lancea (AL) was administered orally during the final 4 weeks of HFD feeding (n=7-10, each group). (B) Mouse body weight at the end of the study. (C) White adipose tissue (WAT) and liver weight. (D) Serum triglyceride (TG) and total cholesterol levels. (E) Serum alanine aminotransferase (ALT) levels. (F) Representative images of Hematoxylin and eosin (H&E) and Oil Red O staining in the liver. Scale bar (H&E): 500 μm, scale bar (ORO): 60 μm. (G) RT-qPCR analyses of Srebf1 and Dgat2 mRNA levels from the mouse liver. (H) Immunoblot analysis showing the expression levels of fatty acid synthase (FAS) protein in the liver tissues from HFD-fed mice treated with Atractylodes lancea compared to vehicle (Veh)-treated controls. Data are presented as mean ± SEM (n=7-10). Statistical analysis was performed using one-way ANOVA with Tukey’s post-hoc test. **p<0.01, ***p<0.001: compared with ND+Veh; #p<0.05, ##p<0.01, ###p<0.001: compared with HFD+Veh.
Fig. 2
Fig. 2
Atractylodes lancea alleviates glucose intolerance. (A) Fasting serum glucose levels (mg/dL) after a 16 h fast at the end of the study. (B) Fasting serum insulin levels (ng/mL). (C) Homeostatic model assessment of insulin resistance (HOMA-IR) calculated using the formula: [Fasting insulin (μU/mL)×Fasting glucose (mg/dL)]÷405. (D) Glucose tolerance test (GTT) was performed 2 weeks after the administration of Atractylodes lancea. (E) The area under the curve (AUC) of GTT. Data are presented as mean ± SEM (n=7-10). Statistical analysis was performed using one-way ANOVA with Tukey’s post-hoc test. (A-C, E) **p<0.01, ***p<0.001: compared with ND+Veh; #p<0.05, ##p<0.01, ###p<0.001: compared with HFD+Veh. (D) *p<0.05, **p<0.01: ND+Veh vs. HFD+Veh; ##p<0.01: HFD+Veh vs. HFD+AL 30 mg/kg; +p<0.05: HFD+Veh vs HFD+AL 60 mg/kg; $p<0.05: HFD+Veh vs HFD+AL 120 mg/kg.
Fig. 3
Fig. 3
Atractylodin ameliorates obesity and lipogenesis in HFD-fed mice. (A) Molecular structure of atractylodin. (B) Schematic of the experimental procedure to evaluate the role of atractylodin (AT) in HFD-induced MASLD in mice (n=8-9, each group). (C) Mouse body weight. (D) White adipose tissue (WAT) weight of mice. (E) Serum triglyceride and total cholesterol levels. (F) Serum ALT and AST levels. (G) Representative H&E and Oil red O (ORO) staining images. Scale bar (H&E): 100 μm, scale bar (ORO): 60 μm. (H) The quantification of Oil red O staining (% of tissue area). (I) Liver weight. Data are presented as mean ± SEM (n=8-9). Statistical analysis was performed using one-way ANOVA with Tukey’s post-hoc test. *p<0.05, **p<0.01: compared with ND+Veh; #p<0.05, ##p<0.01: compared with HFD+Veh.
Fig. 4
Fig. 4
Mice treated with atractylodin overcome glucose intolerance. (A) Fasting serum glucose levels after sacrificing mice that were fasted for more than 16 h. (B) Fasting serum insulin levels. (C) HOMA-IR index. (D) Glucose tolerance test (GTT). GTT curve (left) and area under the curve (AUC, right). (E) Insulin tolerance test (ITT). ITT curve (left) and % of area under the curve (AUC, right). Data are presented as mean ± SEM (n=8-9). Statistical analysis was performed using one-way ANOVA with Tukey’s post-hoc test. **p<0.01: compared with ND+Veh; #p<0.05, ##p<0.01: compared with HFD+Veh. (F) Principal component analysis (PCA) comprising gene expression patterns in the livers of HFD-fed mice treated with vehicle (HFD+Veh) or 10 mg/kg atractylodin (HFD+AT10) (n=3). (G) Heatmap of gene expression changes in the glucose metabolism upon atractylodin treatment.
Fig. 5
Fig. 5
The lipid metabolic process was dysregulated by atractylodin. (A) Volcano plot depicting differential expression of genes in the atractylodin-treated group compared to the vehicle-treated group in HFD-fed mice. Genes with significant upregulation are shown in red, downregulated genes in blue, and genes with no significant difference in grey (│fold change│>1.5, p-value <0.05). (B) Top 10 Gene Ontology (GO) biological process (BP) analysis of major signaling pathways. Using the DAVID bioinformatics database. (C) Analysis of significantly enriched GO terms using the GO BP Direct database. (D) Heatmap illustrating the results of RNA-sequencing analysis for the lipid metabolic process (n=3). (E) Reduced hepatic mRNA expression of key enzyme involved in de novo lipogenesis, Srebf1 and Dgat2, in atractylodin-treated HFD-fed mice compared to vehicle-treated HFD-fed mice (n=8-9, each group). Data are presented as mean ± SEM. Statistical analysis was performed using one-way ANOVA with Tukey’s post-hoc test. **p<0.01: compared with ND+Veh; ##p<0.01: compared with HFD+Veh. (F) Representative Western blotting for fatty acid synthase (FAS).
Fig. 6
Fig. 6
Atractylodes lancea and atractylodin activate the AMPK signaling pathway. (A) Molecular docking model of atractylodin binding to AMPK. The α subunit is represented in purple, the γ subunit in beige, and the components in yellow. (B, C) Cell viability after Atractylodes lancea (left) or atractylodin treatment (right). HepG2 cells were treated with Atractylodes lancea or atractylodin for 24 h at the indicated doses. The MTT assay was performed, and absorbance at 540 nm OD was measured (n=5). (D, E) Protein levels of phospho-AMPK and phospho-ACC. HepG2 cell were treated with (D) Atractylodes lancea (n=8) or (E) atractylodin (n=3) at the indicated concentrations for 3 h. Data are presented as mean ± SEM. Statistical analysis was performed using one-way ANOVA with Dunnett’s post-hoc test. *p<0.05, ***p<0.001: compared with Control; N.S., not significant.
Fig. 7
Fig. 7
Atractylodin decreases lipogenic gene expression by activating AMPK. (A-C) qRT-PCR analyses of mRNA levels for lipogenic genes (SREBF1, FASN, and ACACA). HepG2 cells were treated with atractylodin for 1 h followed by T090 treatment for 12 h (n=4). (D) qRT-PCR analysis of SREBF1 mRNA levels. HepG2 cells were treated with 5 μM Compound C (C.C.) for 30 min, followed by 20 μM atractylodin for 1 h, and then 3 μM T090 treatment for 12 h (n=5). (E) Representative western blots for precursor and mature SREBP-1c expression. The precursor form of SREBP-1c was assessed using whole cell lysates (WCL) (upper panel), while the mature form was determined from nuclear fractions (NF) (lower panel). Data are presented as mean ± SEM. Statistical analysis was performed using one-way ANOVA with Tukey’s post-hoc test. **p<0.01: compared with Control (Con); #p<0.05, ##p<0.01: compared with T090 treatment, N.S., not significant.
Fig. 8
Fig. 8
A schematic illustration showed the therapeutic potential of Atractylodes lancea and its principal constituent, atractylodin, in addressing metabolic dysfunction-associated steatotic liver disease (MASLD). Atractylodes lancea and atractylodin exert significant benefits by activating the AMP-activated protein kinase (AMPK) signaling pathway. These interventions lead to improvements in high-fat-diet-induced obesity, fatty liver, and insulin resistance.

Similar articles

Cited by

References

    1. Abbott M. J., Edelman A. M., Turcotte L. P. CaMKK is an upstream signal of AMP-activated protein kinase in regulation of substrate metabolism in contracting skeletal muscle. Am. J. Physiol. Regul. Integr. Comp. Physiol. 2009;297:R1724–R1732. doi: 10.1152/ajpregu.00179.2009. - DOI - PubMed
    1. Armstrong M. J., Gaunt P., Aithal G. P., Barton D., Hull D., Parker R., Hazlehurst J. M., Guo K. LEAN trial team, author; Abouda, G., Aldersley, M. A., Stocken, D., Gough, S. C., Tomlinson, J. W., Brown, R. M., Hubscher, S. G., Newsome, P. N., author Liraglutide safety and efficacy in patients with non-alcoholic steatohepatitis (LEAN): a multicentre, double-blind, randomised, placebo-controlled phase 2 study. Lancet. 2016;387:679–690. doi: 10.1016/S0140-6736(15)00803-X. - DOI - PubMed
    1. Bai Y., Zhao Y. H., Xu J. Y., Yu X. Z., Hu Y. X., Zhao Z. Q. Atractylodin induces myosin light chain phosphorylation and promotes gastric emptying through ghrelin receptor. Evid. Based Complement. Alternat. Med. 2017;2017:2186798. doi: 10.1155/2017/2186798. - DOI - PMC - PubMed
    1. Bae E. J., Yang Y. M., Kim J. W., Kim S. G. Identification of a novel class of dithiolethiones that prevent hepatic insulin resistance via the adenosine monophosphate-activated protein kinase-p70 ribosomal S6 kinase-1 pathway. Hepatology. 2007;46:730–739. doi: 10.1002/hep.21769. - DOI - PubMed
    1. Boudaba N., Marion A., Huet C., Pierre R., Viollet B., Foretz M. AMPK re-activation suppresses hepatic steatosis but its downregulation does not promote fatty liver development. EBioMedicine. 2018;28:194–209. doi: 10.1016/j.ebiom.2018.01.008. - DOI - PMC - PubMed