. 2024 Nov;20(11):8097-8112.
doi: 10.1002/alz.14317. Epub 2024 Oct 11.

Amyloid PET detects the deposition of brain Aβ earlier than CSF fluid biomarkers

Affiliations

Amyloid PET detects the deposition of brain Aβ earlier than CSF fluid biomarkers

Val J Lowe et al. Alzheimers Dement. 2024 Nov.

Abstract

Introduction: Understanding the relationship between amyloid beta (Aβ) positron emission tomography (PET) and Aβ cerebrospinal fluid (CSF) biomarkers will define their potential utility in Aβ treatment. Few population-based or neuropathologic comparisons have been reported.

Methods: Participants 50+ years with Aβ PET and Aβ CSF biomarkers (phosphorylated tau [p-tau]181/Aβ42, n = 505, and Aβ42/40, n = 54) were included from the Mayo Clinic Study on Aging. From these participants, an autopsy subgroup was identified (n = 47). The relationships of Aβ PET and Aβ CSF biomarkers were assessed cross-sectionally in all participants and longitudinally in autopsy data.

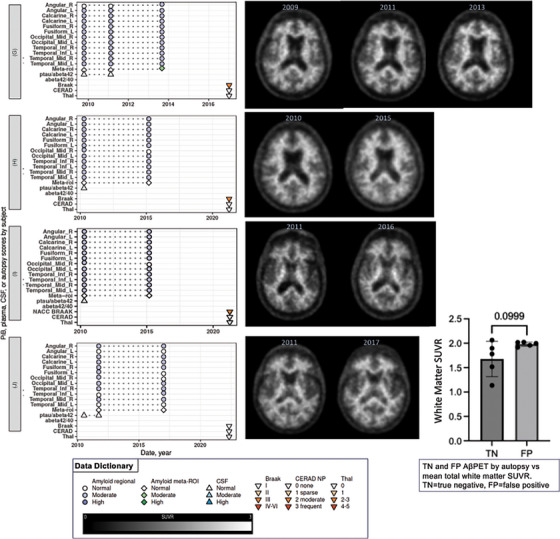
Results: Cross-sectionally, more participants were Aβ PET+ versus Aβ CSF- than Aβ PET- versus Aβ CSF+ with an incremental effect when using Aβ PET regions selected for early Aβ deposition. The sensitivity for the first detection of Thal phase ≥ 1 in longitudinal data was higher for Aβ PET (89%) than p-tau181/Aβ42 (64%).

Discussion: Aβ PET can detect earlier cortical Aβ deposition than Aβ CSF biomarkers. Aβ PET+ versus Aβ CSF- findings are several-fold greater using regional Aβ PET analyses and in peri-threshold-standardized uptake value ratio participants.

Highlights: Amyloid beta (Aβ) positron emission tomography (PET) has greater sensitivity for Aβ deposition than Aβ cerebrospinal fluid (CSF) in early Aβ development. A population-based sample of participants (n = 505) with PET and CSF tests was used. Cortical regions showing early Aβ on Aβ PET were also used in these analyses. Neuropathology was used to validate detection of Aβ by Aβ PET and Aβ CSF biomarkers.

Keywords: Alzheimer's disease; Pittsburgh compound B; amyloid beta; autopsy; cerebrospinal fluid; neuropathology; positron emission tomography.


Conflict of interest statement

Val J. Lowe serves as a consultant for Bayer Schering Pharma, Piramal Life Sciences, Life Molecular Imaging, Eisai Inc., AVID Radiopharmaceuticals, Eli Lilly and Company, PeerView Institute for Medical Education, and Merck Research and receives research support from GE Healthcare, Siemens Molecular Imaging, AVID Radiopharmaceuticals, and the NIH (NIA, NCI). Carly T. Mester, Emily S. Lundt, Jeyeon Lee, Sujala Ghatamaneni, Alicia Algeciras‐Schimnich, Michelle R. Campbell, Aivi Nguyen, Hoon‐Ki Min, Mary M. Machulda, Christopher G. Schwarz, Prashanthi Vemuri, Dennis W. Dickson, Karunya K. Kandimalla, Kejal Kantarci, and David T. Jones report no disclosures relevant to the manuscript. Melissa E. Murray served as a consultant for AVID Radiopharmaceuticals, received grant funding from Eli Lilly and Company and the Rainwater Charitable Foundation, and is supported by the NIH (NIA). Jonathan Graff‐Radford serves on the editorial board for Neurology and receives research support from the NIH. Bradley Boeve receives honoraria for SAB activities for the Tau Consortium; is a site investigator for clinical trials sponsored by Alector, Cognition Therapeutics, EIP Pharma, and Transposon; and receives research support from the NIH. David Knopman serves on a data safety monitoring board for the DIAN study; has served on a data safety monitoring board for a tau therapeutic for Biogen but received no personal compensation; is a site investigator in Biogen aducanumab trials; is an investigator in clinical trials sponsored by Lilly Pharmaceuticals and the University of Southern California; serves as a consultant for Samus Therapeutics, Roche, Magellan Health and Alzeca Biosciences but receives no personal compensation; and receives research support from the NIH. Clifford R. Jack Jr. has consulted for Lily and serves on an independent data monitoring board for Roche and as a speaker for Eisai, but he receives no personal compensation from any commercial entity. He receives research support from the NIH and the Alexander Family Alzheimer's Disease Research Professorship of the Mayo Clinic. Ronald C. Petersen serves as a consultant for Roche, Inc., Merck, Inc., Biogen, Inc., Eisai, Inc., Genentech, Inc., and Nestle, Inc.; served on a DSMB for Genentech; receives royalties from Oxford University Press and UpToDate; and receives NIH funding. Michelle M. Mielke has consulted for or served on advisory boards for Biogen, Eisai, Lilly, Merck, Roche, Siemens Healthineers; has served on editorial boards for Neurology and Alzheimer's Research Therapy; and receives research support from the Department of Defense, National Institute of Health/National Institute on Aging, and Alzheimer's Association. Author disclosures are available in the supporting information.

Figures

FIGURE 1
FIGURE 1
Percent of early Aβ deposition participants with elevated Aβ PET SUVR by regions. A, Surface renderings of the percentage of early Aβ deposition participants (SUVR between 1.29 to 1.64; n = 1088) with elevated Aβ PET. The percentage of participants with elevated Aβ PET SUVR for each brain region is shown in the renderings for each subgroup (very low SUVR, low SUVR, low–moderate SUVR, moderate SUVR, moderate–high SUVR, and high SUVR). Maps of both the left and the right hemispheres are shown for individual subgroups. B, Brain regions with elevated PiB for the entire cohort of early Aβ deposition participants (n = 1088) are shown. For each specific brain region, the percentage of participants who had elevated Aβ PET in respective regions by side is displayed. The brain regions are sorted from low to high percentage and shown as left (red square) and right (blue triangle), and also by the pixel weighted median of the right and left hemisphere (black circle). High fusiform SUVR was the most common regional finding in the early Aβ deposition participants. Aβ, amyloid beta; PET, positron emission tomography; PiB, Pittsburgh compound B; SUVR, standardized uptake value ratio.
FIGURE 2
FIGURE 2
Plots of meta‐ROI and early‐ROI Aβ PET SUVR versus CSF p‐tau181/Aβ42. Plots of meta‐ROI and early‐ROI Aβ PET SUVR versus CSF p‐tau181/Aβ42 biomarker findings (n = 505) are shown. Vertical and horizontal lines depict respective cutpoints. The percentages of participants in each quadrant are shown in each plot. The plots show a higher percentage of Aβ PET+/CSF− participants (upper left quadrant; formed by cutpoint values) than Aβ PET−/CSF+ (lower right quadrant) for meta‐ROI Aβ PET. The Aβ PET+/CSF− percentage seen with early‐ROI Aβ PET is ≈ 10‐fold greater than that for A βPET−/CSF+ (angular and middle occipital shown) (A). In early amyloid accumulation (B), (1.34 to 1.67 SUVR, n = 256), this difference is more apparent with 20‐fold more Aβ PET+/CSF− participants than Aβ PET−/CSF+ participants. Specific regional Aβ PET cutpoints are used. Horizontal red dashed line = meta‐ROI Aβ PET SUVR cutpoint (≥ 1.48) and CSF p‐tau181/Aβ42 (0.023). Horizontal blue dashed line = early‐ROI Aβ PET SUVR cutpoint (derived from the 95th percentile of a “young normal” cohort). Angular cutpoint = 1.41 middle occipital cutpoint = 1.44. Aβ, amyloid beta; CSF, cerebrospinal fluid; PET, positron emission tomography; p‐tau, phosphorylated tau; ROI, region of interest; SUVR, standardized uptake value ratio.
FIGURE 3
FIGURE 3
Early regional Aβ PET SUVR versus CSF p‐tau/Aβ42 plots. Early regional Aβ PET SUVR versus CSF p‐tau/Aβ42 plots show a higher incidence of regional Aβ PET +/CSF− participants compared to the inverse (n = 505). Horizontal red dashed line = meta‐ROI PiB SUVR cutpoint (≥ 1.48). Horizontal blue dashed line = regional PiB SUVR cutpoint (derived from the 95th percentile of a “young normal” cohort [MCSA CU 30–49 years old, n = 157]). Angular = 1.408289, occipital = 1.485999, frontal sup = 1.484428, fusiform = 1.304292, inferior temporal = 1.295023, middle temporal = 1.395486, middle occipital = 1.443689, calcarine = 1.321242. Aβ, amyloid beta; CSF, cerebrospinal fluid; CU, cognitively unimpaired; MCSA, Mayo Clinic Study of Aging; PET, positron emission tomography; PiB, Pittsburgh compound B; p‐tau, phosphorylated tau; ROI, region of interest; SUVR, standardized uptake value ratio.
FIGURE 4
FIGURE 4
Images from participants with Aβ PET+ versus CSF− results. Selected images from participants with Aβ PET+ versus CSF− results. Row A shows examples that were meta‐ROI Aβ PET+ and early‐ROI Aβ PET+. Row B shows examples that were meta‐ROI Aβ PET− and early‐ROI Aβ PET. Red arrows show regions with positive visual findings as a loss of gray/white matter contrast, but multiple regions were positive in each meta‐ROI Aβ PET− participant although all brain regions for each participant are not shown. For example, all participants in row B (meta‐ROI Aβ PET−) were Aβ PET+ in ≥ 9 regional ROIs (numbers shown below images). ROI+, number of early‐ROI Aβ PET with SUVR values that were positive. Aβ, amyloid beta; CSF, cerebrospinal fluid; PET, positron emission tomography; ROI, region of interest; SUVR, standardized uptake value ratio.
FIGURE 5
FIGURE 5
Findings in participants with Aβ PET+ versus CSF− longitudinal and autopsy findings. Selected Aβ PET images from six participants (A–F) are shown at each time point when testing was done. Symbols represent regional Aβ PET, Meta‐ROI Aβ PET, CSF, and autopsy findings and reflect negative (white) or positive (colors) findings. Numerical definitions of each are in the supporting information (Table S3). Abnormal regional Aβ PET image findings are also identified for selected regions (red arrows), but multiple regions were positive in each participant. Note the asymmetry and focal nature of regionally positive Aβ PET. Row A shows progression of Aβ PET signal over five serial Aβ PET scans. p‐tau/Aβ42 (0.016 initial value) never became positive over three testing time points concurrent with Aβ PET while Aβ progresses. Participants in rows A and B had negative or delayed meta‐ROI Aβ PET positive findings relative to regional findings. Participants in rows B, C, and D never had positive p‐tau/Aβ42 (0.019, 0.014, 0.019 respective initial results coincident with Aβ PET) findings when testing was done before Aβ PET or at the time of Aβ PET. Row E shows a diffusely positive Aβ PET scan. p‐tau/Aβ42 findings were conflicting in row E with the most recent (0.017) being falsely negative. Regional Aβ PET progression is shown on the Aβ PET image on row F with a 6‐year delay in p‐tau/Aβ42 positive findings (0.015 value) compared to Aβ PET. A single Aβ42/40 testing point is positive in row E with Aβ PET. A data dictionary is shown in the lower right box. Aβ, amyloid beta; CSF, cerebrospinal fluid; PET, positron emission tomography; p‐tau, phosphorylated tau; ROI, region of interest; SUVR, standardized uptake value ratio.
FIGURE 6
FIGURE 6
False positive early‐ROI Aβ PET and high uptake in white matter. Aβ PET images from four false positive Aβ PET participants (G–F) by early‐ROI Aβ PET (y axis), as validated by neuropathology, are shown from each time point where testing was done. Numerical definitions of each are in the supporting information (Table S3). Symbols represent regional Aβ PET (circle), meta‐ROI Aβ PET (diamond), CSF (triangle), and autopsy findings (inverted triangle) and reflect negative (white) or positive (colors) findings. No regional loss of gray/white matter contrast was seen in any examples. The box on the bottom right shows a plot of the SUVR of all false positive and false negative participants in the study. The SUVR (first Aβ PET) of the false positive participants was numerically higher at ≈ 2.0 SUVR. The meta‐ROI was also falsely positive in two participants. Aβ, amyloid beta; CSF, cerebrospinal fluid; PET, positron emission tomography; p‐tau, phosphorylated tau; ROI, region of interest; SUVR, standardized uptake value ratio.

References

    1. Lowe VJ, Lundt ES, Albertson SM, et al. Neuroimaging correlates with neuropathologic schemes in neurodegenerative disease. Alzheimers Dement. 2019;15:927‐939. - PMC - PubMed
    1. Cho H, Choi JY, Hwang MS, et al. In vivo cortical spreading pattern of tau and amyloid in the Alzheimer disease spectrum. Ann Neurol. 2016;80:247‐258. - PubMed
    1. Grothe MJ, Barthel H, Sepulcre J, et al. In vivo staging of regional amyloid deposition. Neurology. 2017;89:2031‐2038. - PMC - PubMed
    1. Palmqvist S, Scholl M, Strandberg O, et al. Earliest accumulation of beta‐amyloid occurs within the default‐mode network and concurrently affects brain connectivity. Nat Commun. 2017;8:1214. - PMC - PubMed
    1. Mattsson N, Palmqvist S, Stomrud E, Vogel J, Hansson O. Staging beta‐amyloid pathology with amyloid positron emission tomography. JAMA Neurol. 2019;76(11):1319‐1329. - PMC - PubMed

Grants and funding