

doi: 10.1158/2767-9764.CRC-24-0274.
Functional RNAi Screening Identifies G2/M and Kinetochore Components as Modulators of TNFα/NF-κB Prosurvival Signaling in Head and Neck Squamous Cell Carcinoma
Affiliations
- PMID: 39392349
- PMCID: PMC11541648
- DOI: 10.1158/2767-9764.CRC-24-0274
Item in Clipboard
Functional RNAi Screening Identifies G2/M and Kinetochore Components as Modulators of TNFα/NF-κB Prosurvival Signaling in Head and Neck Squamous Cell Carcinoma
Cancer Res Commun.
.
Abstract
Here, RNAi library screening reveals that multiple G2/M and kinetochore components, including TTK/monopolar spindle 1, modulate TNFα-induced NF-κB activation, cell survival, and genotoxicity, underscoring their potential importance as therapeutic targets in HNSCC.
©2024 The Authors; Published by the American Association for Cancer Research.
Conflict of interest statement
A.D. Saleh reports other from miRecule, Inc. outside the submitted work. S.E. Martin reports other from Genentech outside the submitted work. C. Van Waes reports grants from NIH during the conduct of the study, as well as personal fees from miRecule, Inc. outside the submitted work. No disclosures were reported by the other authors.
Figures
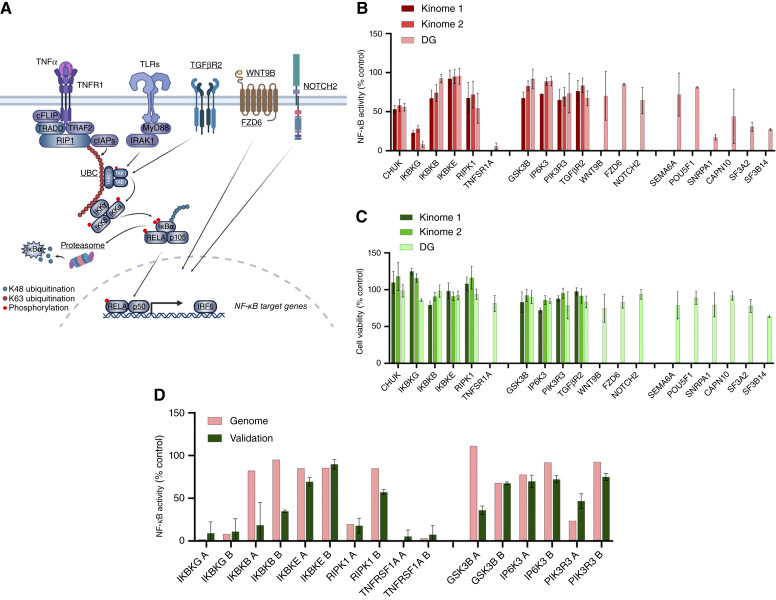
RNAi screening identifies G2/M kinases and kinetochore components as modulators of TNFα-induced NF-κB reporter activity and cell viability. A, Schematic demonstrating identified canonical and noncanonical regulators of NF-κB from the RNAi screening. Identified hits are in bold and underlined. B, NF-κB reporter activity in UMSCC1κB after transfection with select siRNAs from the kinome 1, kinome 2, and DG RNAi screens. Canonical and noncanonical hits are shown. NF-κB activity is shown as a percentage of a negative control siRNA (set at 100%). C, Cell viability in UMSCC1κB after transfection with select siRNAs from the kinome 1, kinome 2, and DG RNAi screens. Canonical and noncanonical hits are shown. Cell viability is shown as a percentage of a negative control siRNA (set at 100%). D, Validation of NF-κB reporter activity in UMSCC1κB comparing primary and secondary screen with three independent siRNAs. Select siRNAs from the RNAi screen are shown compared with the DG results (Genome in figure). Canonical and noncanonical hits are shown. NF-κB activity is shown as a percentage of a negative control (set at 100%). Each RNAi screen contained three individual siRNA targeting each gene. Validation siRNA experiments used separate siRNAs not used in the RNAi screens. (A, Created with BioRender.com .)
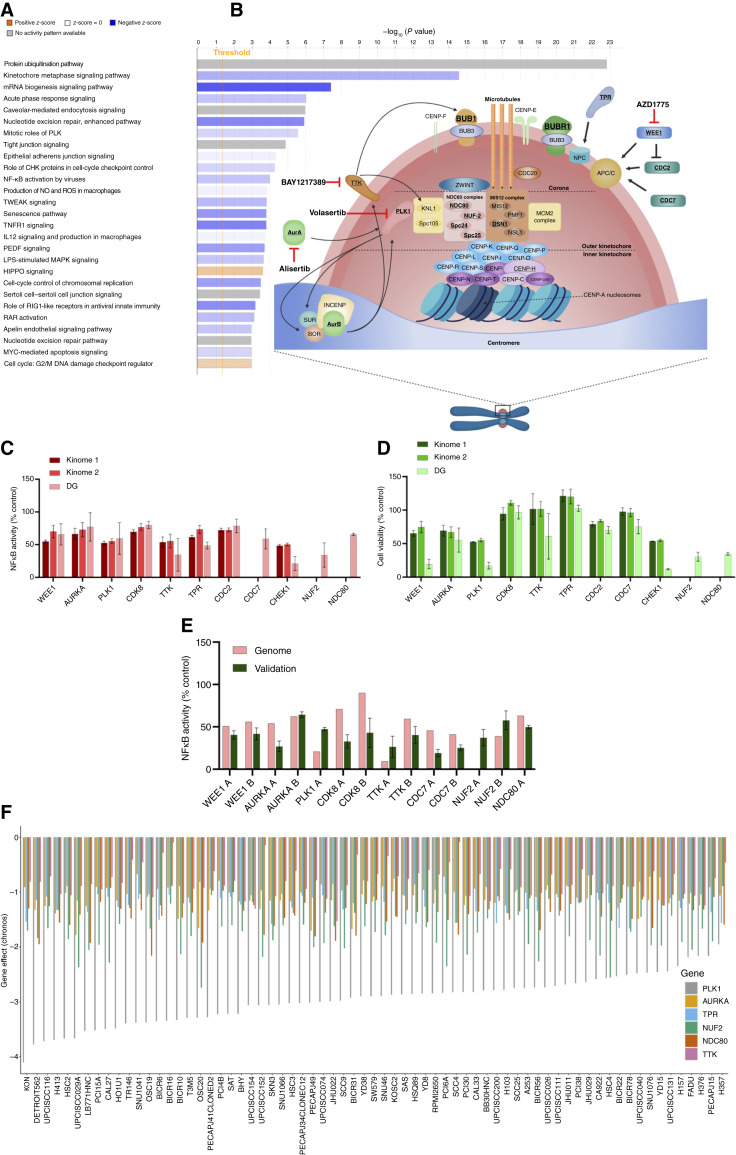
Identification of G2/M checkpoint and kinetochore components as modulators of TNF-induced NF-κB activity in HNSCC cells. A, IPA was performed using data for the 769 candidates for which depletion significantly modulating NF-κB activity and ranked as < −2 LogP reporter seed corrected by CSA (Supplementary Table S2). B, Schematic demonstrating identified G2/M checkpoint kinases and kinetochore components significantly modulating NF-κB activity in UMSCC1κB cells. Identified hits are in bold and underlined. C, NF-κB reporter activity in UMSCC1κB after transfection with select siRNAs from the kinome 1, kinome 2, and DG RNAi screens. NF-κB activity is shown as a percentage of a negative control siRNA (set at 100%). D, Cell viability in UMSCC1κB after transfection with select siRNAs from the kinome 1, kinome 2, and DG RNAi screens. Cell viability is shown as a percentage of a negative control siRNA (set at 100%). E, Validation of NF-κB reporter activity in UMSCC1κB after transfection with independent siRNAs. Select siRNAs from the secondary RNAi screen are shown compared with the DG results (genome in figure). NF-κB activity is shown as a percentage of a negative control (set at 100%). Each RNAi screen contained three individual siRNA targeting each gene. Validation siRNA experiments used separate siRNAs not used in the RNAi screens. F, Chronos-inferred gene dependency scores for PLK1, AURKA, NUF2, NDC80, and TTK in 69 head and neck cancer cell lines in the CRISPR knockout screens from Broad’s Achilles and Sanger’s Score projects. The order is based on the gene effect of PLK1 [most dependent cell line (lowest value) to least dependent cell line (highest value); B, created with BioRender.com .]
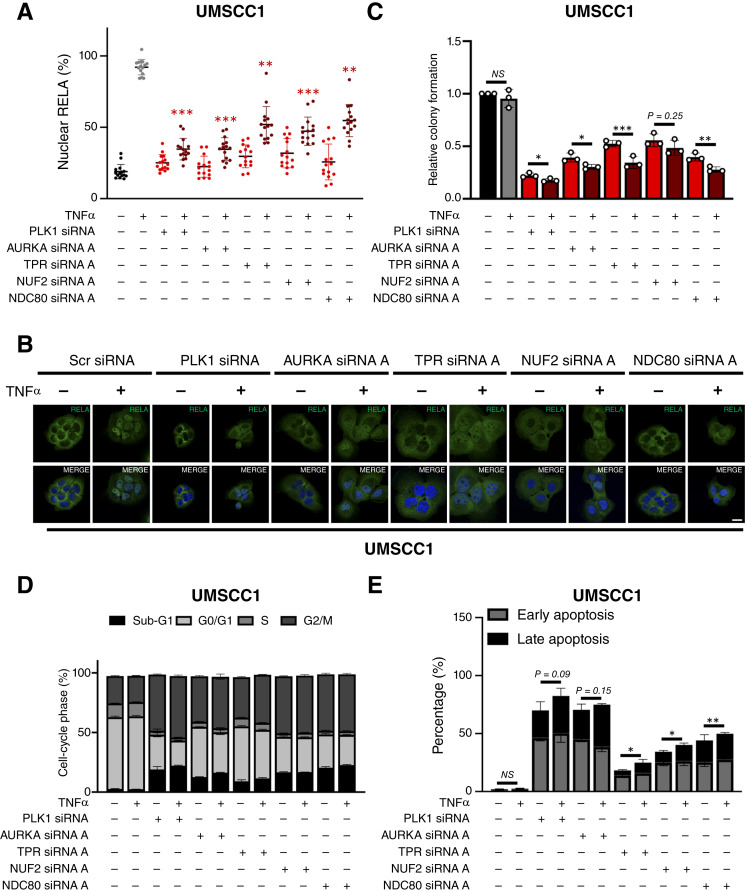
Knockdown of G2/M kinases and kinetochore proteins inhibits NF-κB activity and sensitizes HNSCC cells to TNF-induced cell death. A, Quantification of percentage nuclear RELA in UMSCC1 cells transfected with siRNA targeting PLK1, AURKA, TPR, NUF2, and NDC80 for 72 hours, with TNFα (20 ng/mL) added for the final 30 minutes. DAPI (4′, 6-diamidino-2-phenylindole) was used as a nuclear counterstain. Scale bar, 10 μmol/L. Data represent the percentage nuclear localization of RELA from 15 cells and were analyzed using ImageJ as previously (12). B, Representative immunofluorescence images of the data in A. C, Colony formation assay of UMSCC1 cells transfected with siRNA targeting PLK1, AURKA, TPR, NUF2, and NDC80 for 72 hours, with TNFα (20 ng/mL) added for the final 24 hours. DAPI was used as a nuclear counterstain. D, Cell-cycle analysis of UMSCC1 cells transfected with siRNA targeting PLK1, AURKA, TPR, NUF2, and NDC80 for 72 hours, with TNFα (20 ng/mL) added for the final 24 hours. Statistics are shown in Supplementary Table S5. E, Annexin V analysis of UMSCC1 cells were transfected with siRNA targeting PLK1, AURKA, TPR, NUF2, and NDC80 for 72 hours, with TNFα (20 ng/mL) added for the final 24 hours. Bars represent the means ± SD. All experiments are representative of at least three biological replicates. NS, not significant; *, P < 0.05; **, P < 0.01; ***, P < 0.001.

TTK inhibition reduces NF-κB RELA nuclear localization and activity in HNSCC cells. A, Representative immunofluorescence images of RELA localization in UMSCC1 and UMSCC47 cells. Cells were transfected with TTK siRNA or control siRNA for 72 hours, with TNFα (20 ng/mL) added for 30 minutes. DAPI was used as a nuclear counterstain. B, Quantification of percentage nuclear RELA from A. Data represent the percentage nuclear localization of RELA from 15 cells and were analyzed using ImageJ as previously (12). Bars represent means ± SD. C, UMSCC1 and UMSCC47 cells were treated with 20 nmol/L BAY1217389 (B389) for 24 hours. Cells were then analyzed for the percentage of phosphorylated histone H3 (Ser10), a marker of mitosis. D, NF-κB reporter activity after treatment with increasing doses of B389 in UMSCC1κB cells. Cells were treated with increasing doses of B389 or vehicle control for 24 hours, with TNFα (20 ng/mL) added for the final 16 hours. E, Representative immunofluorescence images of RELA localization in UMSCC1 and UMSCC47 cells. Cells were treated with B389 (20 nmol/L) or vehicle control for 6 hours, with TNFα (20 ng/mL) added for 30 minutes. DAPI was used as a nuclear counterstain. F, Quantification of percentage nuclear RELA from E. Data represent the percentage nuclear localization of RELA from 15 cells and were analyzed using ImageJ as previously (12). All experiments are representative of at least three biological replicates. NS, not significant; ***, P < 0.001.
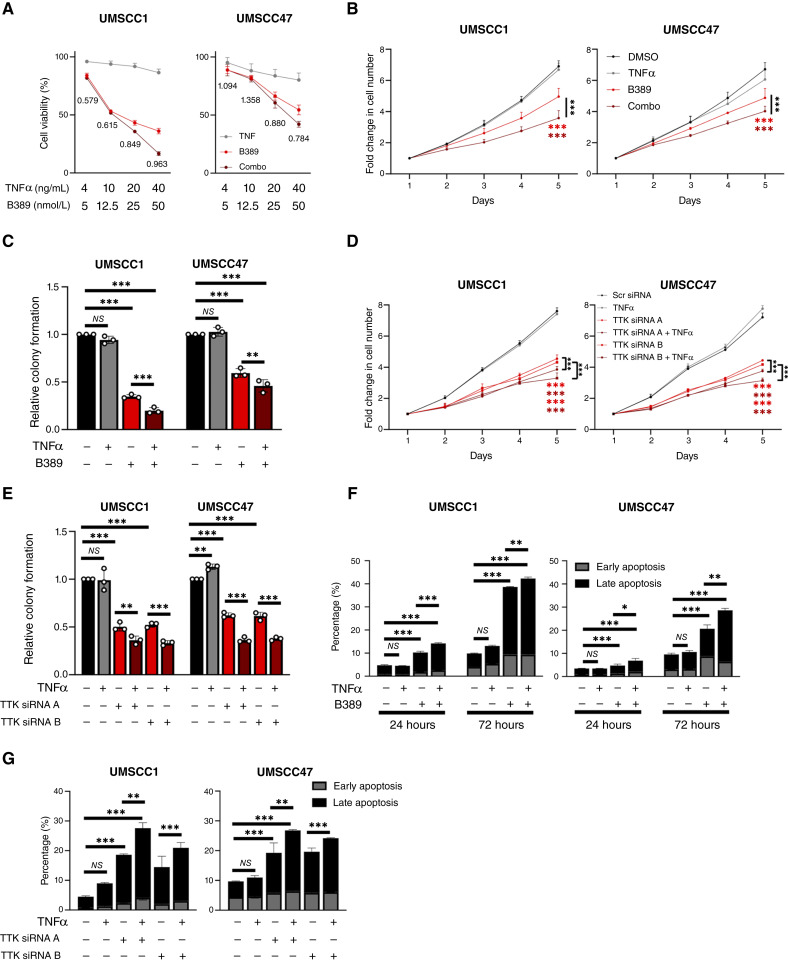
TTK activity promotes TNF resistance in HNSCC cells. A, XTT cell viability analysis of UMSCC1 and UMSCC47 cells after treatment with varying doses of B389 and/or TNFα for 48 hours. Values below the combination are CIs as described in the text. B, Cell growth analysis of UMSCC1 and UMSCC47 cells after treatment with TNFα (20 ng/mL), B389 (20 nmol/L), or the combination for 24 hours. C, Colony formation assay of UMSCC1 and UMSCC47 cells after treatment with TNFα (20 ng/mL), B389 (20 nmol/L), or the combination for 24 hours. D, Cell growth analysis of UMSCC1 and UMSCC47 cells after transfection of two specific TTK siRNAs for 72 hours, with or without TNFα addition for the final 24 hours. E, Colony formation assay of UMSCC1 and UMSCC47 cells after transfection of two specific TTK siRNAs for 72 hours, with or without TNFα addition for the final 24 hours. F, Annexin V analysis of UMSCC1 and UMSCC47 cells after treatment with TNFα (20 ng/mL), B389 (20 nmol/L), or the combination for 24 and 72 hours. G, Annexin V analysis of UMSCC1 and UMSCC47 cells after transfection of two specific TTK siRNAs for 72 hours, with or without TNFα addition for the final 24 hours. Bars represent means ± SD. All experiments are representative of at least three biological replicates. NS, not significant; *, P < 0.05; **, P < 0.01; ***P < 0.001.
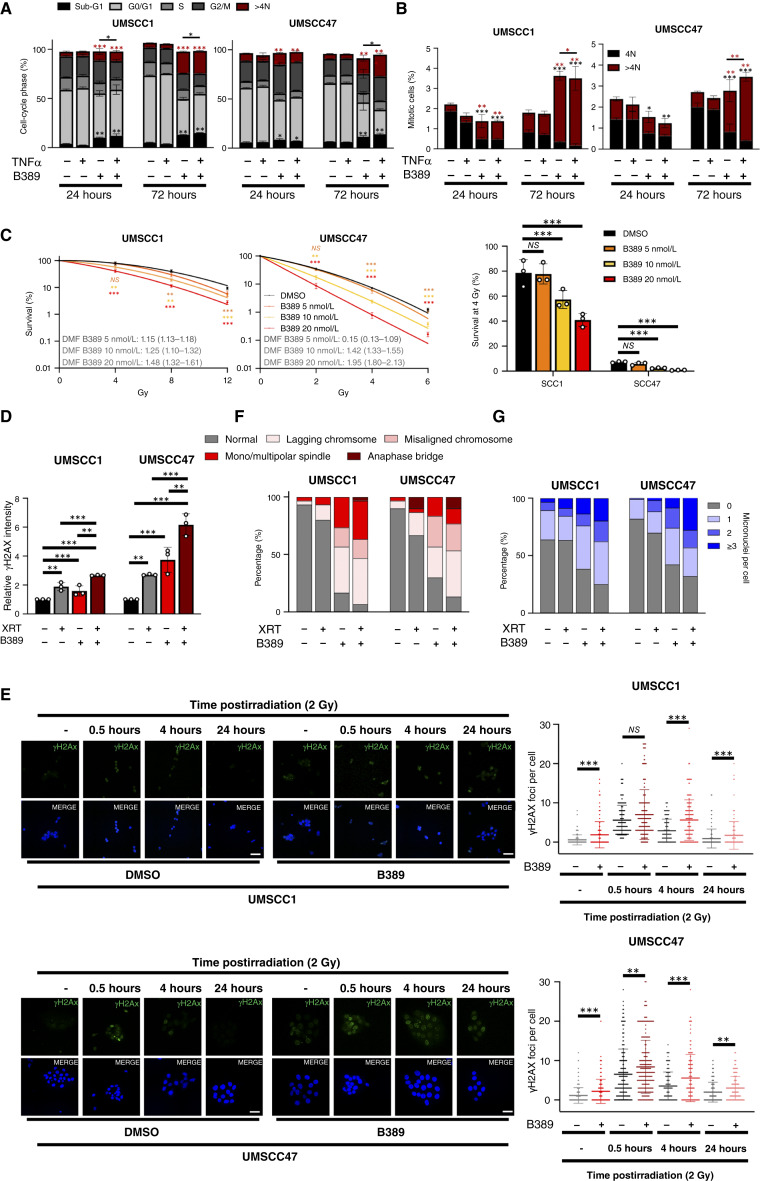
TTK inhibition induces mitotic abnormalities and genome instability in combination with radiation treatment. A, Cell-cycle analysis of UMSCC1 and UMSCC47 cells were treated with 20 nmol/L B389 for 24 and 72 hours. Red asterisks indicate a significant difference in the >4N population compared with control; black asterisks indicate a significant difference in the sub-G1 population compared with control. Bars indicate a significant difference in the sub-G1 population between B389 and the combination treatment. Statistics are shown in Supplementary Table S5. B, UMSCC1 and UMSCC47 cells were treated with 20 nmol/L B389 for 24 and 72 hours. Cells were then analyzed for the percentage of phosphorylated histone H3 (Ser10), a marker of mitosis, and their DNA content using PI. Red asterisks indicate a significant difference in the >4N population compared with control; black asterisks indicate a significant difference in the sub-G1 population compared with control. Bars indicate a significant difference in the >4N population between B389 and the combination treatment. Statistics are shown in Supplementary Table S5. C, left, Clonogenic survival assays of UMSCC1 and UMSCC47 treated with B389 at the indicated doses for 2 hours before irradiation. Cells were then immediately harvested and replated after irradiation. Right, Survival fraction at 4 Gy from each cell line. DMF values were calculated as the vehicle radiation dose for 10% survival divided by radiation dose for 10% survival with the indicated treatment. D, UMSCC1 and UMSCC47 cells were treated with B389 (20 nmol/L) for 2 hours before irradiation. Cells were then analyzed for γH2AX expression by flow cytometry after 24 hours. For nonirradiated samples, cells were treated with vehicle or B389 (20 nmol/L) for 24 hours before analysis. Data are presented as the relative MFI compared with the nonirradiated control samples. E, left, Representative immunofluorescence images of γH2AX foci in UMSCC1 and UMSCC47 cells after treatment with B389 (20 nmol/L) and/or radiation. Cells were treated with B389 (20 nmol/L) for 2 hours before irradiation. Cells were then analyzed for γH2AX foci by immunofluorescence analysis at the indicated time points. For nonirradiated samples, cells were treated with vehicle or B389 (20 nmol/L) for 24 hours before analysis. DAPI was used as a nuclear counterstain. Scale bar, 10 μmol/L (right). Quantification of γH2AX foci. For each condition, foci from at least 200 cells were counted. F, Cells were treated as in D. After 24 hours, mitotic cells were analyzed by confocal microscopy for the appearance of mitotic aberrations. Cells were probed for phosphorylated histone H3 (Ser10) and α-tubulin, and DAPI was used as a nuclear counterstain. The percentage of each type of mitotic aberrations is presented from at least 30 individual cells from duplicate experiments. G, Cells were treated as in D. After 24 hours, cells were analyzed by confocal microscopy for the appearance of micronuclei using DAPI as a nuclear counterstain. The percentage of cells with 0, 1, 2, or ≥3 associated micronuclei is presented at least 200 individual cells from duplicate experiments. Bars represent means ± SD. All experiments are representative of at least three biological replicates, except (F and G), which are from duplicate experiments. *, P < 0.05; **, P < 0.01; ***, P < 0.001. NS, not significant; MFI, median fluorescence intensity; propidium iodide; DMF, dose modification factor, XRT, X-ray therapy.
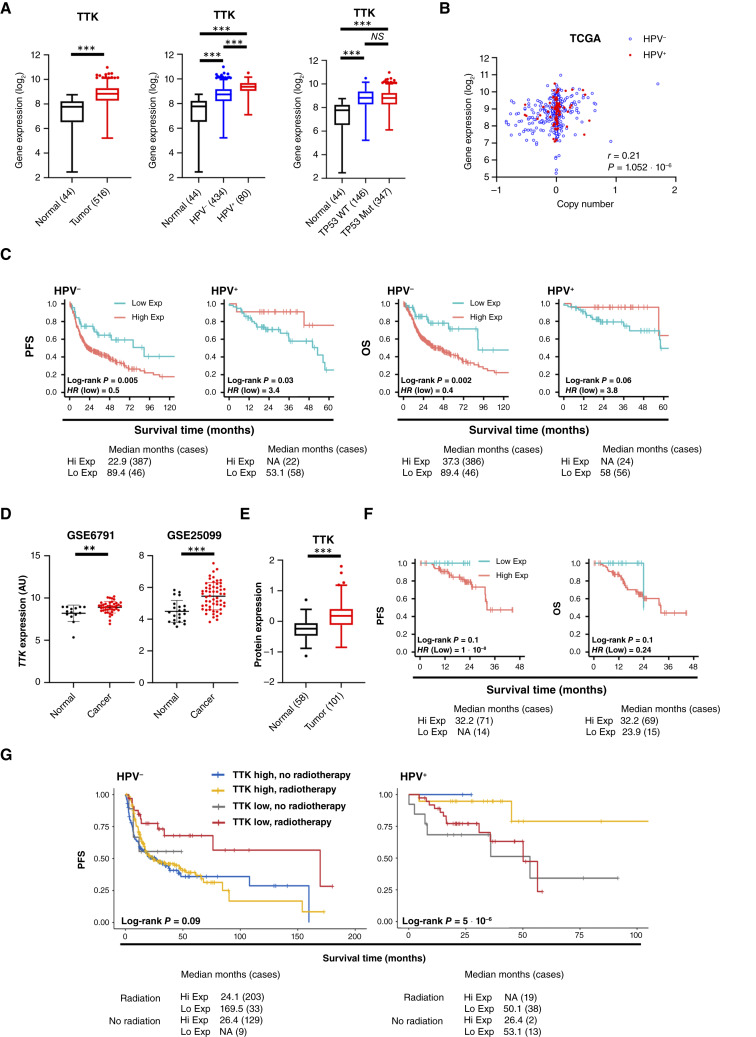
High TTK expression correlates with survival in HNSCC. A, Box plot analysis of TTK mRNA expression in normal (n = 44) and HNSCC (n = 516) tissue, in normal (n = 44), HPV− HNSCC (n = 434) and HPV + HNSCC (n = 80) tissue and in normal (n = 44), WT TP53 HNSCCs (n = 167), and mtTP53 HNSCCs (n = 347) tissue from TCGA HNSCC database. B, Correlation of gene copy number with mRNA expression in HNSCC based on HPV status. CNVs were presented on the X axis, as one-copy loss (−1), diploid (0), one-copy gain (0.58), and amplification (larger than 1). mRNA expression calculated by RSEM is presented in the y axis as the log2 scale. Pearson correlation tests were conducted for 508 HNSCC tumor specimens, including 428 HPV− (blue circles) and 80 HPV(+) samples (red triangles). P values give the significance of the Pearson correlation between mRNA expression and CNV. R values represent Pearson correlation coefficients. C, PFS and OS analysis of TCGA HNSCC data based on TTK expression, separated by HPV status. Survival data were plotted using the Kaplan–Meier survival curve. Red indicates high expression, and cyan indicates low expression. P values were determined using the log-rank test. Plots were truncated at 10 years for HPV− patients and 5 years for HPV+ patients, but the analyses were conducted using all data. D, Scatter dot plot of TTK mRNA expression in normal and HNSCC tissue from the GEO database entries GSE6791 (normal n = 14, HNSCC n = 42) and GSE25099 (normal n = 22, HNSCC n = 57). E, Box plot analysis of TTK protein expression in normal (n = 58) and HNSCC (n = 101, all HPV−) tissue from the CPTAC dataset. F, PFS and OS analysis of CPTAC HNSCC data based on TTK protein expression. Survival data were plotted using the Kaplan–Meier survival curve from 85 HPV− HNSCCs cases that had survival data. Red indicates high expression, and cyan indicates low expression. P values were determined using the log-rank test. G, PFS analysis of TCGA HNSCC data based on TTK expression and if patients were treated with radiotherapy or not, separated by HPV status. Survival data were plotted using the Kaplan–Meier survival curve. Blue indicates high expression with no radiotherapy, gold indicates high expression with radiotherapy, gray indicates low expression with no radiotherapy, and red indicates low expression with radiotherapy. From the TCGA data, 59 HPV− and 8 HPV+ cases had no radiotherapy record, so they were excluded from the analysis. P values were determined using the log-rank test. *, P < 0.05; **, P < 0.01; ***, P < 0.001 (Student t test). NS, not significant; CNV, copy number variations; GEO, Gene Expression Omnibus; WT, wildtype.
References
-
- Kim HJ, Hawke N, Baldwin AS. NF-kappaB and IKK as therapeutic targets in cancer. Cell Death Differ 2006;13:738–47. - PubMed
-
- Allen CT, Ricker JL, Chen Z, Van Waes C. Role of activated nuclear factor-kappaB in the pathogenesis and therapy of squamous cell carcinoma of the head and neck. Head Neck 2007;29:959–71. - PubMed
Publication types
MeSH terms
Substances
Grants and funding
LinkOut - more resources
Full Text Sources
Medical
