. 2024 Dec;11(45):e2403995.
doi: 10.1002/advs.202403995. Epub 2024 Oct 11.

Deubiquitylase USP52 Promotes Bladder Cancer Progression by Modulating Ferroptosis through Stabilizing SLC7A11/xCT

Affiliations

Deubiquitylase USP52 Promotes Bladder Cancer Progression by Modulating Ferroptosis through Stabilizing SLC7A11/xCT

Jianmin Liu et al. Adv Sci (Weinh). 2024 Dec.

Abstract

Bladder cancer (BLCA) is a prevalent cancer with high case-fatality rates and a substantial economic burden worldwide. Understanding its molecular underpinnings to guide clinical management is crucial. Ferroptosis, a recently described non-apoptotic form of cell death, is initiated by the lethal accumulation of iron-dependent lipid peroxidation products. Despite growing interest, the roles and vulnerabilities determining ferroptosis sensitivity in BLCA remain unclear. Re-analysis of single-cell RNA data reveals a decrease in high-ferroptosis cancer cells as BLCA advances. USP52/PAN2 is identified as a key regulator of ferroptosis in BLCA through an unbiased siRNA screen targeting 96 deubiquitylases (DUBs). Functionally, USP52 depletion impedes glutathione (GSH) synthesis by promoting xCT protein degradation, increasing lipid peroxidation and ferroptosis susceptibility, thus suppressing BLCA progression. Mechanistically, USP52 interacts with xCT and enzymatically cleaves the K48-conjugated ubiquitin chains at K4 and K12, enhancing its protein stability. Clinical BLCA samples demonstrate a positive correlation between USP52 and xCT expression, with high USP52 levels associated with aggressive disease progression and poor prognosis. In vivo, USP52 depletion combined with ferroptosis triggers imidazole ketone Erastin (IKE) synergistically restrains BLCA progression by inducing ferroptosis. These findings elucidate the role of the USP52-xCT axis in BLCA and highlight the therapeutic potential of targeting USP52 and ferroptosis inducers in BLCA.

Keywords: SLC7A11/xCT; USP52; bladder cancer; deubiquitylases; ferroptosis.


Conflict of interest statement

The authors declare no conflict of interest.

Figures

Figure 1
Figure 1
Systematic RNAi screening identified USP52 as a key regulator of ferroptosis and xCT translational activity in bladder cancer. A) UMAP projection of scRNA‐seq data from bladder tissues. All epithelial cells, cells in a high ferroptosis state, and cells in a low ferroptosis state are shown. B) The frequency of cells in high and low ferroptosis states across BLCA clinical T‐stages including T0 (indicated healthy organ donor), Ta, T1, T2, T3, and T4. C) Flow chart of 96 DUBs siRNAs screening. HEK293T cells were seeded and transfected with negative control siRNA or 25 nm DUBs siRNAs for 3 days in the 12‐well plates. The cells were collected for total protein extraction and subsequent Western blot analysis. This Figure was drawn by an online tool Figdraw (https://www.figdraw.com/static/index.html#/paint_index_v2). D) Statistic analysis of the relative xCT protein levels after transfection of DUBs siRNAs library via Western blotting with GAPDH as a normalization control. The intensity of each band was quantified by densitometry with ImageJ software. OTUB1, USP52, and 8 other DUBs were among the top 10 hits, the inhibition of which markedly suppressed xCT protein expression. E) T24 bladder cancer cells were transfected with 25 nm siRNAs targeting the top 10 candidate DUBs for 24 h, treated with or without 2 µm Erastin for 48 h, and finally subjected to an MTT assay. F) Control or USP52‐specific siRNAs were transfected into T24 cells for 48 h in the 6‐well plates. Then, seeded ≈5000 transfected cells per well on the 96‐well plates for 24 h, followed by an assessment of the relative GSH level with a microplate reader. G) Control or USP52‐specific siRNAs were transfected into T24 cells for 48 h in the 6‐well plates. Then, collected cells and assessed the relative ferrous iron level with a microplate reader. H) USP52‐silenced T24 cells were treated with or without 2 µm Erastin (Era) for 48 h, followed by collection and fixation, and finally subject to observation by transmission electron microscopy. The ultrastructure of the mitochondria was captured. Scale bars: 10 µm. The data are presented as the means ± SDs, with n = 3 (E, G) or 6 (F) independent repeats. Statistical significance was determined by one‐way ANOVA with Tukey's multiple comparisons (F, G).
Figure 2
Figure 2
USP52 depletion promotes ferroptosis in bladder cancer cells. A) Flow chart of the RNA‐seq and GC‐MS metabolomic analyses. We transfected T24 cells with siNC and siUSP52s in the 6‐well plates for 2 days. Then, a quarter of the cells were performed RNA‐seq, and the remaining three quarters were conducted for GC‐MS metabolomic analyses. This Figure was drawn by an online tool Figdraw (https://www.figdraw.com/static/index.html#/paint_index_v2). B) Heatmap of significantly different metabolites in T24 cells between the siNC and siUSP52 groups. Metabolites associated with ferroptosis were labeled with red. C) Top 12 enriched pathways from integrated pathway analysis of significantly changed metabolites. Biosynthesis of unsaturated fatty acids, Glutathione metabolism, and Ferroptosis were showed in red. D) Heatmap of DEGs associated with ferroptosis in T24 cells between the siNC and siUSP52 groups. E) qRT‐PCR analysis of DEGs associated with ferroptosis identified by RNA‐seq in USP52‐silenced T24 cells. F) BLCA cells were transfected with siRNAs or plasmids for 24 h. Then, 5000 transfected cells per well were seeded in the 96‐well plates for 24 h and treated with different concentrations of Era for 48 h. Cell viability of USP52‐knockdown (row 1) and USP52‐overexpressing cells (row 2) following treatment with different concentrations of Era were measured via MTT assay. G) T24 cells were transfected with indicated siRNAs (siNC or siUSP52s) for 24 h. Then, 5000 transfected cells per well were seeded in the 96‐well plates for 24 h and treated with 2 µm Era alone or in combination with 2 µm Ferrostatin‐1 (Fer‐1), 5 µm Z‐VAD, or 5 mm 3‐MA for 48 h. Cell viability of indicated groups was measured via MTT assay, and the absorbance was normalized to the Era‐ group. H) 5637 cells were transfected with indicated siRNAs (siNC or siUSP52s) for 24 h. Then, 5000 transfected cells per well were seeded in the 96‐well plates for 24 h and treated with 2 µm Era alone or in combination with 2 µm Fer‐1 for 48 h. Cell viability of indicated groups was measured via MTT assay, and the absorbance was normalized to the Era‐ group. I) Representative phase‐contrast images of USP52‐knockdown cells treated with 2 µm Era alone or in combination with 2 µm Fer‐1 for 48 h. Scale bar: 50 µm. J) T24 cells were transfected with indicated siRNAs (siNC or siUSP52s) for 24 h and treated with 2 µm Era alone or in combination with 2 µm Fer‐1 for 48 h. Then, collected and stained cells with pyridine iodide (PI) staining solution. Cell death rates (PI‐positive cells) were calculated via a flow cytometer. K) USP52‐depleted T24 cells were transfected with vector or USP52 plasmids for 24 h. Then, 5000 transfected cells per well were seeded in the 96‐well plates for 24 h and treated with 2 µm Era alone or in combination with 2 µm Fer‐1 for 48 h. Cell viability of indicated groups was measured via MTT assay, and the absorbance was normalized to the Era‐ group. L) T24 cells were transfected with indicated siRNAs (siNC or siUSP52s) for 24 h and treated with 2 µm Era for 24 h. Then, collected and stained cells with a BODIPY‐C11 probe. Lipid peroxidation was assessed by flow cytometry. M) T24 cells were transfected with vector or USP52 plasmids for 24 h and treated with 2 µm Era for 24 h. Then, collected and stained cells with a BODIPY‐C11 probe. Lipid peroxidation was assessed by flow cytometry. The data are presented as the means ± SDs, with = 3 (B,D,E,J,L,M) or 4 (F–H,K) independent repeats. Statistical significance was determined by two‐tailed unpaired Student's t‐test (E) and one‐way ANOVA with Tukey's multiple comparisons (G,H,J–M).
Figure 3
Figure 3
USP52 promotes cell proliferation in bladder cancer cells. A,F,H) BLCA cells were transfected with indicated siRNAs or plasmids for 48 h. Then, 2000 transfected cells per well were seeded in the 96‐well plates, followed by an assessment of cell viability with MTT assay for five consecutive days. Cell proliferation curves of the indicated cells with USP52 knockdown (A) or overexpression (F,H) were showed. B,G,I) BLCA cells were transfected with indicated siRNAs or plasmids for 48 h. Then, 1000 transfected cells per well were seeded and cultured in the 6‐well plates for 9–12 days, followed by fixation, staining, and photograph. Representative images (left panel) and statistical graph (right panel) of colony formation assays from the indicated groups with USP52 knockdown (B) or USP52 overexpression G,I) were showed. Scale bar: 1 cm. C,D) BLCA cells were transfected with indicated siRNAs for 48 h in the 6‐well plates covered with a cover glass. Then, transfected cells were fixed and stained with an EdU staining kit. Images of EdU‐positive cells were captured with a confocal microscope. Representative images (left panel) and statistical graphs (right panel) of EdU staining assays from the indicated groups of UM‐UC‐3 (C) and T24 (D) cells with USP52 knockdown were showed. Blue indicated nuclear staining and green indicated EdU‐positive cells. EdU‐positive rates were calculated by dividing the number of EdU‐positive cells by the number of cells stained with nuclear. Scale bar: 100 µm. E) USP52‐depleted T24 cells were transfected with vector or USP52 plasmids for 48 h. Then, 1000 transfected cells per well were seeded and cultured in the 6‐well plates for 9–12 days, followed by fixation, staining, and photograph. Representative images (left panel) and statistical graph (right panel) of colony formation assays showing USP52‐depleted cells with or without USP52 re‐expression. Scale bar: 1 cm. The data are presented as the means ± SDs, with n = 3 (B‐E, G, I) or 5 (A,F,H) independent repeats. Statistical significance was determined by two‐tailed unpaired Student's t‐test (F–I) or one‐way ANOVA with Tukey's multiple comparisons (A–E).
Figure 4
Figure 4
Depletion of USP52 inhibits bladder cancer progression by decreasing xCT and promoting ferroptosis. A) T24 cells were transfected with indicated siRNAs (siNC and siUSP52) for 24 h, followed by transfection with a vector of Flag‐xCT plasmids for 48 h. Four groups in this Figure were indicated as 1, 2, 3, and 4. Cells were collected and lysed for total protein extraction. Western blot assays showing the expression of USP52 and xCT in USP52‐silenced T24 cells with or without xCT re‐expression. B) About 2000 transfected cells per well were seeded in the 96‐well plates, followed by an assessment of cell viability with MTT assay for five consecutive days. Cell proliferation curves of USP52‐silenced T24 cells with or without xCT re‐expression were showed. C) About 1000 transfected cells per well were seeded and cultured in the 6‐well plates for 9–12 days, followed by fixation, staining, and photograph. Representative images (left panel) and statistical graph (right panel) of colony formation assays of USP52‐silenced T24 cells with or without xCT re‐expression were showed. D) Transfected T24 cells were fixed and stained with an EdU staining kit. Images of EdU‐positive cells captured by a confocal microscope in USP52‐silenced cells with or without xCT re‐expression were showed. Blue indicated nuclear staining and green indicated EdU‐positive cells. E) About 5000 transfected T24 cells per well were seeded in the 96‐well plates for 24 h and treated with 2 µm Era alone or in combination with 2 µm Fer‐1 for 48 h. Cell viability of indicated groups were measured via MTT assay, and the absorbance was normalized to the Era‐ group. F,G) Transfected T24 cells were treated with 2 µm Era for 24 h. Then, collected and stained cells with a BODIPY‐C11 probe. Lipid peroxidation was assessed by flow cytometry. Representative data (F) and statistical graph (G) of lipid ROS in T24 cells with indicated groups were showed. H) Representative phase‐contrast images of transfected T24 cells treated with 2 µm Era alone or in combination with 2 µm Fer‐1 for 48 h. I) Transfected T24 cells were treated with 2 µm Era alone or in combination with 2 µm Fer‐1 for 48 h. Then, collected and stained cells with pyridine iodide (PI) staining solution. Cell death rates (PI‐positive cells) were calculated via a flow cytometer. Scale bars: 1 cm (C), 100 µm (D) and 50 µm (H). The data are presented as the means ± SDs, with n = 3 (C,G,I) or 4 (E) or 5 (B) independent repeats. Statistical significance was determined by one‐way ANOVA with Tukey's multiple comparisons (B,C,E,G,I).
Figure 5
Figure 5
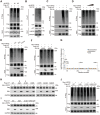
USP52 interacts with xCT and maintains its protein stability. A) HEK293T cells were transfected with indicated plasmids for 48 h. Western blot analysis of Myc‐USP52 and Flag‐xCT after Myc‐IP or Flag‐IP in HEK293T cells were showed. The input was 10% of the extract used for the IP. B) Western blot analysis of USP52 and xCT after USP52‐IP or IgG‐IP in 5637 and T24 cells. The input was 10% of the extract used for the IP. C) Confocal microscopy images of immunofluorescence staining of USP52 (red) and xCT (green) in T24 cells. The white arrow indicated the colocalization of USP52 and xCT in the cell membrane. Scale bar: 10 µm. D) Schematic diagram of various xCT truncations in the Co‐IP assays (top panel). HEK293T cells were transfected with indicated plasmids for 48 h. Western blot analysis of Myc‐USP52 and Flag‐xCT after Flag‐IP in HEK293T cells (bottom panel). *: indicated IgG heavy chain. E) Schematic diagram of various USP52 truncations in the Co‐IP assays (top panel). HEK293T cells were transfected with indicated plasmids for 48 h. Western blot analysis of Myc‐USP52 and Flag‐xCT after Myc‐IP in HEK293T cells (bottom panel). *: indicated IgG heavy chain. F) T24 cells were transfected with indicated siRNAs or plasmids for 48 h, followed by a collection for qRT‐PCR assay. The relative mRNA levels of USP52 and xCT in USP52‐silenced or USP52‐overexpressing T24 cells were showed. G) T24 cells were transfected with indicated siRNAs or plasmids for 48 h, followed by a collection for Western blot assay. The protein levels of ferroptosis‐related proteins in T24 cells with USP52 knockdown or USP52 overexpression were showed. H) USP52‐depleted T24 cells were transfected with vector or USP52 plasmids for 48 h, followed by a collection for Western blot assay. The protein levels of USP52 and xCT in USP52‐depleted T24 cells with or without USP52 re‐expression were showed. I) HEK293T cells were transfected with Flag‐xCT (1 µg) alone or in combination with increasing amounts of Myc‐USP52 (1, 3 µg) for 48 h, followed by a collection for Western blot assay. The protein levels of Myc‐USP52 and Flag‐xCT were showed. J) T24 cells were transfected with indicated siRNAs (siNC and siUSP52s) for 48 h, followed by treatment with 10 µm 6 h before collection. Western blot analysis of USP52 and xCT in USP52‐silenced T24 cells with or without 10 µm MG132 treatment were showed. K) HEK293T cells were transfected with Flag‐xCT alone or in combination with and Myc‐USP52‐WT, Myc‐USP52‐2CA, and Myc‐USP52‐ΔUCH plasmids for 48 h, followed by a collection for Western blot assay. The protein levels of Myc‐USP52 and Flag‐xCT in the indicated groups were showed. L) 5637 cells were transfected with indicated siRNAs (siNC and siUSP52) for 48 h and treated with 50 µg mL−1 CHX as indicated hours, followed by collection for Western blot assay. Representative Western blot images showing the effect of USP52 knockdown on xCT degradation in 5637 cells (left panel) and a statistical diagram of the results of the protein half‐life assays (right panel). The data are presented as the means ± SDs, with n = 3 (F,L) independent repeats. Statistical significance was determined by one‐way ANOVA with Tukey's multiple comparisons (F).
Figure 6
Figure 6
USP52 deubiquitinates xCT at K4 and K12. A) HEK293T cells were transfected with Flag‐xCT and HA‐Ub together with control siRNA or USP52 siRNA as indicated for 72 h and then treated with 10 µm MG132 for 6 h. Cellular extracts were prepared for IP assays after Flag‐IP followed by immunoblotting with anti‐HA. B) T24 cells were transfected with control siRNA or USP52 siRNA for 48 h and then incubated with 10 µm MG132 for 6 h. IP assays were performed to measure the level of the ubiquitin conjugates of xCT after xCT‐IP, followed by immunoblotting with an anti‐ubiquitin antibody. *: indicated IgG heavy chain. C) HEK293T cells were transfected with the described plasmids as indicated for 48 h and then treated with 10 µm MG132 for 6 h. Cellular extracts were prepared for IP assays after Flag‐IP followed by immunoblotting with anti‐HA. D) HEK293T cells were transfected with Flag‐xCT and HA‐Ub together with empty control or increasing amounts of Myc‐USP52 (1, 3, and 6 µg) as indicated for 48 h and then treated with 10 µm MG132 for 6 h. Cellular extracts were prepared for IP assays after Flag‐IP followed by immunoblotting with anti‐HA. E) HEK293T cells were transfected with Flag‐xCT and HA‐Ub together with empty control or Myc‐USP52 mutants as indicated for 48 h and then treated with 10 µm MG132 for 6 h. Cellular extracts were prepared for IP assays after Flag‐IP followed by immunoblotting with anti‐HA. F) HEK293T cells were transfected with Flag‐xCT and HA‐Ub (K48O or K63O) together with empty control or Myc‐USP52 as indicated for 48 h and then treated with 10 µm MG132 for 6 h. The IP assays were performed after Flag‐IP followed by immunoblotting with anti‐HA. G) Ubiquitination sites of xCT predicted by the PhosphoSitePlus database. The X‐axis represented the residue number of human xCT protein and the Y‐axis represented a total number of references. H) HEK293T cells were transfected with 2 µg wild‐type Flag‐xCT or six K‐to‐R mutants together with empty control or Myc‐USP52 for 48 h in the first round of screening, followed by collection for Western blot assay. The expression of Flag‐xCT detected with an anti‐Flag antibody was showed. I) HEK293T cells were transfected with 2 µg wild‐type Flag‐xCT, K4R, K12R, or K4R/K12R mutants together with empty control or Myc‐USP52 for 48 h in the second round of screening, followed by a collection for Western blot assay. The expression of Flag‐xCT detected with an anti‐Flag antibody were showed. J) HEK293T cells were transfected with wild‐type Flag‐xCT or different K‐to‐R mutants and HA‐Ub together with empty control or Myc‐USP52 as indicated for 48 h and then treated with 10 µm MG132 for 6 h. The IP assays were performed after Flag‐IP followed by immunoblotting with anti‐HA.
Figure 7
Figure 7
Loss of USP52 suppresses BLCA progression by promoting ferroptosis in vivo. A) Schematic diagram for evaluating the therapeutic effects of USP52 in a bladder cancer xenograft model. The progression of subcutaneous tumors was monitored three days for day 12 until the endpoint. This Figure was drawn by an online tool Figdraw (https://www.figdraw.com/static/index.html#/paint_index_v2). B) Images of xenograft tumors that were inoculated into nude mice with the indicated T24 cell lines for 36 days. C) Volumes of xenograft tumors in the indicated groups on different days. D) Weights of xenograft tumors in the indicated groups at the endpoint. E) Body weight of mice in the indicated groups at the endpoint. F) Representative images of hematoxylin and eosin (H&E) (left panel) and IHC staining (right panel: USP52 and xCT) of tumor xenografts from the indicated groups. G) Representative images of IHC staining for Ki‐67 and 4‐HNE in tumor xenografts from the indicated groups. H,I) The average optical density of proteins was assessed with ImageJ software. Statistical graphs of IHC staining for Ki‐67 (H) and 4‐HNE (I) in tumor xenografts from the indicated groups. Scale bar: 100 µm. The data are presented as the means ± SDs, with n = 4 (H,I) or 7 (C–E) independent repeats. Statistical significance was determined by one‐way ANOVA with Tukey's multiple comparisons (D,E,H,I) or two‐way ANOVA with Tukey's multiple comparisons (C).
Figure 8
Figure 8
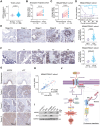
USP52 is positively correlated with xCT and is associated with BLCA progression and prognosis. A) The mRNA level of USP52 in BLCA and normal tissues in the TCGA‐BLCA cohort (RNA‐seq data). TPM: transcripts per million kilobases. B) 16 pairs of matched BLCA and paracancerous tissues were collected for qRT‐PCR assay form Zhongnan Hospital. The relative mRNA level of USP52 in BLCA and paracancerous tissues in the Zhongnan Hospital cohort were showed. C) The average optical density of the USP52 protein in 16 pairs of matched BLCA and paracancerous tissues from the HBlaU079Su01 cohort were analyzed via IHC staining. D) The prognostic curve (overall survival) of patients with different USP52 protein levels in the HBlaU079Su01 cohort was analyzed. The patients were divided into high and low USP52 protein level groups according to the quartile USP52 expression. E) Representative images (left panel) and statistical graphs (right panel) of IHC staining analysis of USP52 protein levels in different stages (the seventh edition of the AJCC: stage Ois, stage I, stage II, stage III, and stage IV) from the HBlaU079Su01 cohort. F) Representative images (left panel) and statistical graphs (right panel) of the results of the IHC staining analysis of USP52 protein levels at various T stages (Tis, T1, T2, T3, and T4) in samples from the HBlaU079Su01 cohort. G) Representative IHC images of USP52 and xCT in four identical tissues (1 paracancerous and 3 BLCA tissues) from the HBlaU079Su01 cohort. H) The correlation between USP52 and xCT protein expression in the HBlaU079Su01 cohort was analyzed by IHC staining. The average optical density of proteins was assessed with ImageJ software. The correlation coefficient and p‐value were showed. I) 1 normal uroepithelial cell line (SV‐HUC‐1) and 6 BLCA cell lines (T24, 5637, SCaBER, UM‐UC‐3, RT4, and J82) were collected for Western blot assay. The protein expression of USP52 and xCT in multiple cell lines was showed. J) Mechanism diagram of this study. This Figure was drawn by an online tool Figdraw (https://www.figdraw.com/static/index.html#/paint_index_v2). Scale bar: 100 µm. The data are presented as the means ± SDs. Statistical significance was determined by two‐tailed unpaired Student's t‐test (A,E,F), two‐tailed paired Student's t‐test (B,C), Pearson's correlation (H), or the log‐rank test of Kaplan–Meier analysis (D).

References

    1. Sung H., Ferlay J., Siegel R. L., Laversanne M., Soerjomataram I., Jemal A., Bray F., CA Cancer J. Clin. 2021, 71, 209. - PubMed
    1. van Hoogstraten L. M. C., Vrieling A., van der Heijden A. G., Kogevinas M., Richters A., Kiemeney L. A., Nat. Rev. Clin. Oncol. 2023, 20, 287. - PubMed
    1. a) Dixon S. J., Lemberg K. M., Lamprecht M. R., Skouta R., Zaitsev E. M., Gleason C. E., Patel D. N., Bauer A. J., Cantley A. M., Yang W. S., Morrison B. 3rd, Stockwell B. R., Cell 2012, 149, 1060; - PMC - PubMed
    2. b) Xie Y., Hou W., Song X., Yu Y., Huang J., Sun X., Kang R., Tang D., Cell Death Differ. 2016, 23, 369; - PMC - PubMed
    3. c) Stockwell B. R., Friedmann Angeli J. P., Bayir H., Bush A. I., Conrad M., Dixon S. J., Fulda S., Gascón S., Hatzios S. K., Kagan V. E., Noel K., Jiang X., Linkermann A., Murphy M. E., Overholtzer M., Oyagi A., Pagnussat G. C., Park J., Ran Q., Rosenfeld C. S., Salnikow K., Tang D., Torti F. M., Torti S. V., Toyokuni S., Woerpel K. A., Zhang D. D., Cell 2017, 171, 273. - PMC - PubMed
    1. a) Stockwell B. R., Jiang X., Cell Chem. Biol. 2020, 27, 365; - PMC - PubMed
    2. b) Cao J. Y., Dixon S. J., Cell. Mol. Life Sci. 2016, 73, 2195. - PMC - PubMed
    1. Koppula P., Zhang Y., Zhuang L., Gan B., Cancer Commun. 2018, 38, 12. - PMC - PubMed