. 2024 Oct 22;43(10):114848.
doi: 10.1016/j.celrep.2024.114848. Epub 2024 Oct 10.

Post-stroke hippocampal neurogenesis is impaired by microvascular dysfunction and PI3K signaling in cerebral amyloid angiopathy

Affiliations

Post-stroke hippocampal neurogenesis is impaired by microvascular dysfunction and PI3K signaling in cerebral amyloid angiopathy

Olivia M Osborne et al. Cell Rep. .

Abstract

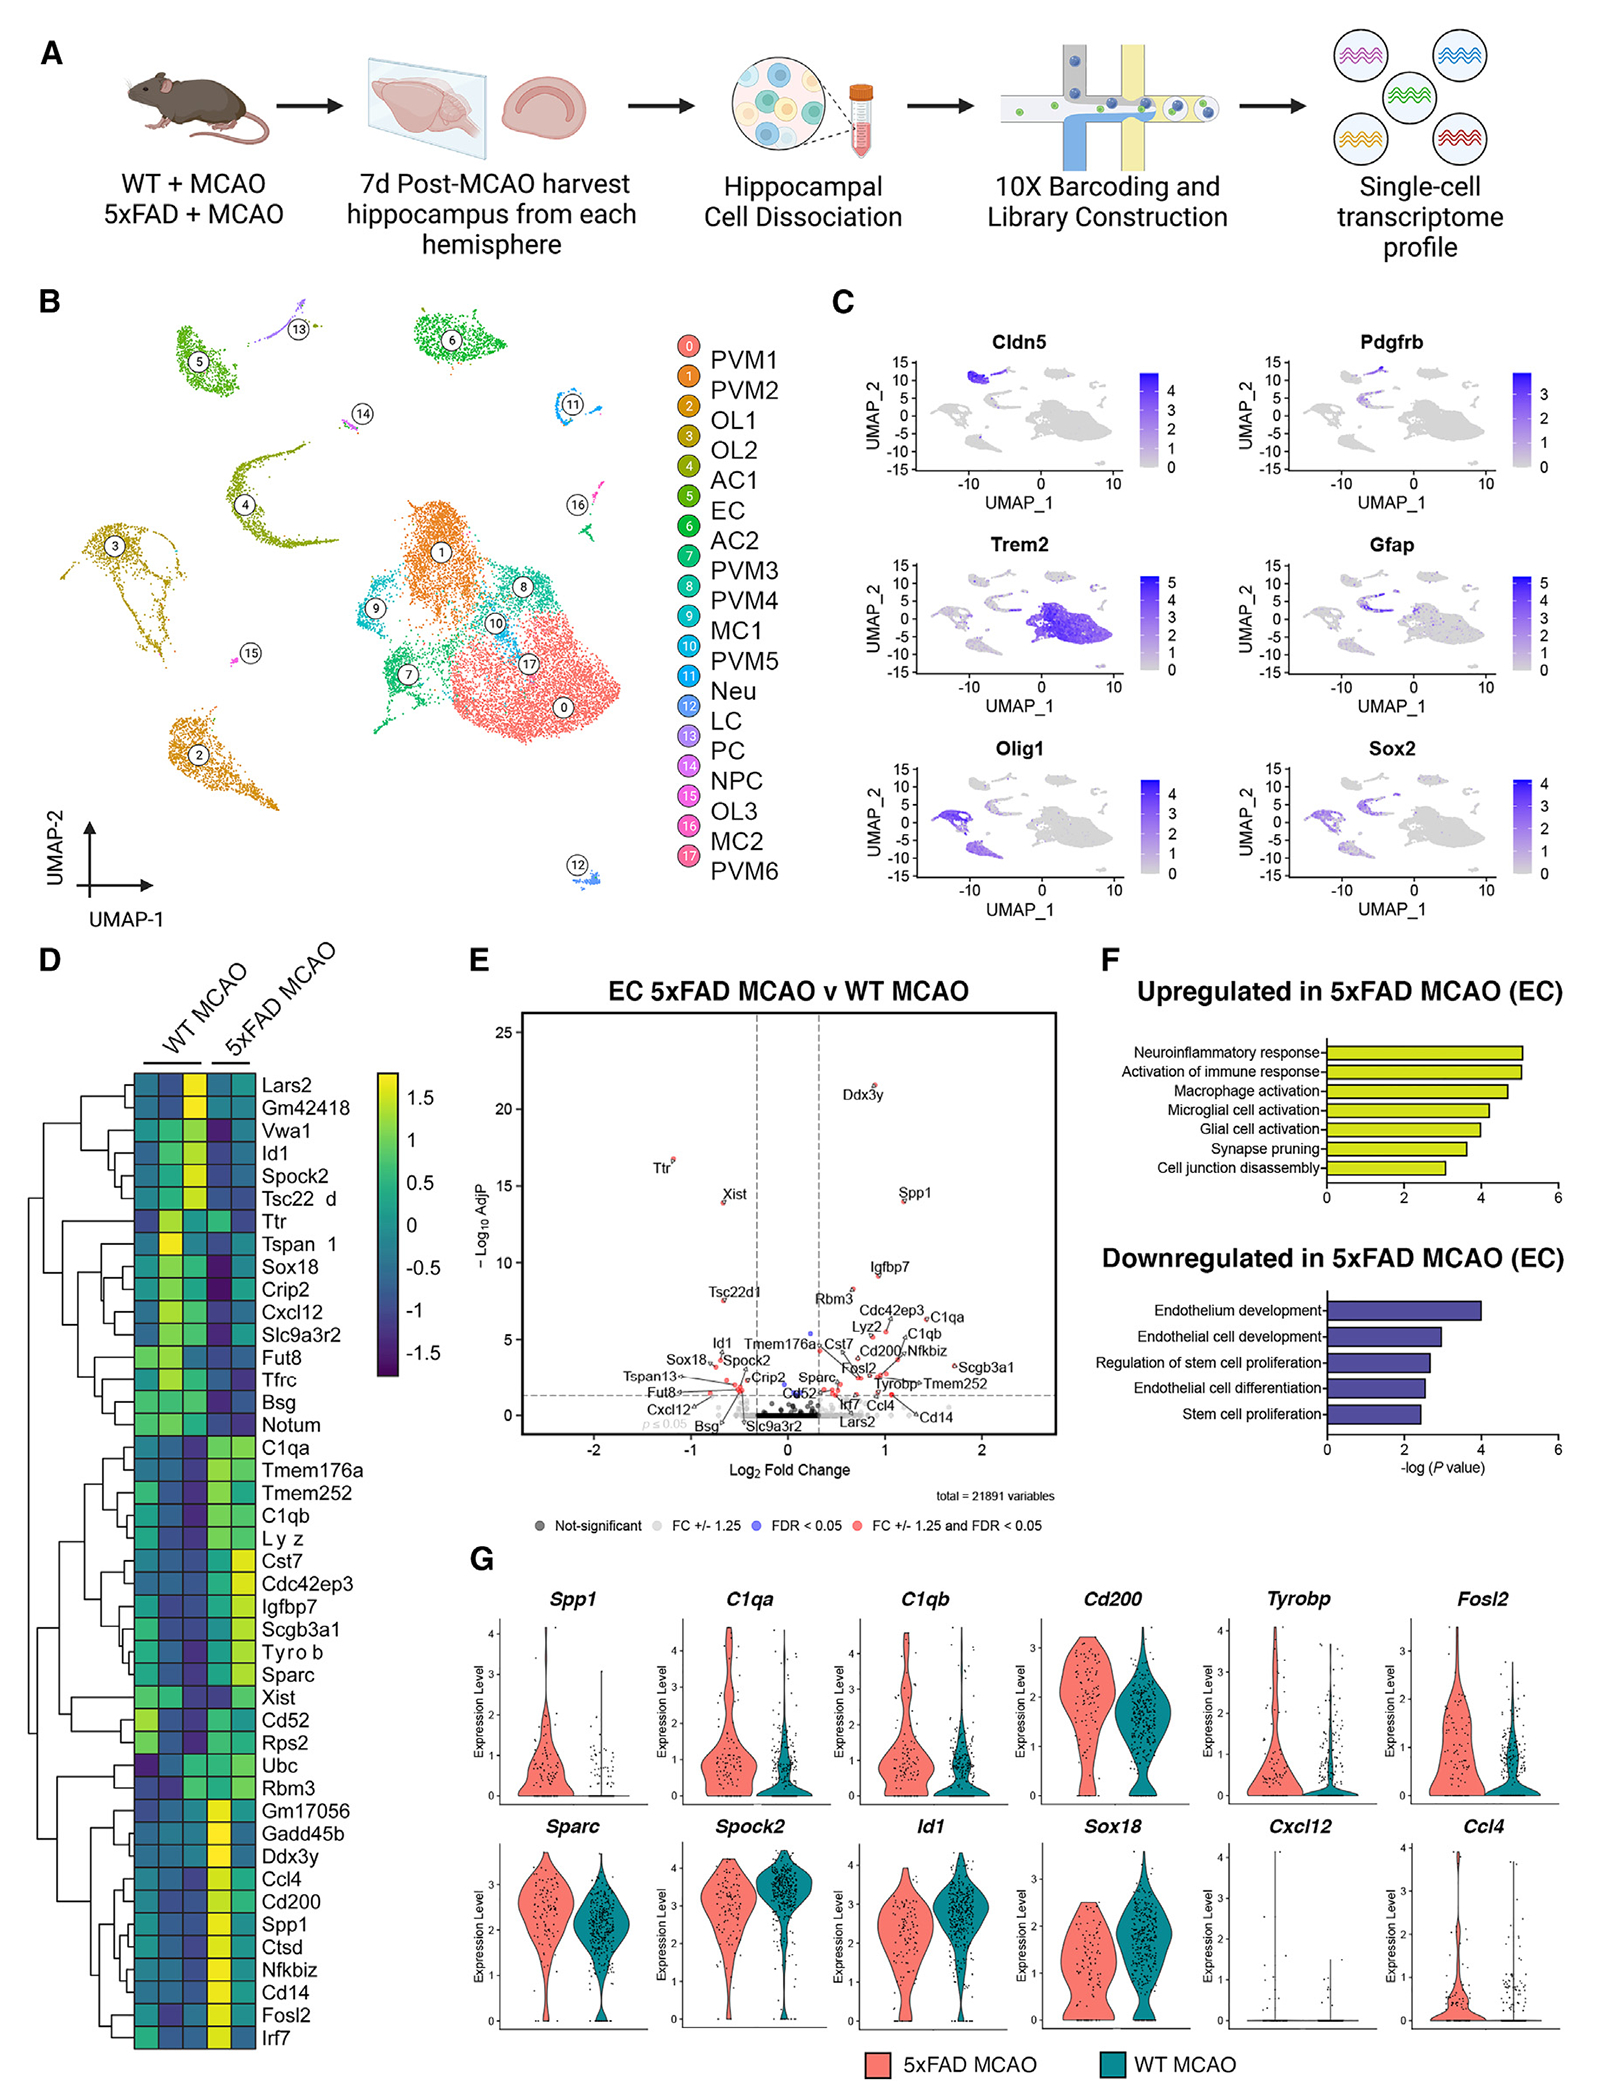
Ischemic stroke and cerebral amyloid angiopathy (CAA) pose significant challenges in an aging population, particularly in post-stroke recovery. Using the 5xFAD mouse model, we explore the relationship between CAA, ischemic stroke, and tissue recovery. We hypothesize that amyloid-beta accumulation worsens stroke outcomes by inducing blood-brain barrier (BBB) dysfunction, leading to impaired neurogenesis. Our findings show that CAA exacerbates stroke outcomes, with mice exhibiting constricted BBB microvessels, reduced cerebral blood flow, and impaired tissue recovery. Transcriptional analysis shows that endothelial cells and neural progenitor cells (NPCs) in the hippocampus exhibit differential gene expression in response to CAA and stroke, specifically targeting the phosphatidylinositol 3-kinase (PI3K) pathway. In vitro experiments with human NPCs validate these findings, showing that disruption of the CXCL12-PIK3C2A-CREB3L2 axis impairs neurogenesis. Notably, PI3K pathway activation restores neurogenesis, highlighting a potential therapeutic approach. These results suggest that CAA combined with stroke induces microvascular dysfunction and aberrant neurogenesis through this specific pathway.

Keywords: CAA; CP: Cell biology; CP: Neuroscience; PI3K; hippocampus; neurogenesis; stroke.


Conflict of interest statement

Declaration of interests The authors declare no competing interests.

Figures

Figure 1.
Figure 1.. CAA differentially affects ischemia and delays tissue recovery after stroke
Mice from 5xFAD and WT littermates at 12 months of age were subjected to a transient MCA occlusion for 60 min and analyzed for post-stroke recovery characteristics. (A) Diagram showing an overview of mouse experiments where cognitive decline increases with age. At the time of MCAO, we aim to study the difference in cognition and tissue recovery over an acute time of 24 h and 7 days. (B) Cerebral blood flow (CBF) was measured with laser doppler and calculated as a percentage of baseline before MCAO, during the occlusion, and 24 h post MCAO. xy plots are mean ± SD. (C and D) CBF flux showed a non-significant difference between each genotype during the occlusion period (WT n = 6; 5xFAD n = 6). At 24 h after stroke, CBF flux was documented and the reperfusion flux of WT mice (n = 4) at 12 months of age was significantly higher than the reperfusion flux of 5xFAD mice (n = 5) examined by laser doppler. *p = 0.021; two-tailed Student’s t test. Box-and-whisker plots are show minimum to maximum with all points. (E) Infarct size was quantified using TTC staining in the brains of WT +/− MCAO and 5xFAD +/− MCAO mice (n = 5–7 mice per group) at 12 months of age, 7 days post MCAO. (F) Total infarct volume (mm3) in the brains of WT and 5xFAD sham mice (n = 6 mice per group) and WT MCAO mice (n = 5 mice), and 5xFAD MCAO mice (n = 7 mice) were quantified 7 days post stroke. ****p < 0.0001; ordinary one-way analysis of variance (ANOVA) with Tukey’s post hoc test. (G) Comparison of infarct volume in WT MCAO or 5xFAD MCAO mice (n = 4–7 mice per group) 24 h post stroke and 7 days post stroke **p < 0.01; two-way ANOVA. NS, not significant. (H) ThioS (cyan) is depicted in the coronal whole-brain section from 5xFAD sham mouse. Scale bar, 2,000 μm. (I) ThioS (cyan) is depicted in the coronal whole-brain section from 5xFAD MCAO mouse. Scale bar, 2,000 μm. (J) Heatmap displaying the amyloid burden quantified by ThioS count averages in different regions of the brain as follows: Hippo, hippocampus; Hemi, hemisphere. Amyloid was exclusively observed with thioflavin S staining in the brains of 5xFAD mice. Similar results were observed in at least four independent experiments.
Figure 2.
Figure 2.. Amyloid accelerates post-ischemic stroke functional recovery in mice
(A) The neurodeficit score (neuroscore) of each mouse was monitored over time post treatment for up to 7 days. xy plots are mean ± SD. (B) Neuroscore analysis was quantified 24 h post stroke. For WT sham n = 11 mice, 5xFAD sham n = 10 mice, WT MCAO n = 28 mice, 5xFAD MCAO n = 26 mice. (C) Neuroscore analysis was quantified 7 days post stroke. For WT sham n = 11 mice, 5xFAD sham n = 7 mice, WT MCAO n = 11 mice, 5xFAD MCAO n = 9 mice. (D) Y-maze spontaneous alternation performance of WT and 5xFAD mice exposed to stroke were tracked using Any-Maze software tracking of the mouse for the duration of the test (green lines). The novel arm for the test is indicated by the top left arm of the Y. (E) Analyses of the number of spontaneous alternations performed by each mouse in the Y-maze was quantified. n = 8 mice per group. (F) Analyses of the percentage of entries into the novel arm of the Y-maze test after a new arm is introduced. n = 8 mice per group. (G) Anxiety behavior of WT and 5xFAD mice +/− MCAO examined by open-field tests. Any-Maze software was used to track the motion of the mouse within the arena (green lines). (H) The ratio of time spent in the middle of the arena during the open-field test was calculated for the mice. n = 8 mice per group. (I) The distance traveled by each mouse was quantified and plotted in total meters walked during the open-field test duration.
Figure 3.
Figure 3.. The effect of cerebrovascular CAA on hippocampal transcriptomic signatures post stroke
(A) Brain hippocampal tissue WT MCAO (n = 3 mice) and 5xFAD MCAO mice (n = 2 mice) at 12 months of age and 7 days post MCAO were subjected to scRNA-seq. Diagram showing an overview of the scRNA-seq experiment. The contralateral hippocampus was used as an internal sham control for all analyses. (B) UMAP visualization of 18,186 isolated cells at 0.2 resolution from 12-month-old mice (n = 2 or 3 mice per group). Similar clusters are merged to show the annotated cell types within the same cluster. AC, astrocytes; LC, leukocytes; MC, myeloid cells; Neu, neurons; NPC, neural progenitor cells; OL, oligodendrocytes; PC, pericytes; PVM, perivascular macrophages. (C) UMAP plots with each cell cluster highlighted in purple corresponding to a ubiquitous marker used to identify that cluster. (D) Heatmap revealing the scaled expression of DEGs in ECs from WT MCAO and 5xFAD MCAO mice. (E) Volcano plot depicting the top upregulated and downregulated genes in EC population in WT MCAO compared to 5xFAD MCAO. Genes that are significant at a p value ≤0.05 and log fold change ≥1.25 are portrayed in red. (F) GO pathway analysis for upregulated (yellow) or downregulated (purple) genes in the EC cluster of 5xFAD MCAO mice. Bars show −log10(p). (G) Violin plots showing the mean and variance differences between WT MCAO and 5xFAD MCAO ECs for genes regulating blood vessel morphogenesis (Sox18, ID1) regulation of Neu death (C1QA, TYROBP, CD200), and chemokine signaling (Cxcl12, Ccl4).
Figure 4.
Figure 4.. CAA promotes constricted microvasculature pathology in ECs and increases microvascular dysfunction post stroke
(A) Isolated microvessels from brain hemispheres of WT and 5xFAD mice with or without stroke subjected to co-immunostaining for lectin (ECs), CLDN5, OCCLN, and ZO-1 (TJ proteins). Scale bar for all images, 20 μm. (B) Quantification of total ZO-1 normalized to lectin fluorescence in the microvessels (n = 5 mice per group). *p < 0.05, **p < 0.01. (C) Quantification of total OCCLN normalized to lectin fluorescence in the microvessels (n = 5 mice per group). *p < 0.05. (D) Quantification of total CLDN5 normalized to lectin fluorescence in the microvessels (n = 5 mice per group). *p < 0.05, **p < 0.01. (E) The vessel diameter was quantified in isolated mouse microvessels by taking the average of six random measurements per six microvessels per mouse (n = 5 mice per group). ***p < 0.001, ****p < 0.0001. (F–H) Mouse whole-brain homogenates from the ipsilateral hemispheres were quantified for protein via western blot analyses at 24 h post MCAO. The total levels of fibrinogen/GAPDH (WT sham, n = 8; WT MCAO, n = 9; 5xFAD sham, n = 7; 5xFAD MCAO, n = 9), PDGFRβ/GAPDH (WT sham, n = 6; WT MCAO, n = 6; 5xFAD sham, n = 6; 5xFAD MCAO, n = 6), and CD31/GAPDH (WT sham, n = 4; WT MCAO, n = 5; 5xFAD sham, n = 4; 5xFAD MCAO, n = 5) signals were quantified. *p < 0.05. (I–K) Mouse whole-brain homogenates from the ipsilateral hemispheres were quantified for protein via western blot analyses at 7 days post MCAO. The total levels of fibrinogen/GAPDH (WT sham, n = 4; WT MCAO, n = 4; 5xFAD sham, n = 5; 5xFAD MCAO, n = 5), PDGFRβ/GAPDH (WT sham, n = 4; WT MCAO, n = 4; 5xFAD sham, n = 5; 5xFAD MCAO, n = 4), and CD31/GAPDH (WT sham, n = 4; WT MCAO, n = 4; 5xFAD sham, n = 5; 5xFAD MCAO, n = 5) signals were quantified. *p < 0.05, **p < 0.01. (L) Graphical depiction of a human brain with an inset of how microvessel cross-sections were quantified within the hippocampal samples using ImageJ. (M) Postmortem human brain tissue from healthy individuals and individuals with CAA were co-immunostained with CD31 and DAPI in the region of the DG of the hippocampus. Scale bar, 60 μm. (N) Quantification of vessel diameters in postmortem human brain microvessels were averaged across five individuals per disease and plotted. *p < 0.05.
Figure 5.
Figure 5.. Microfil contrast-enhanced CTA shows decreased vascular perfusion of 5xFAD mice compared to WT controls
(A) CTA images of all vascular structures within the skull of WT and 5xFAD mice. Differences in the perfusion of the contrast agent into the brain were observed between the two groups, denoted by the blue arrow. CTA images of each respective mouse had the background vascular structures removed except the tongue and brain to highlight these ROI for analysis. (B) Perfusion volume was calculated by analyzing the volume of contrast agent that successfully perfused the brain during CTA. n = 12 mice per group. *p < 0.05; paired two-tailed Student’s t test. (C) Segmentation ROI of the brain vasculature of the CoW including anterior cerebral artery (ACA) and middle cerebral arteries (MCA). Red lines denote areas where cross-sectional diameters were measured. (D) Segmentation highlighting variation in the perfusion of the vasculature within the brain for the two models in the CoW. (E) Analysis of the arterial cross-sectional diameters for the 5xFAD and WT animal models at the ACA and MCA. n = 3 mice per genotype.
Figure 6.
Figure 6.. Stroke differentially downregulates chemokine response and neurogenesis in neural progenitor cells with CAA
(A) Volcano plot illustrating the downregulated genes in the NPC cluster from 5xFAD MCAO mice compared to 5xFAD sham mice. Genes significant at a p value <0.05 and log fold change ≥1.25 are portrayed in red. (B) Violin plots showing the mean and variance differences between 5xFAD MCAO and 5xFAD sham NPCs for genes regulating Neu projection guidance (Cxcl12, Scn1b), PI3K/AKT signaling pathway (Pik3c2a, Creb3l2), and RNA processing (Ddx23, Kin). (C) GO pathway analyses for downregulated genes in the NPC population of the 5xFAD MCAO mice. Bars show −log10(p). (D) Brain sections from 5xFAD sham or 5xFAD MCAO mice (sham, n = 3 mice; MCAO, n = 3 mice) at 12 months of age were subjected to co-immunostaining for Cxcl12 (red) and CD31 (green), or DCX (blue), NeuN (green), and DAPI (cyan). (E) The ratio of Cxcl12/CD31 signal was quantified. **p = 0.0011, two-tailed Student’s t test. Scale bar, 50 μm. (F) The relative fluorescent count signal of DCX per DAPI+ cell was quantified from brain sections of mice. *p = 0.0223. (G) Incucyte ZOOM analysis of NPC neurogenesis over 16 h. ReN cells were exposed to siRNA-CXCL12, siRNA-PIK3C2A, siRNA-CREB3L2, or scrambled siRNA for 24 h before imaging in the incucyte. Representative images from time points 0 and 16 h after siRNA transfection were taken, where blue indicates neurite extensions and green represents cell bodies. Scale bar, 100 μm. (H) Quantification of Incucyte images demonstrates the change in rate of neurite length per cell-body cluster area. Graphs represent the average of individual pictures taken in 16 image grids over 16 h. Additionally, t = 0 h corresponds to the first image taken after a 24-h transfection with siRNA on the graph. xy plot is mean ± SEM. **p = 0.0058, ***p = 0.0007, ****p < 0.0001; †††p = 0.0001, ††††p < 0.0001; ‡‡‡‡p < 0.0001; ####p < 0.0001; ordinary two-way ANOVA with multiple comparisons.
Figure 7.
Figure 7.. Differential recovery of 5xFAD neurogenesis post stroke compared to WT with AE-18 activator
(A) Diagram showing an overview of the mouse experiments. We subjected 12-month-old WT and 5xFAD mice to MCAO. Following treatment, mice were administered AE-18 or corn oil once per day up to 7 days post stroke before analyses. Additionally, BrdU was administered for the last 2 days for neurogenesis experiments. (B) After 7 days, infarct size was quantified using TTC staining in the brains of WT MCAO and 5xFAD MCAO mice (corn oil, n = 6–8 mice per group; AE-18, n = 7–8 mice per group) at 12 months of age. (C) Total infarct volumes (mm3) in the brains of WT MCAO + corn oil (n = 8 mice), 5xFAD MCAO + corn oil mice (n = 6 mice), WT MCAO + AE-18 mice (n = 8 mice), and 5xFAD MCAO + AE-18 mice (n = 7 mice) were quantified 7 days post MCAO and drug administration. (D) The difference (Δ) in neurodeficit scores was quantified from baseline to 7 days post MCAO and drug administration. n = 7–8 mice per group. (E) 5xFAD and WT mice were injected i.p. with BrdU once a day for the last 2 days of oral gavage treatment before being sacrificed. Brain sections were immunostained with NeuN, DCX, BrdU, and DAPI to verify the presence of actively proliferating NPCs and maturing Neus. Scale bar, 20 μm. (F) Visualization of proliferating NPCs within the SGZ of the hippocampus. Red arrowheads indicate co-localization of either DCX/BrdU-positive cells in the corn oil groups or NeuN/BrdU-positive cells in the AE-18 groups. Inset images display each respective overlap. Scale bar, 20 μm. (G) The relative numbers of DCX and BrdU-double-positive cells were counted in each group in the SGZ. n = 2 or 3 mice per group. (H) To label proliferating NPCs that matured into Neus, the relative numbers of NeuN and BrdU-double-positive cells were counted in each group in the SGZ. n = 2 or 3 mice per group. All bar plots are mean ± SEM. *p < 0.05, **p < 0.01, ***p < 0.001, ****p < 0.0001; ordinary one-way ANOVA with Tukey’s post hoc test.

Similar articles

Cited by

References

    1. Hecht M, Krämer LM, von Arnim CAF, Otto M, and Thal DR (2018). Capillary cerebral amyloid angiopathy in Alzheimer’s disease: association with allocortical/hippocampal microinfarcts and cognitive decline. Acta Neuropathol. 135, 681–694. 10.1007/s00401-018-1834-y. - DOI - PubMed
    1. Pfeifer LA, White LR, Ross GW, Petrovitch H, and Launer LJ (2002). Cerebral amyloid angiopathy and cognitive function: the HAAS autopsy study. Neurology 58, 1629–1634. 10.1212/wnl.58.11.1629. - DOI - PubMed
    1. Case NF, Charlton A, Zwiers A, Batool S, McCreary CR, Hogan DB, Ismail Z, Zerna C, Coutts SB, Frayne R, et al. (2016). Cerebral Amyloid Angiopathy Is Associated With Executive Dysfunction and Mild Cognitive Impairment. Stroke 47, 2010–2016. 10.1161/strokeaha.116.012999. - DOI - PubMed
    1. McCarron MO, Nicoll JA, Ironside JW, Love S, Alberts MJ, and Bone I (1999). Cerebral Amyloid Angiopathy–Related Hemorrhage. Stroke 30, 1643–1646. 10.1161/01.STR.30.8.1643. - DOI - PubMed
    1. Rivier CA, Kamel H, Sheth KN, Iadecola C, Gupta A, de Leon MJ, Ross E, Falcone GJ, and Murthy SB (2024). Cerebral Amyloid Angiopathy and Risk of Isolated Nontraumatic Subdural Hemorrhage. JAMA Neurol. 81, 163–169. 10.1001/jamaneurol.2023.4918. - DOI - PMC - PubMed

Publication types

MeSH terms

Substances

LinkOut - more resources