. 2024 Nov 6;15(21):3991-4009.
doi: 10.1021/acschemneuro.4c00367. Epub 2024 Oct 11.

Interactions of Polychlorinated Biphenyls and Their Metabolites with the Brain and Liver Transcriptome of Female Mice

Affiliations

Interactions of Polychlorinated Biphenyls and Their Metabolites with the Brain and Liver Transcriptome of Female Mice

Amanda J Bullert et al. ACS Chem Neurosci. .

Abstract

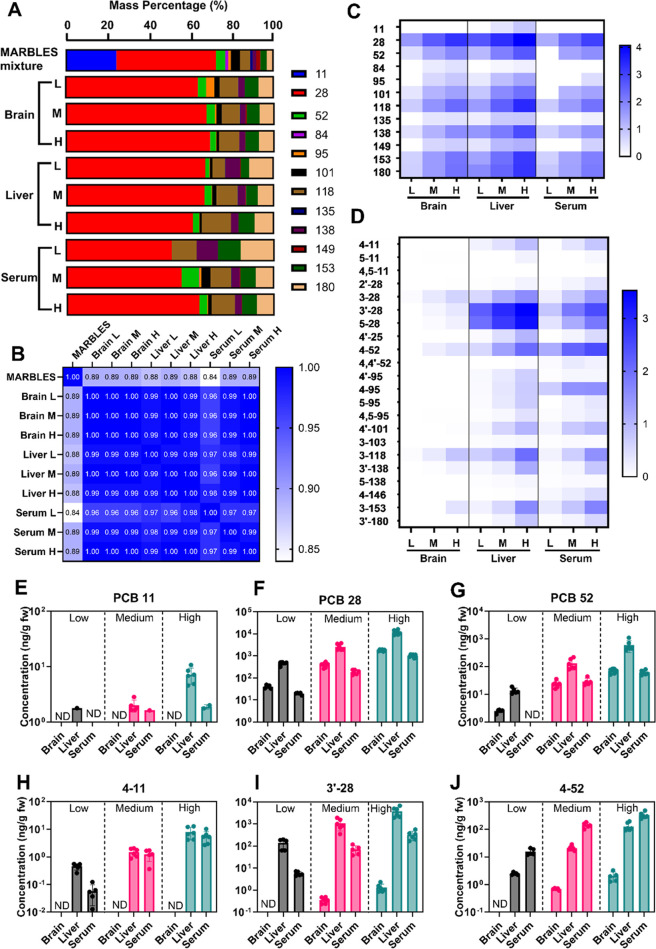
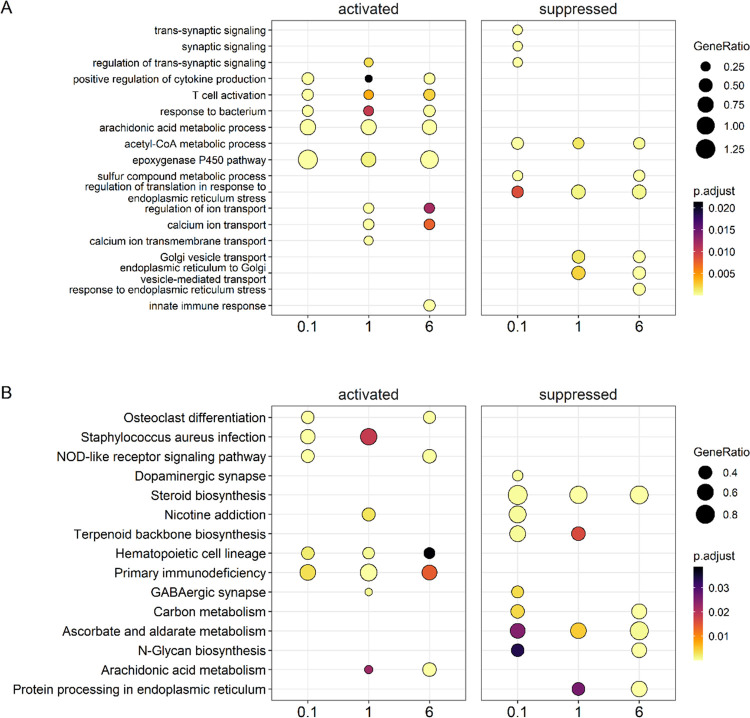
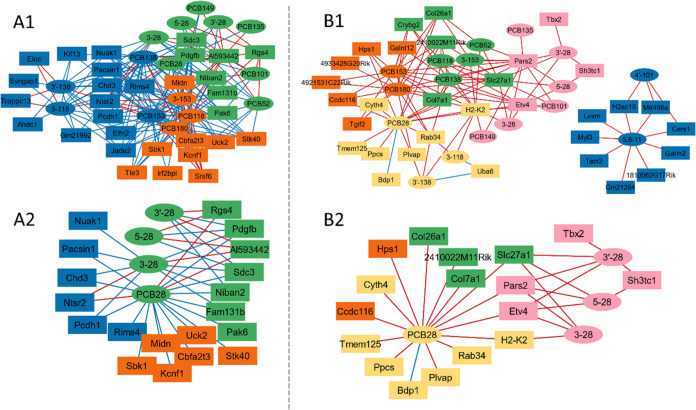
Exposure to polychlorinated biphenyls (PCBs) is linked to neurotoxic effects. This study aims to close knowledge gaps regarding the specific modes of action of PCBs in female C57BL/6J mice (>6 weeks) orally exposed for 7 weeks to a human-relevant PCB mixture (MARBLES mix) at 0, 0.1, 1, and 6 mg/kg body weight/day. PCB and hydroxylated PCB (OH-PCBs) levels were quantified in the brain, liver, and serum; RNA sequencing was performed in the striatum, prefrontal cortex, and liver, and metabolomic analyses were performed in the striatum. Profiles of PCBs but not their hydroxylated metabolites were similar in all tissues. In the prefrontal cortex, PCB exposure activated the oxidative phosphorylation respiration pathways, while suppressing the axon guidance pathway. PCB exposure significantly changed the expression of genes associated with neurodevelopmental and neurodegenerative diseases in the striatum, impacting pathways like growth hormone synthesis and dendrite development. PCBs did not affect the striatal metabolome. In contrast to the liver, which showed activation of metabolic processes following PCB exposure and the induction of cytochrome P450 enzymes, the expression of xenobiotic processing genes was not altered by PCB exposure in either brain region. Network analysis revealed complex interactions between individual PCBs (e.g., PCB28 [2,4,4'-trichlorobiphenyl]) and their hydroxylated metabolites and specific differentially expressed genes (DEGs), underscoring the need to characterize the association between specific PCBs and DEGs. These findings enhance the understanding of PCB neurotoxic mechanisms and their potential implications for human health.

Keywords: RNA sequencing; metabolomics; multiomics; network analysis; neurotoxicity; polychlorinated biphenyls.


Conflict of interest statement

The authors declare no competing financial interest.

Figures

Figure 1
Figure 1
PCB congener profile of the MARBLES mix differs from the profiles of the PCB tissue residues, as illustrated using (A) a stacked bar diagram and (B) a heatmap-like comparison of similarity coefficient cos θ between PCB congener profiles in different tissues and the MARBLES mix. PCB congener profiles are expressed as the mass percentage %. The tissue levels of the MARBLES PCB congeners and the corresponding OH-PCB metabolites depend on the dose and tissue. Heatmap-like illustrations of (C) PCB and (D) OH-PCB metabolite levels (ng/g, expressed on a log scale) from all exposure groups in the brain, liver, and serum typically show a dose-dependent increase in PCB and OH-PCB metabolite levels. Levels of representative PCB and OH-PCB congeners, including (E) PCB11, (F) PCB28, (G) PCB52, (H) 4–11, (I) 3′–28, and (J) 4–52. All values in the heatmap are log-transformed, and values in the bar graph are mean ± SD of the fresh-weight adjusted levels, with each value represented with an individual dot. Differences in PCB and OH-PCB levels by dose and tissue were assessed using 2-way ANOVA, followed by Tukey post hoc analysis, with p < 0.05 considered significantly different, and are summarized in Tables S2 and S3. H, high dose; L, low dose; M, medium dose; ND, not detected.
Figure 2
Figure 2
iPathwayGuide analysis from the prefrontal cortex of female mice exposed orally to 6 mg/kg bw/d of the MARBLES mix reveals genes significantly altered and involved in disrupted pathways (i.e., Choline metabolism in cancer) and diseases (i.e., Atypical chronic myeloid leukemia). (A) Volcano plot indicating 66 DEGs based on thresholds of p-value <0.1 and log fold change >0.3. The significance is represented in terms of the negative log (base 10) of the p-value so that more significant genes are plotted higher on the y-axis. The dotted lines represent the thresholds used to select the DE genes: 0.3 for expression change and 0.1 for significance. (B) Significantly altered genes associated with pathways (B1 & B2) and disease (B3 & B4) are shown as violin plots representing the frequency distribution with median and quartiles indicated by dotted lines (bold and fine lines, respectively). (C) KEGG pathway association network based on relationships with significantly altered genes with the top 6 KEGG pathways plotted. (D) The top 6 affected diseases plotted with associations to significantly altered genes. Figures were generated from Advaita Corporation iPathwayGuide.
Figure 3
Figure 3
Gene set analysis comparison conducted for prefrontal cortex samples of females orally exposed to the MARBLES mix. (A) Gene enrichment dot plot of top 3 activated and suppressed genes from each exposure group to identify overlapping results. For example, several processes such as “oxidative phosphorylation”, “cytoplasmic translation”, and “aerobic respiration” were significantly activated while one processes, “homophilic cell adhesion”, was suppressed. (B) KEGG pathway enrichment dot plot of top 3 activated and suppressed pathways across exposure groups reveals “oxidative phosphorylation” is significantly activated and pathways such as “axon guidance”, “gap junction”, and “calcium signaling” were significantly suppressed in the two highest exposure groups. (C) A disease enrichment analysis identifying the top 3 activated and suppressed diseases. A shared activated disease across all exposure groups is “mitochondria complex 1 deficiency” which echos the oxidative phosphorylation KEGG pathway results. The suppressed diseases for all exposures included both “intellectual disability” and “specific developmental disorder”. The color indicates the adjusted p-values of the estimated significance of the corresponding enrichment analysis. The dot size indicates GeneRatio or the number of genes in a particular gene set enriched over the total number of genes in the gene set, KEGG pathway, or disease ontology based on the KEGG database. The x-axis indicates dosing groups. Figures were generated using R packages fgsea and clusterProfiler..
Figure 4
Figure 4
iPathwayGuide analysis from the striatum of female mice exposed orally to 6 mg/kg bw/d of the MARBLES mix reveals genes significantly altered and involved in disrupted pathways (i.e., Hereditary gingival fibromatosis) and diseases (i.e., Growth hormone synthesis). (A) Volcano plot indicating 302 DEGs based on thresholds of p-value <0.1 and log fold change >0.3. The significance is represented in terms of the negative log (base 10) of the p-value so that more significant genes are plotted higher on the y-axis. The dotted lines represent the thresholds used to select the DE genes: 0.3 for expression change and 0.1 for significance. (B) Significantly altered genes associated with pathways (B1 & B2) and disease (B3 & B4) are shown as violin plots representing the frequency distribution with median and quartiles indicated by dotted lines (bold and fine lines, respectively). (C) KEGG pathway association network based on relationships with significantly altered genes with the top 6 KEGG pathways plotted. (D) The top 6 affected diseases plotted with associations to significantly altered genes. Figures were generated from Advaita Corporation iPathwayGuide.
Figure 5
Figure 5
Gene set analysis comparison conducted for striatum samples of females orally exposed to the MARBLES mix. (A) Gene enrichment dot plot of top 3 activated and suppressed genes from each exposure group to identify overlapping results. For example, “cytoplasmic translation” was significantly activated while “dendrite development” was significantly suppressed in two out of the three exposure groups. (B) KEGG pathway enrichment dot plot of top 3 activated and suppressed pathways across exposure groups reveals that only one pathway result was significantly activated, overlapping in two groups, the “ribosome” KEGG pathway. For suppressed pathways, “focal adhesion”, and “synaptic vesicle cycle”, were the only two pathways overlapping in two of the exposure groups. (C) A disease enrichment analysis identifying the top 3 activated and suppressed diseases. A shared activated disease across two exposure groups is “gonadal disease” while the only suppressed disease shared by two groups was “psoriasis”. The color indicates the adjusted p-values of the estimated significance of the corresponding enrichment analysis. The dot size indicates GeneRatio or the number of genes in a particular gene set enriched over the total number of genes in the gene set, KEGG pathway, or disease ontology based on the KEGG database. The x-axis indicates dosing groups. Figures were generated using R packages fgsea and clusterProfiler..
Figure 6
Figure 6
iPathwayGuide analysis from the liver of female mice exposed orally to 6 mg/kg bw/d of the MARBLES mix reveals genes significantly altered and involved in disrupted pathways (i.e., inflammatory mediator regulation of TRP channels) and diseases (i.e., Thalassemia). (A) Volcano plot indicating 491 DEGs based on thresholds of p-value <0.1 and log fold change >1. The significance is represented in terms of the negative log (base 10) of the p-value so that more significant genes are plotted higher on the y-axis. The dotted lines represent the thresholds used to select the DE genes: 1 for expression change and 0.1 for significance. (B) Significantly altered genes associated with pathways (B1 & B2) and disease (B3 & B4) are shown as violin plots representing the frequency distribution with median and quartiles indicated by dotted lines (bold and fine lines, respectively). (C) KEGG pathway association network based on relationships with significantly altered genes with the top 6 KEGG pathways plotted. (D) The top 6 affected diseases plotted with associations to significantly altered genes. Figures were generated from Advaita Corporation iPathwayGuide.
Figure 7
Figure 7
Gene set analysis comparison was conducted for liver samples of females orally exposed to the MARBLES mix. (A) Gene enrichment dot plot of top 3 activated and suppressed genes from each exposure group to identify overlapping results. For example, “T cell activation” is significantly activated while “regulation of translation in response to endoplasmic reticulum stress” is suppressed. (B) KEGG pathway enrichment dot plot of top 3 activated and suppressed pathways across exposure groups reveals “primary immunodeficiency” is significantly activated and “steroid biosynthesis” is suppressed. The color indicates the adjusted p-values of the estimated significance of the corresponding enrichment analysis. The dot size indicates GeneRatio or the number of genes in a particular gene set enriched over the total number of genes in the gene set, KEGG pathway, or disease ontology based on the KEGG database. The x-axis indicates dosing groups. Figures were generated using R packages fgsea and clusterProfiler..
Figure 8
Figure 8
Interaction network analyses of brain PCB and OH-PCB levels and the transcriptome in (A) the prefrontal cortex and (B) the striatum identify three and five clusters, respectively. Panels show (A1) the full network in the prefrontal cortex, (A2) the subnetwork of PCB28 and its OH-metabolites in the prefrontal cortex, (B1) the full network in the striatum, and (B2) a subnetwork of PCB28 and its OH-metabolites in the striatum. Network analyses were performed with xMWAS (version 0.552) using a threshold of absolute correlation coefficients >0.7 for the prefrontal cortex, > 0.75 for the striatum, and p < 0.05. Nodes in the same cluster share the same color. The node shape represents PCBs (ovals) and genes (rectangles). The edge color indicates positive (red) and negative (blue) correlations.

Similar articles

Cited by

References

    1. Markowitz G.; Rosner D. Monsanto, PCBs, and the creation of a “world-wide ecological problem. J. Public Health Policy 2018, 39 (4), 463–540. 10.1057/s41271-018-0146-8. - DOI - PubMed
    1. ATSDR . Toxicological profile for polychlorinated biphenyls. 2000. - PubMed
    1. Polychlorinated biphenyls and polybrominated biphenyls. IARC Monogr. Eval. Carcinog. Risks Hum. 2016, 107, 9–500. - PMC - PubMed
    1. EPA Polychlorinated Biphenyls (PCBs) . Inadvertent PCBs. https://www.epa.gov/pcbs/inadvertent-pcbs.
    1. Carlson L. M.; Christensen K.; Sagiv S. K.; Rajan P.; Klocke C. R.; Lein P. J.; Coffman E.; Shaffer R. M.; Yost E. E.; Arzuaga X.; Factor-Litvak P.; Sergeev A.; Toborek M.; Bloom M. S.; Trgovcich J.; Jusko T. A.; Robertson L.; Meeker J.; Keating A. F.; Blain R.; Silva R.; Snow S.; Lin C.; Shipkowski K.; Ingle B.; Lehmann G. M. A systematic evidence map for the evaluation of noncancer health effects and exposures to polychlorinated biphenyl mixtures. Environ. Res. 2023, 220, 115148.10.1016/j.envres.2022.115148. - DOI - PMC - PubMed

Publication types

Substances