. 2024 Oct 11;10(41):eadn3257.
doi: 10.1126/sciadv.adn3257. Epub 2024 Oct 11.

IFN-γ primes bone marrow neutrophils to acquire regulatory functions in severe viral respiratory infections

Affiliations

IFN-γ primes bone marrow neutrophils to acquire regulatory functions in severe viral respiratory infections

Florent Creusat et al. Sci Adv. .

Abstract

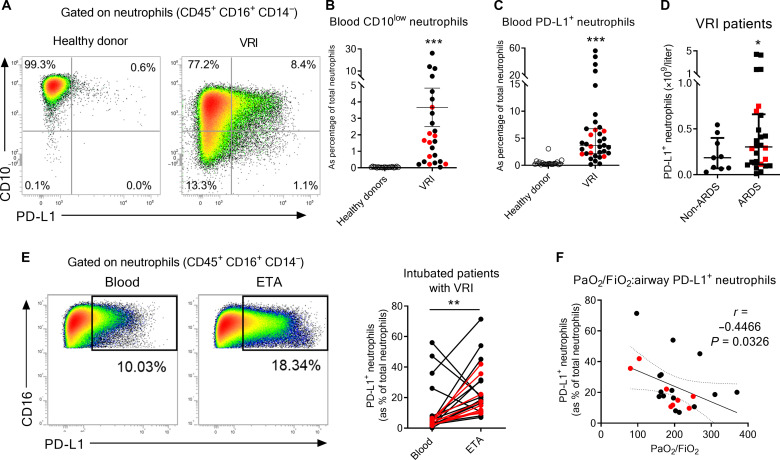
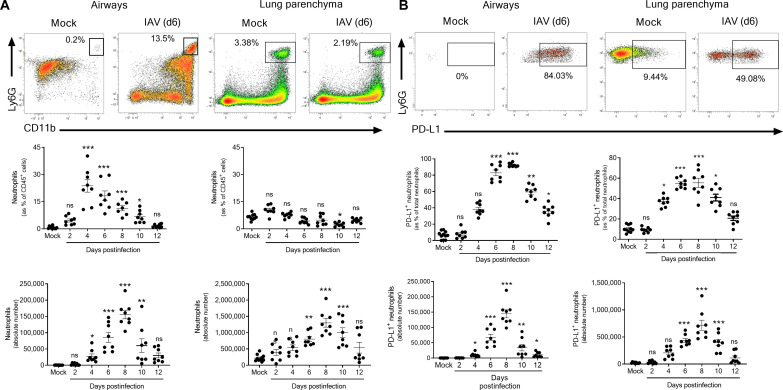
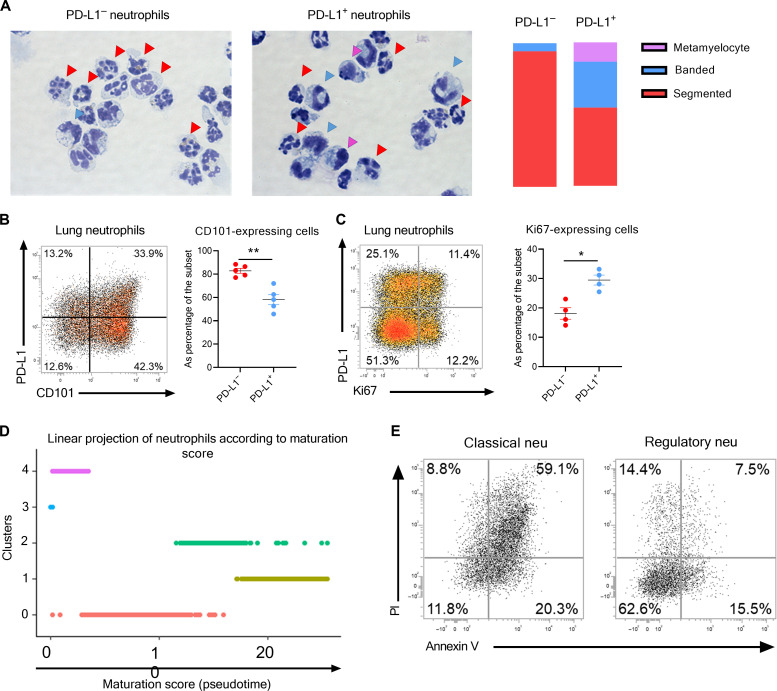
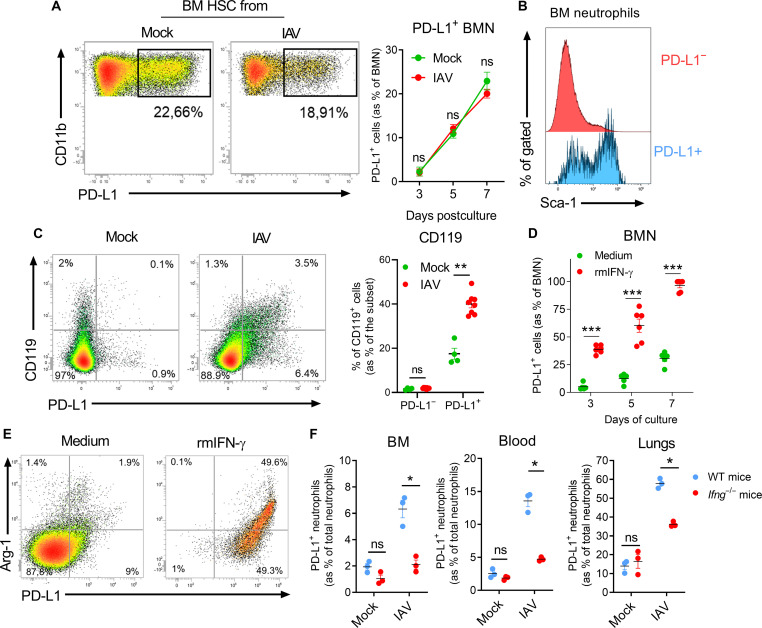
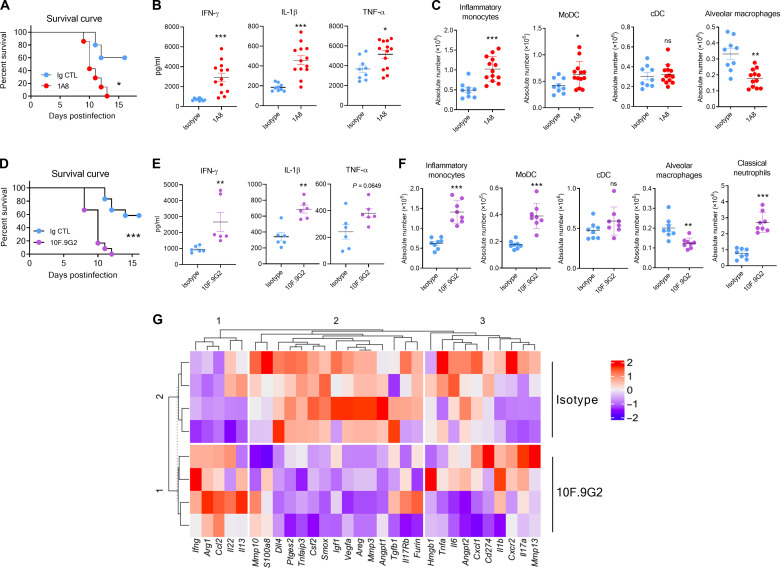
Neutrophil subsets endowed with regulatory/suppressive properties are widely regarded as deleterious immune cells that can jeopardize antitumoral response and/or antimicrobial resistance. Here, we describe a sizeable fraction of neutrophils characterized by the expression of programmed death-ligand 1 (PD-L1) in biological fluids of humans and mice with severe viral respiratory infections (VRI). Biological and transcriptomic approaches indicated that VRI-driven PD-L1+ neutrophils are endowed with potent regulatory functions and reduced classical antimicrobial properties, as compared to their PD-L1- counterpart. VRI-induced regulatory PD-L1+ neutrophils were generated remotely in the bone marrow in an IFN-γ-dependent manner and were quickly mobilized into the inflamed lungs where they fulfilled their maturation. Neutrophil depletion and PD-L1 blockade during experimental VRI resulted in higher mortality, increased local inflammation, and reduced expression of resolving factors. These findings suggest that PD-L1+ neutrophils are important players in disease tolerance by mitigating local inflammation during severe VRI and that they may constitute relevant targets for future immune interventions.


Figures

Fig. 1.
Fig. 1.. Neutrophils in patients with severe virus-induced ARDS.
(A to D) Flow cytometry analysis of circulating neutrophils in blood of 35 patients with severe viral pneumonia (black dots: COVID-19; red dots: flu) within 48 hours postadmission. (A) Phenotype of circulating neutrophils (CD45+ CD3 CD16+ CD14). Representative dot plots of CD10 and PD-L1 expression on circulating neutrophils from healthy donors and patients with VRI are shown. [(B) and (C)] Relative proportion of immature CD10low (B) or PD-L1+ (C) neutrophils within the total neutrophil compartment in blood of controls and patients. Individual and means ± SEM are shown (n = 20 to 25 per group). (D) Concentration of circulating PD-L1+ neutrophils according to the ARDS status. Individual values and means ± SEM are depicted (n = 9 to 26 per group). (E) Representative dot plots of PD-L1 expression on neutrophils from blood or ETA are shown in the left. Paired-analysis of PD-L1+ neutrophils in blood and ETA of patients with matched VRI. (F) Spearman’s rank correlation of airway PD-L1+ neutrophils and hypoxemia levels on admission of intubated patients with viral pneumonia. *P < 0.05, **P < 0.01, and ***P < 0.001.
Fig. 2.
Fig. 2.. Dynamics and phenotype of neutrophils during experimental IAV infection.
Wild-type (WT) C57BL/6j mice were intranasally infected with mock or IAV [150 plaque-forming units (PFU)] A/H3N2/Scotland/20/74 strain. Mice were euthanized at indicated time points, and BAL and lungs were harvested. (A) Relative proportion and absolute numbers of neutrophils in airways and lung parenchyma were evaluated by flow cytometry. Representative dot plots of neutrophils in airway and lung parenchyma from mock and IAV-infected mice (6 dpi) are shown in the top. Individual and means ± SEM pooled from three independent experiments are shown in the bottom (8 to 10 mice per group). (B) Relative proportion and absolute numbers of PD-L1+ neutrophils in airways and lung parenchyma were evaluated by flow cytometry. Representative dot plots of PD-L1+ neutrophils in airway and lung parenchyma from mock and IAV-infected mice (6 dpi) are shown in the top. Individual and means ± SEM pooled from three independent experiments are shown in the bottom (8 to 10 mice per group). ns, not significant; *P < 0.05, **P < 0.01, and ***P < 0.001.
Fig. 3.
Fig. 3.. Single-cell RNA sequencing profiling of lung neutrophil subsets from IAV-infected mice.
(A to E) WT C57BL/6j mice were intranasally instilled with IAV (150 PFU) A/H3N2/Scotland/20/74 strain and euthanized at day 11. Lungs were collected and processed before neutrophil sorting based on PD-L1 expression. (A) Representation of the experimental workflow used to generate single-cell RNA sequencing (scRNA-seq) data. (B) Identification of cell clusters using the graph-based Louvain algorithm (resolution = 0.5) on UMAP. Each dot represents one cell (2999 cells). (C) Identity of PD-L1+ and PD-L1 neutrophils projected on the UMAP. (D) Clustermap of neutrophil subsets comparing each pair of clusters using the Pearson’s correlation with hierarchical clustering. (E) Expression of the top 10 marker genes for each cluster identified in (B).
Fig. 4.
Fig. 4.. Morphology, maturation, and life span of lung neutrophilic subsets in IAV-infected mice.
(A to E) WT C57BL/6j mice were intranasally instilled with mock or IAV (150 PFU) A/H3N2/Scotland/20/74 strain. Mice were euthanized, and the whole lungs were collected at 7 dpi. (A) Representative light microscopy pictures of cytospins of purified lung neutrophil subsets. Neutrophil developmental stages were defined on the basis of morphology and depicted in the right (n = 3); ×200, original magnification. [(B) and (C)] Representative dot plots of CD101 (B) or Ki67 (C) expression on lung neutrophils from IAV-infected mice based on PD-L1 expression. Relative proportions of CD101- (B) or Ki67-expressing (C) cells per subset are shown in the right. Individual values and means ± SEM from two independent experiments (four to five mice per group) are shown. (D) Linear projection of cells according to pseudotime score from Monocle3 according to cluster identities. (E) Apoptotic profile of lung neutrophil subsets from IAV-infected mice. A representative dot plot of two independent experiments for both subsets is shown (six mice per group). PI, propidium iodide.
Fig. 5.
Fig. 5.. Phenotype and regulatory functions of lung PD-L1+ neutrophils.
WT C57BL/6j mice were intransally instilled with mock or IAV (150 PFU) A/H3N2/Scotland/20/74 strain. Mice were euthanized, and the whole lungs were collected at indicated time points. (A) Expression of MHC-II on lung neutrophils from IAV-infected mice (7 dpi) was evaluated by flow cytometry. Representative dot plots according to neutrophilic subset is shown. (B) Density plot of “positive” and “negative” regulation of the inflammatory response. (C) Relative proportion of Arg-1–producing neutrophils according to subset and time course of infection. Representative dot plots are shown in the left. Individual values and means ± SEM from two independent experiments (four mice per group per time point) are shown in the right. (D) Levels of MPO produced ex vivo by purified neutrophil subsets (7 dpi) upon short-term PMA stimulation. Individual values and means ± SEM from two independent experiments are shown. (E) Levels of oxidants in neutrophil subsets (7 dpi) measured 5 min after incubation with DHR123. Representative dot plots from one experiment of two are shown. *P < 0.05 and **P < 0.01. (F) PD-L1–mediated suppressive effect of neutrophils from IAV-infected mice (8 dpi) on T cell proliferation. CTV-stained spleen cells from naive mice were cultured with plate-bound anti-CD3 mAbs with or without indicated numbers of neutrophils from IAV-infected mice in the presence of either Ig control or anti–PD-L1 mAb. Proliferation of CD4+ and CD8+ T cells was monitored after 72 hours based on CTV dilution. Representative dot plots showing CTV expression in CD4+ (top) and CD8+ (bottom) T cells are shown in the left. Individual values and means ± SEM of proliferation rate from two independent experiments are depicted in the right. *P < 0.05 and **P < 0.01.
Fig. 6.
Fig. 6.. BM origin of IAV-induced PD-L1+ neutrophils.
WT C57BL/6j mice were intranasally infected with IAV (150 PFU) A/H3N2/Scotland/20/74 strain. Mice were euthanized at indicated time points. (A) Relative proportion of neutrophils (subsets) in BM of IAV-infected mice was evaluated by flow cytometry. Individuals and means ± SEM from three independent experiments are shown (8 to 12 mice per group). (B) Frequency of circulating neutrophils (subsets) of IAV-infected mice was evaluated by flow cytometry. Individuals and means ± SEM from three independent experiments are shown (7 to 12 mice per group). (C) Expression of CD49d on neutrophil subsets from IAV-infected mice (7 dpi) according to PD-L1 expression. Representative histograms of BM (top) and blood (bottom) neutrophilic subsets are shown. (D) Effect of CXCR1/2 inhibition on lung PD-L1+ neutrophils in IAV-infected mice. Representative dot plots of PD-L1+ cells within the BAL (top) and lung parenchyma (bottom) neutrophil pool from IAV-infected mice treated or not with CXCR1/2 inhibitor are represented in the left. Individuals and means ± SEM from two independent experiments are shown (six to nine mice per group) in the right. *P < 0.05, **P < 0.01, and ***P < 0.001.
Fig. 7.
Fig. 7.. IFN-γ primes BM neutrophils for regulatory functions.
(A) Representative dot plots of the relative proportion of PD-L1+ BMN (within total BMN: CD11b+ Ly6G+) differentiated from stem cells isolated from BM of mock-treated or IAV-infected mice (7 dpi) are shown. Means ± SEM at indicated time points from two independent experiments are shown in the right. (B) Representative histograms of Sca-1 expression on BM neutrophil subsets from IAV-infected mice (7 dpi). (C) Expression of CD119 on BM neutrophils according to PD-L1 expression in naive and IAV-infected mice (7 dpi) was evaluated by flow cytometry. Representative dot plots are shown in the left. Individuals and means ± SEM of CD119 expression according to neutrophil subset from two independent experiments are shown (four to eight mice per group) in the right. (D) Relative proportions of PD-L1+ BMN (within total BMN) differentiated from BM stem cells isolated from naive mice during the course of differentiation in the presence of medium or recombinant mIFN-γ. Individuals and means ± SEM at indicated time points from three independent experiments are shown. (E) Expression of Arg-1 by BMN subsets differentiated in the presence or not of rmIFN-γ. Representative dot plots from two independent experiments are shown. (F) Relative proportion of PD-L1+ neutrophils in various tissues of mock or IAV-infected mice (7 dpi) from WT and Ifng−/− mice. Individual values and means ± SEM are shown (three mice per group). *P < 0.05, **P < 0.01, and ***P < 0.001.
Fig. 8.
Fig. 8.. Neutrophil depletion or PD-L1 blockade influence mouse survival and inflammatory response during IAV infection.
(A to G) WT C57BL/6j mice were intransally infected with IAV (150 PFU) A/H3N2/Scotland/20/1974 strain. Mice were treated from 4 dpi and every second day with isotype control or 1A8. (A) Survival was monitored daily (five to seven mice per group). (B) Mice were euthanized on day 8, and lungs were collected. Individuals and means ± SEM of IFN-γ, IL-β, and TNF-α levels in lung homogenates of isotype- or 1A8-treated IAV-infected mice from two independent experiments are shown (9 to 13 mice per group). (C) Individual values and means ± SEM of inflammatory monocytes, monocyte-derived DC, conventional DC, and AM from two independent experiments are shown (9 to 13 mice per group). [(D) to (G)] from 4 dpi and every second day with isotype control or anti–PD-L1 mAb. (D) Survival was monitored daily (12 mice per group). [(E) to (G)] Mice were euthanized on day 8, and lungs were collected. (E) Individuals and means ± SEM of IFN-γ, IL-β, and TNF-α levels in lung homogenates of isotype- or anti–PD-L1–treated IAV-infected mice from two independent experiments are shown (six mice per group). (F) Individual values and means ± SEM of inflammatory monocytes, monocyte-derived DC, conventional DC, AM, and classical neutrophils from two independent experiments are shown (eight mice per group). (G) Unsupervised hierarchical clustering of the 30 genes imputed from transcriptional analysis of individual samples (n = 4 per group). *P < 0.05, **P < 0.01, and ***P < 0.001.

References

    1. Newton A. H., Cardani A., Braciale T. J., The host immune response in respiratory virus infection: Balancing virus clearance and immunopathology. Semin. Immunopathol. 38, 471–482 (2016). - PMC - PubMed
    1. Thompson B. T., Chambers R. C., Liu K. D., Acute respiratory distress syndrome. N. Engl. J. Med. 377, 562–572 (2017). - PubMed
    1. Matthay M. A., Zemans R. L., Zimmerman G. A., Arabi Y. M., Beitler J. R., Mercat A., Herridge M., Randolph A. G., Calfee C. S., Acute respiratory distress syndrome. Nat. Rev. Dis. Primers. 5, 18 (2019). - PMC - PubMed
    1. Ahuja S. K., Manoharan M. S., Lee G. C., McKinnon L. R., Meunier J. A., Steri M., Harper N., Fiorillo E., Smith A. M., Restrepo M. I., Branum A. P., Bottomley M. J., Orrù V., Jimenez F., Carrillo A., Pandranki L., Winter C. A., Winter L. A., Gaitan A. A., Moreira A. G., Walter E. A., Silvestri G., King C. L., Zheng Y.-T., Zheng H.-Y., Kimani J., Blake Ball T., Plummer F. A., Fowke K. R., Harden P. N., Wood K. J., Ferris M. T., Lund J. M., Heise M. T., Garrett N., Canady K. R., Abdool Karim S. S., Little S. J., Gianella S., Smith D. M., Letendre S., Richman D. D., Cucca F., Trinh H., Sanchez-Reilly S., Hecht J. M., Cadena Zuluaga J. A., Anzueto A., Pugh J. A., South Texas Veterans Health Care System COVID-19 team, Abdalla M. I., Adams S. G., Adebayo Y., Agnew J., Ali S., Anstead G., Balmes M., Barker J., Baruch-Bienen D., Bible V., Birdwell A., Braddy S., Bradford S., Briggs H., Corral J. M., Dacus J. J., Danaher P. J., DePaul S. A., Dickerson J., Doanne J., Ehsan A., Elbel S., Escalante M., Escamilla C., Escamilla V., Farrar R., Feldman D., Flores D., Flynn J., Ford D., Foy J. D., Freeman M., Galley S., Garcia J., Garza M., Gilman S., Goel M., Gomez J., Goyal V. K., Grassmuck S., Grigsby S., Hanson J., Harris B., Haywood A., Hinojosa C., Ho T. T., Hopkins T., Horvath L. L., Hussain A. N., Jabur A., Jewell P., Johnson T. B., Lawler A. C., Lee M., Lester C. S., Levine S. M., Lewis H. V., Louder A., Mainor C., Maldonado R., Martinez C., Martinez Y., Maselli D., Mata C., McElligott N., Medlin L., Mireles M., Moreno J., Morneau K., Muetz J., Munro S. B., Murray C., Nambiar A., Nassery D., Nathanson R., Oakman K., O’Rorke J., Padgett C., Pascual-Guardia S., Patterson M., Perez G. L., Perez R., Perez R. III, Phillips R. E., Polk P. B., Pomager M. A., Preston K. J., Proud K. C., Rangel M., Ratcliffe T. A., Reichelderfer R. L., Renz E. M., Ross J., Rudd T., Sanchez M. E., Sanders T., Schindler K. C., Schmit D., Sehgal R. T., Solorzano C., Soni N., Tam W. S., Tovar E. J., Trammell Velasquez S. A., Tyler A. R., Vasquez A., Veloso M. C., Venticinque S. G., Villalpando J. A., Villanueva M., Villegas L., Walker M., Wallace A., Wallace M., Wang E., Wickizer S., Williamson A., Yunes A., Zentner K. H., Agan B. K., Root-Bernstein R., Clark R. A., Okulicz J. F., He W., Immune resilience despite inflammatory stress promotes longevity and favorable health outcomes including resistance to infection. Nat Commun 14, 3286 (2023). - PMC - PubMed
    1. Flerlage T., Boyd D. F., Meliopoulos V., Thomas P. G., Schultz-Cherry S., Influenza virus and SARS-CoV-2: Pathogenesis and host responses in the respiratory tract. Nat. Rev. Microbiol. 19, 425–441 (2021). - PMC - PubMed

Publication types

MeSH terms