. 2024 Oct 11;10(41):eadl4573.
doi: 10.1126/sciadv.adl4573. Epub 2024 Oct 11.

Shank3 mutation impairs glutamate signaling and myelination in ASD mouse model and human iPSC-derived OPCs

Affiliations

Shank3 mutation impairs glutamate signaling and myelination in ASD mouse model and human iPSC-derived OPCs

Inbar Fischer et al. Sci Adv. .

Abstract

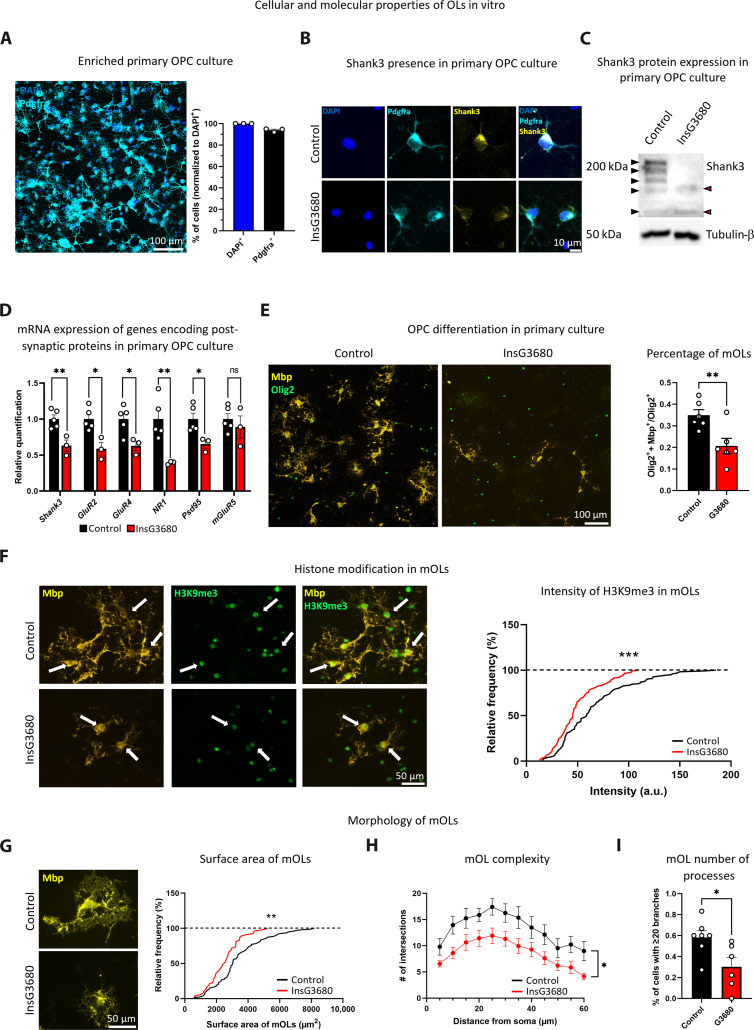
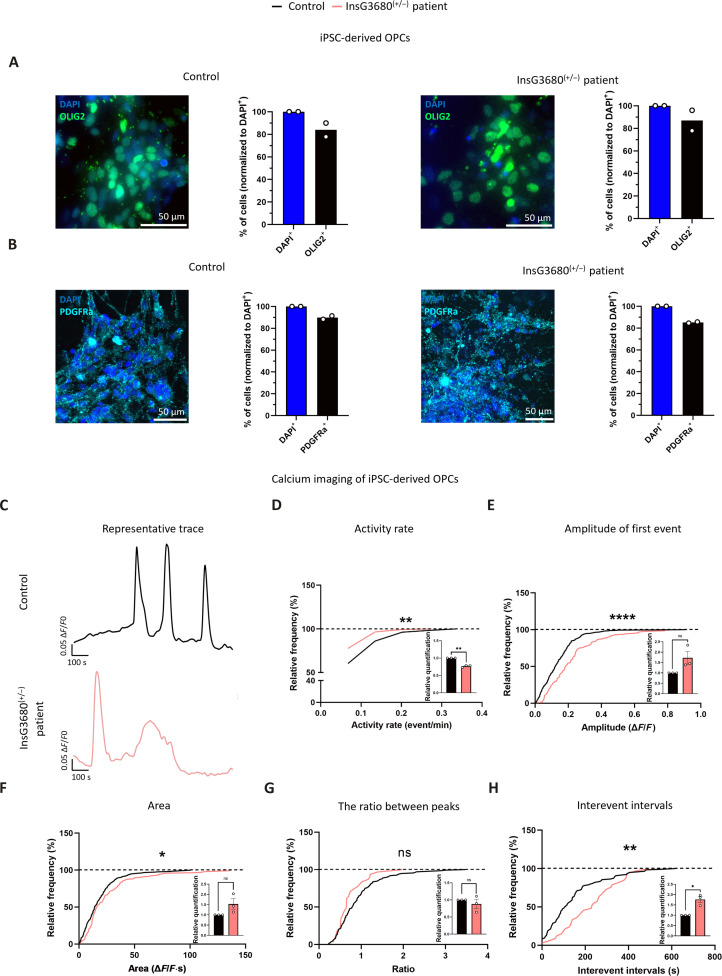
Autism spectrum disorder (ASD) is characterized by social and neurocognitive impairments, with mutations of the SHANK3 gene being prominent in patients with monogenic ASD. Using the InsG3680 mouse model with a Shank3 mutation seen in humans, we revealed an unknown role for Shank3 in postsynaptic oligodendrocyte (OL) features, similar to its role in neurons. This was shown by impaired molecular and physiological glutamatergic traits of InsG3680-derived primary OL cultures. In vivo, InsG3680 mice exhibit significant reductions in the expression of key myelination-related transcripts and proteins, along with deficits in myelin ultrastructure, white matter, axonal conductivity, and motor skills. Last, we observed significant impairments, with clinical relevance, in induced pluripotent stem cell-derived OLs from a patient with the InsG3680 mutation. Together, our study provides insight into Shank3's role in OLs and reveals a mechanism of the crucial connection of myelination to ASD pathology.


Figures

Fig. 1.
Fig. 1.. Reduced expression of transcripts encoding postsynaptic proteins in InsG3680 mouse–derived OPCs and abnormal InsG3680-OL differentiation.
(A) Enriched primary OPC culture (left). Percentage of Pdgfra+ cells out of all cells, as labeled by DAPI (right). (B) Shank3 detection in control Pdgfra+ cells and reduced detection in InsG3680-derived Pdgfra+ cells. (C) Blot showing Shank3 expression in OPC lysate. Black arrowheads indicate control and red arrowheads indicate InsG3680 OPCs Shank3 isoforms. Some of the Shank3 isoforms are expressed by control but not InsG3680-derived OPCs. (D) Significantly reduced mRNA levels of Shank3, GluR2, GluR4, NR1, and Psd95 in InsG3680 mouse–derived OPCs compared to controls. No significant difference in mGluR5 mRNA levels. (E) Immunocytochemistry images showing mOLs (Olig2+ + Mbp+) and OLs (Olig2+) in control and InsG3680 mouse–derived OPCs (left). InsG3680 mice show a significantly lower percentage of mOLs after differentiation (right). (F) H3K9me3 intensity in Mbp+ cells, arrows point to Mbp+ + H3K9me3+ cells, from control and InsG3680 mice (left). H3K9me3 intensity in mOLs from InsG3680 mouse–derived cultures is significantly lower than in controls (right). (G) Control and InsG3680 mOLs (Mbp+ cells) (left). Significantly reduced mOL surface area in InsG3680 mouse–derived cells compared to controls (right). (H) Significantly decreased branching complexity in InsG3680 mouse–derived mOLs compared to controls. (I) A significantly lower percentage of mOLs with 20 or more branches in InsG3680 mouse–derived mOLs compared to controls. ns, nonsignificant. *P < 0.05, **P < 0.01, and ***P < 0.001. Two-tailed t test (D, E, and I), Kolmogorov-Smirnov test (F and G), and repeated measures analysis of variance (ANOVA) (H). Data are shown as means ± SEM (A) n = 3, primary cultures. (D) n = 5, control mice; n = 3 InsG3680 mice. (E) n = 6, control mice; n = 6, InsG3680 mice. (F) n = 122 cells and n = 3, control mice; n = 115 cells and n = 5, InsG3680 mice. (G) n = 79 cells and n = 6, control mice; n = 53 cells and n = 6, InsG3680 mice. (H and I) n = 7, control mice; n = 6, InsG3680 mice. a.u., arbitrary units.
Fig. 2.
Fig. 2.. Impaired calcium signaling in response to glutamate stimulus of InsG3680 mouse–derived OPCs as compared to controls.
(A) The experimental procedure (left) and calcium labeled in OPCs using Fluo-4 (right). An example of the region of interest (ROI) of a cell is circled and pointed in an arrow. (B) Representative traces of the signal generated upon glutamate stimulus in control (black) and InsG3680 mouse–derived OPCs (red). (C) Features that were determined on the basis of the calcium signal. (D) A significantly reduced activity rate of calcium flux was found in InsG3680 mouse–derived OPCs, as compared to controls. (E) A significantly higher amplitude of the first calcium event was measured in InsG3680 mouse–derived OPCs, (F) with no significant differences in the areas under all curves. (G) A significantly smaller ratio between the sizes of peaks was found in InsG3680 mouse–derived OPCs as compared to controls. (H) A significant increase in interevent intervals was measured in InsG3680 mouse–derived OPCs as compared to controls. **P < 0.01 and ***P < 0.001. One sample t test (D to H) and Kolmogorov-Smirnov test (D to H). Data are shown as means ± SEM. (D to F) n = 47 cells from control mice; n = 32 cells from InsG3680 mice. (G) n = 39 events from control OPCs; n = 21 events from InsG3680 OPCs. (H) n = 76 events from control OPCs; n = 32 events from InsG3680 OPCs. (D to H) n = 3, control mice; n = 3, InsG3680 mice (for one-sample t test).
Fig. 3.
Fig. 3.. Reduced sodium currents measured in OPCs from InsG3680 mice, as compared to OPCs from control mice.
(A) Representative image of cells before patch clamp recordings. (B) A representative trace of ionic currents at a depolarization step in control (black) and InsG3680 mouse–derived OPCs (red). Zoomed-in views of the current recordings from (C) control OPCs and (D) InsG3680 mouse–derived OPCs. (E) The sodium current was significantly reduced in InsG3680 mouse–derived OPCs, as compared to control OPCs. (F) Fast and (G) slow potassium currents were not significantly different between InsG3680 and control mouse–derived OPCs. *P < 0.05. Repeated measures ANOVA (E to G). Data are shown as means ± SEM. (E to G) n = 5, control OPCs; n = 8, InsG3680 OPCs.
Fig. 4.
Fig. 4.. Altered myelination-related properties in young adult InsG3680 mice at the cellular and molecular levels.
(A) Representative image of Olig2+, CC1+, Pdgfra+, and Ki67+ cells, with arrows pointing at Olig2+ + CC1+ and Pdgfra+ + Ki67+ colocalized cells. (B) A significantly increased number of Olig2+ cells with no significant difference in the number of Olig2+ + CC1+, Pdgfra+, and Pdgfra+ + Ki67+ cells in the frontal cortex of InsG3680 P30 mice, as compared to controls. (C) A significant increase in the number of Olig2+ cells along with a trend of increase in the number of Olig2+ + CC1+ cells in the striatum was found in P30 InsG3680 mice, as compared to controls. No significant difference was found in Pdgfra+ cell number, although the number of Pdgfra+ + Ki67+ was significantly lower in P30 InsG3680 mice, as compared to controls. Significantly reduced Mbp, Plp1, and Mog mRNA expression levels in both the (D) frontal cortex and (E) striatum of P30 InsG3680 mice were measured, as compared to controls. Significantly reduced Mbp and Plp1 protein expression levels were measured in the crude myelin fraction of P30 InsG3680 mice in the (F) frontal cortex and (G) striatum, as compared to controls. *P < 0.05, **P < 0.01, and ***P < 0.001. Two-tailed t test (B to E), Mann-Whitney (B, Olig2+), and one sample t test (F and G). Data are shown as means ± SEM. (B) n = 14, control; n = 9 InsG3680 mice for Olig2+. (B) n = 14, control; n = 8 InsG3680 mice for Olig2++CC1+ cells. (B) n = 13, control mice; n = 9 InsG3680 mice for Pdgfra+ and Pdgfra++Ki67+. (C) n = 13, control mice; n = 9 InsG3680 mice. (D and E) n = 9, control mice; n = 9, InsG3680 mice. (E) n = 8, control mice, n = 9, InsG3680 mice for Plp1. (F) n = 4, control mice; n = 4, InsG3680 mice, for Mbp. (F) n = 6, control mice; n = 7, InsG3680 mice, for Plp1. (G) n = 5, control mice; n = 5, InsG3680 mice, for Mbp. (G) n = 7, control mice; n = 6, InsG3680 mice, for Plp1.
Fig. 5.
Fig. 5.. Altered myelination-related properties in adult InsG3680 mice at the cellular and molecular levels.
(A) No significant difference between groups in the number of Olig2+, Olig2+ + CC1+, Pdgfra+, and Pdgfra+ + Ki67+ cells in the frontal cortex of P90 mice. (B) No significant difference between groups in the number of Olig2+ and Olig2+ + CC1+ cells in the striatum of P90 mice. A significant decrease in Pdgfra+ cell number in P90 InsG3680 mice, as compared to controls, with no significant difference between groups in the number of Pdgfra+ + Ki67+ cells. (C) Significantly reduced Mbp and Plp1 and a similar trend in Mog mRNA expression levels in the frontal cortex but not in the (D) striatum of P90 InsG3680 mice compared to controls. (E) Significantly reduced protein expression levels of Plp1 but not Mbp in the crude myelin fraction isolated from the frontal cortex of P90 InsG3680 mice, as compared to controls. (F) No significant difference was found between groups in the protein expression levels of Mbp and Plp1 in the crude myelin fraction isolated from the striatum. *P < 0.05 and **P < 0.01. Two-tailed t test (A to D), Mann-Whitney (C, Mbp), and one sample t test (E and F). Data are shown as means ± SEM. (A) n = 11, control mice; n = 11, InsG3680 mice for Olig2+ and Olig2++CC1+. (A) n = 14, control mice; n = 15, InsG3680 mice for Pdgfra+ and Pdgfra++Ki67+. (B) n = 12, control mice; n = 11, InsG3680 mice for Olig2+ and Olig2+ + CC1+. (B) n = 14, control mice; n = 15, InsG3680 mice for Pdgfra+. (B) n = 13, control mice; n = 15, InsG3680 mice for Pdgfra+ + Ki67+. (C) n = 15, control mice; n = 15, InsG3680 mice for Mbp. (C) n = 9, control; n = 11, InsG3680 mice for Plp1. (C) n = 10, control mice; n = 12, InsG3680 mice for Mog. (D) n = 8, control mice; n = 8, InsG3680 mice. (E) n = 6, control mice; n = 6, InsG3680 mice for Mbp. (E) n = 6, control mice; n = 5, InsG3680 mice for Plp1. (F) n = 5, control; n = 5, InsG3680 mice.
Fig. 6.
Fig. 6.. Reduced expression levels of synaptic and key myelination proteins in a pure myelin fraction, along with myelin ultrastructure deficits in adult InsG3680 mice.
(A) Significant reduction in the protein expression levels of Shank3, Psd95, and NR1 in a pure myelin fraction from the whole brain of P90 InsG3680 mice, as compared to controls. (B) Different Shank3 isoforms (marked in arrowheads) are detected in pure and crude myelin fractions from whole brain of P90 control mice. (C) Significant reduction in the protein expression levels of Mbp and Plp1 proteins in a pure myelin fraction from the whole brain of P90 InsG3680 mice, as compared to controls. (D) Representative images of myelin ultrastructure from both genotypes (left). Significantly reduced g-ratio [axon diameter/(axon diameter + myelin thickness)] (right) and (E) decreased axon diameter in P90 InsG3680 mice, as compared to controls. (F) Representative images of impaired ultrastructure (red) in InsG3680 mice compared to controls (left). Significantly increased percentage area of myelin ultrastructure abnormalities in the myelin sheaths of P90 InsG3680 mice, as compared to controls (right). *P < 0.05, **P < 0.01, and ****P < 0.0001. One sampled t test (A and C), linear regression (D), two-tailed t test (D to F), and Kolmogorov-Smirnov (E). Data are shown as means ± SEM. (A and C) n = 6, control mice; n = 6, InsG3680 mice. (A) n = 5, control mice; n = 5, InsG3680 mice for Psd95. (D and E) n = 679 axons, control mice; n = 513 axons, InsG3680 mice. (D to F) n = 6, control mice; n = 3, InsG3680 mice.
Fig. 7.
Fig. 7.. Reduced brain-wide connectivity, abnormal CC axonal conductivity, and motor skill deficits in InsG3680 mice.
(A) Connectogram depicting the significant reduction in FA values of tracts (left) in numerous brain regions and in the number of tracts (right) in P90 InsG3680 mice, as compared to controls. The scale bar indicates the level of significance, ranging from light to dark lines. Light lines represent significance levels of P < 0.05 and close to this threshold, while dark lines indicate higher levels of significance. (B) P90 InsG3680 mice exhibit a significantly lower number of tracts in the CC than do controls. (C) Schematic representation of CAP recordings in the CC, with representative CAP traces obtained from control (black) and InsG3680 (red) mice. (D) No significant difference in the N1 amplitude of InsG3680 mice and controls. (E) A significantly higher N2 amplitude was measured in InsG3680 mice, as compared to controls. (F) Significant reduction in latency to fall in the rotarod test, along with (G) significantly reduced grip strength in the forelimbs (H) but not in the hindlimbs of InsG3680 mice, as compared to controls. *P < 0.05 and **P < 0.01. Two-tailed t test (A, B, and D to H) and repeated measures ANOVA (D and E). Data are shown as means ± SEM. (A) n = 19, control mice; n = 19, InsG3680 mice. (B) n = 18, control mice; n = 19, InsG3680 mice. (D and E) n = 4, control mice; n = 4, InsG3680 mice. (F and G) n = 15, control mice; n = 14, InsG3680 mice. (H) n = 15, control mice; n = 15, InsG3680 mice.
Fig. 8.
Fig. 8.. Impaired calcium signaling in response to glutamate stimulus of human iPSC-derived OPCs from an individual presenting a heterozygous InsG3680 SHANK3 mutation.
Enriched human iPSC-derived OPC cultures. (A) Representative images of OLIG2+ cells in iPSC-derived OPC cultures. Percentage of OLIG2+ out of all cells in control cultures (left) and InsG3680(+/−) patient cultures (right). (B) Representative images of PDGFRa+ cells in iPSC-derived OPC cultures. Percentage of PDGFRa+ cells out of all cells in control cultures (left) and InsG3680(+/−) patient cultures (right). (C) Representative traces of the signal generated upon glutamate stimulus in control (black) and InsG3680(+/−) patient–derived OPCs (pink). (D) A significantly reduced activity rate of calcium flux was found in InsG3680(+/−) patient–derived OPCs, as compared to controls. (E) A significantly higher amplitude of the first calcium event was measured in InsG3680(+/−) patient–derived OPCs, (F) with a significantly larger area under all curves, compared to the control. (G) No significant difference was found in the ratio between the sizes of peaks between the two groups. (H) A significant increase in interevent intervals was measured in InsG3680(+/−) patient–derived OPCs compared to controls. *P < 0.05, **P < 0.01, and ****P < 0.0001. Kolmogorov-Smirnov test (D to H) and one sample t test (D to H). Data are shown as means ± SEM. (D to F) n = 345 cells from control; n = 143 cells from InsG3680(+/−) patient OPCs. (G) n = 136 events from control; n = 31 events from InsG3680(+/−) patient OPCs. (H) n = 118 events from control; n = 33 events from InsG3680(+/−) patient OPCs. (D to H) n = 3, control; n = 3 InsG3680(+/−) patient OPCs (for one-sample t test).
Fig. 9.
Fig. 9.. Increased expression of Psd95 and NR1 following SHANK3 restoration in InsG3680 primary OPC cultures.
(A) Representative images of SHANK3 expression in transfected InsG3680 primary OPC culture. (B) Representative images of SHANK3 and Psd95 expression (left). (a) A magnified view of the dashed square shows colocalization between SHANK3 and Psd95, with the Pearson’s coefficient (r) indicating the correlation between the two and the Manders’ coefficient (M1) indicating the overlap of Psd95 with SHANK3. (b) A binary image showing colocalized regions of both proteins (white). Line scan graphs showing the immunofluorescence intensity along the arrow of SHANK3 and Psd95 (right). (C) A significant correlation was found between SHANK3 and Psd95 expression levels. (D) A significant increase in Psd95 expression levels in transfected cells in comparison to untransfected cells. (E) Representative image of SHANK3 and NR1 expression (left). Line scan graphs showing the immunofluorescence intensity along the arrow of SHANK3 and NR1 (right). (F) A significant correlation was found between SHANK3 and NR1 expression levels. (G) A significant increase in NR1 expression levels in transfected cells in comparison to untransfected cells. *P < 0.05. One-sample t test (D and G) and Spearman’s correlation test (C and F). Data are shown as means ± SEM. (C) n = 1378 pixels of SHANK3+ + Psd95+ image. (D) n = 16 nontransfected cells; n = 5 transfected cells. (F) n = 1315 pixels of SHANK3+ + NR1+ image. (G) n = 15 nontransfected cells; n = 3 transfected cells.

References

    1. Barak B., Feng G., Neurobiology of social behavior abnormalities in autism and Williams syndrome. Nat. Neurosci. 19, 647–655 (2016). - PMC - PubMed
    1. Amaral D. G., Schumann C. M., Nordahl C. W., Neuroanatomy of autism. Trends Neurosci. 31, 137–145 (2008). - PubMed
    1. Lord C., Cook E. H., Leventhal B. L., Amaral D. G., Autism spectrum disorders. Neuron 28, 355–363 (2000). - PubMed
    1. Huguet G., Ey E., Bourgeron T., The genetic landscapes of autism spectrum disorders. Annu. Rev. Genom. Hum. Genet. 14, 191–213 (2013). - PubMed
    1. Satterstrom F. K., Kosmicki J. A., Wang J., Breen M. S., De Rubeis S., An J. Y., Peng M., Collins R., Grove J., Klei L., Stevens C., Reichert J., Mulhern M. S., Artomov M., Gerges S., Sheppard B., Xu X., Bhaduri A., Norman U., Brand H., Schwartz G., Nguyen R., Guerrero E. E., Dias C., Betancur C., Cook E. H., Gallagher L., Gill M., Sutcliffe J. S., Thurm A., Zwick M. E., Børglum A. D., State M. W., Cicek A. E., Talkowski M. E., Cutler D. J., Devlin B., Sanders S. J., Roeder K., Daly M. J., Buxbaum J. D., Large-scale exome sequencing study implicates both developmental and functional changes in the neurobiology of autism. Cell 180, 568–584.e23 (2020). - PMC - PubMed

Publication types

MeSH terms