. 2024 Oct 11;10(41):eadk4606.
doi: 10.1126/sciadv.adk4606. Epub 2024 Oct 11.

Generalized contact matrices allow integrating socioeconomic variables into epidemic models

Affiliations

Generalized contact matrices allow integrating socioeconomic variables into epidemic models

Adriana Manna et al. Sci Adv. .

Abstract

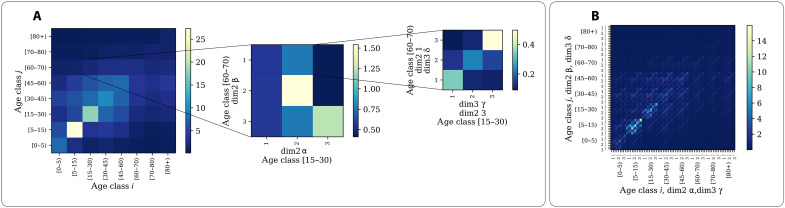
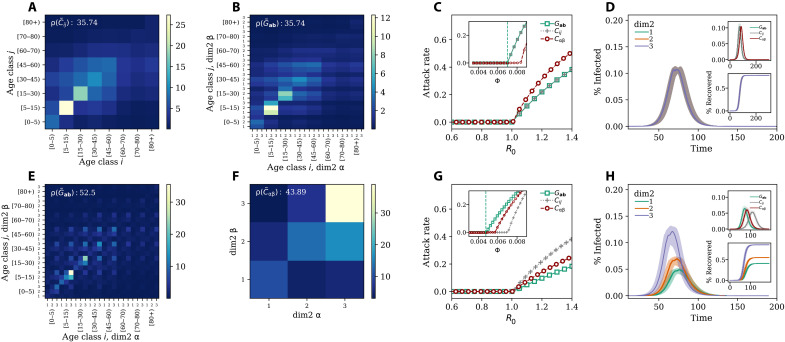
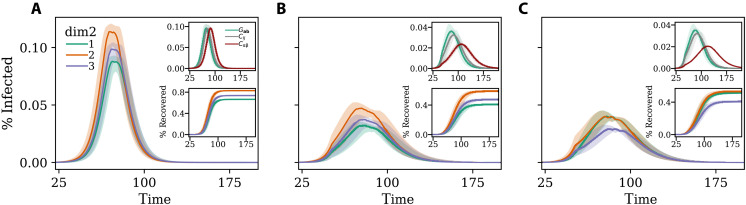
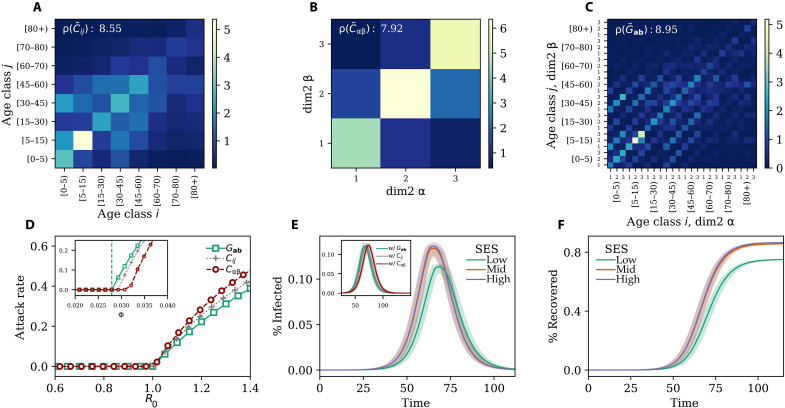
Variables related to socioeconomic status (SES), including income, ethnicity, and education, shape contact structures and affect the spread of infectious diseases. However, these factors are often overlooked in epidemic models, which typically stratify social contacts by age and interaction contexts. Here, we introduce and study generalized contact matrices that stratify contacts across multiple dimensions. We demonstrate a lower-bound theorem proving that disregarding additional dimensions, besides age and context, might lead to an underestimation of the basic reproductive number. By using SES variables in both synthetic and empirical data, we illustrate how generalized contact matrices enhance epidemic models, capturing variations in behaviors such as heterogeneous levels of adherence to nonpharmaceutical interventions among demographic groups. Moreover, we highlight the importance of integrating SES traits into epidemic models, as neglecting them might lead to substantial misrepresentation of epidemic outcomes and dynamics. Our research contributes to the efforts aiming at incorporating socioeconomic and other dimensions into epidemic modeling.


Figures

Fig. 1.
Fig. 1.. Generalized contact matrices.
(A) Schematic representation of generalized contact matrices. We can transform a K × K age-structured contact matrix C (first matrix on the left) into a generalized matrix G with m + 1 dimensions. Such transformation can be done according to different generalization schemes discussed in Materials and Methods and the Supplementary Materials. In the plot, we consider m = 2. Hence, the second matrix describes the stratification of contacts across a second dimension, i.e., α, β ∈ [1,2,3]. The third matrix describes a further stratification, i.e., γ, δ ∈ [1,2,3]. For simplicity, we show the stratification across the additional dimensions only for one entry of the lower level, respectively. (B) Example of a flattened generalized contact matrix including three dimensions G (72 × 72).
Fig. 2.
Fig. 2.. Impact of generalized contact matrices on epidemic spreading.
(A) Example of a classic age contact matrix C (8 × 8); (B) and (E) generalized contact matrices with an additional dimension with three groups G (24 × 24) in the case of random mixing (B) and (E) assortative mixing in the second dimension; (F) depicts the case when we integrate the generalized contact matrix over all age classes. The ρ values indicate the spectral radius corresponding to each matrix. In (C), we show the attack rate as a function of R0 (main figure) and disease transmissibility (inset). In (D), we show, in the case of random mixing, the prevalence (main figure and top inset) and the fraction of recovered (bottom inset) as function of time. The colored lines and shaded areas in the main panel and in the bottom inset represent, respectively, the prevalence and fraction of recovered individuals in the three groups of the additional category (i.e., dim2); (G) and (H) are as the previous two plots but in case of assortative mixing with different levels of activity. Results refer to the median of 500 runs. Epidemiological parameters: Γ = 0.25, Ψ = 0.4, and R0 = 2.7. Simulations start with a number I0 = 100 of initial infectious seeds.
Fig. 3.
Fig. 3.. Modeling the adoption of NPIs.
Disease prevalence in (A) baseline scenario (B) and (C) with NPIs introduced at t* = 50 that induce a reduction of 35% in total number of contacts with respect to the baseline scenario. In the case of (B), the three groups reduce the number of contacts equally, while in (C), the NPIs induce a redistribution of the number of contacts. Curves in the main plot indicate the prevalence for the three groups of the additional dimension. The top inset shows the prevalence for models featuring generalized contact matrices (green line), standard age-stratified contact matrices (gray line), and contact matrices stratified by the additional dimension (red line). The bottom inset shows the fraction of recovered as a function of time for the three groups of the additional dimension. Results refer to the median of 500 runs with confidence intervals. Epidemiological parameters: Γ = 0.25, Ψ = 0.4, and R0 = 2.7. Simulations start with I0 = 100 initial infectious seeds.
Fig. 4.
Fig. 4.. Empirical generalized contact matrices.
(A) Age contact matrix C (8 × 8); (B) SES contact matrix Cαβ (3 × 3) and (C) generalized contact matrix with age and SES G (24 × 24); (D) attack rate as a function of R0 (main figure) and transmissibility (inset); (E) disease prevalence in different SES groups (main figure) and different representation of the contact patterns (inset); (F) fraction of recovered individuals in different SES groups. In (A) to (C), ρ indicates the corresponding spectral radius. Results in (D) and (E) refer to the median of 500 runs. Epidemiological parameters: Γ = 0.25, Ψ = 0.4, and R0 = 2.7. Simulations start with I0 = 100 initial infectious seeds. The matrices have been computed using the contact diaries coming from the MASZK data collected in Hungary during June 2022.

References

    1. Edmunds W. J., O’callaghan C. J., Nokes D. J., Who mixes with whom? A method to determine the contact patterns of adults that may lead to the spread of airborne infections. Proc. Biol. Sci. 264, 949–957 (1997). - PMC - PubMed
    1. Mossong J., Hens N., Jit M., Beutels P., Auranen K., Mikolajczyk R., Massari M., Salmaso S., Tomba G. S., Wallinga J., Heijne J., Sadkowska-Todys M., Rosinska M., Edmunds W. J., Social contacts and mixing patterns relevant to the spread of infectious diseases. PLOS Med. 5, e74 (2008). - PMC - PubMed
    1. Prem K., Cook A. R., Jit M., Projecting social contact matrices in 152 countries using contact surveys and demographic data. PLOS Comput. Biol. 13, e1005697 (2017). - PMC - PubMed
    1. Rohani P., Zhong X., King A. A., Contact network structure explains the changing epidemiology of pertussis. Science 330, 982–985 (2010). - PubMed
    1. Mistry D., Litvinova M., Pastore A., Piontti Y., Chinazzi M., Fumanelli L., Gomes M. F. C., Haque S. A., Liu Q.-H., Mu K., Xiong X., Halloran M. E., Longini I. M., Merler S., Ajelli M., Vespignani A., Inferring high-resolution human mixing patterns for disease modeling. Nat. Commun. 12, 323 (2021). - PMC - PubMed

Publication types

LinkOut - more resources