. 2024 Nov 12;19(11):1548-1563.
doi: 10.1016/j.stemcr.2024.09.006. Epub 2024 Oct 10.

Accelerated mitochondrial dynamics promote spermatogonial differentiation

Affiliations

Accelerated mitochondrial dynamics promote spermatogonial differentiation

Zhaoran Zhang et al. Stem Cell Reports. .

Abstract

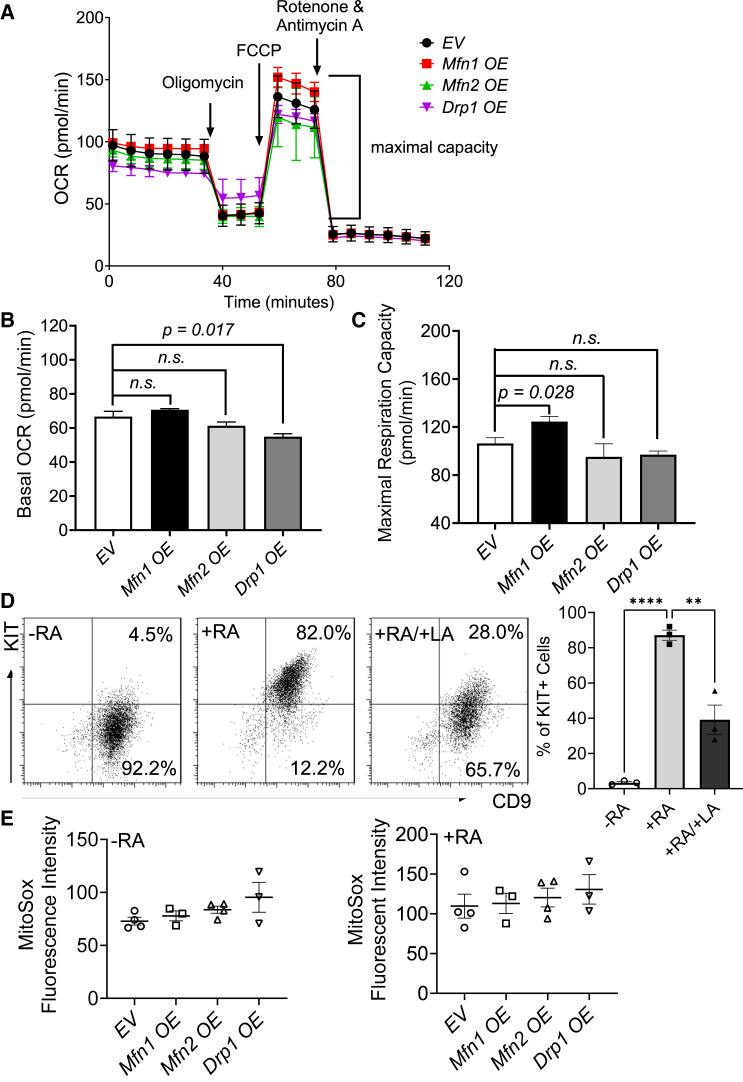
At different stages of spermatogenesis, germ cell mitochondria differ remarkably in morphology, architecture, and functions. However, it remains elusive how mitochondria change their features during spermatogonial differentiation, which in turn impacts spermatogonial stem cell fate decision. In this study, we observed that mitochondrial fusion and fission were both upregulated during spermatogonial differentiation. As a result, the mitochondrial morphology remained unaltered. Enhanced mitochondrial fusion and fission promoted spermatogonial differentiation, while the deficiency in DRP1-mediated fission led to a stage-specific blockage of spermatogenesis at differentiating spermatogonia. Our data further revealed that increased expression of pro-fusion factor MFN1 upregulated mitochondrial metabolism, whereas DRP1 specifically regulated mitochondrial permeability transition pore opening in differentiating spermatogonia. Taken together, our findings unveil how proper spermatogonial differentiation is precisely controlled by concurrently accelerated and properly balanced mitochondrial fusion and fission in a germ cell stage-specific manner, thereby providing critical insights about mitochondrial contribution to stem cell fate decision.

Keywords: DRP1; MFN1; mitochondrial dynamics; spermatogonial differentiation; spermatogonial stem cells.


Conflict of interest statement

Declaration of interests The authors declare no competing interests.

Figures

Figure 1
Figure 1
Mitochondrial dynamics were upregulated during spermatogonial differentiation (A) Mitochondrial architecture was not altered in undifferentiated (SPG) vs. RA-induced differentiating spermatogonia (dSPG), as examined by TEM and mitochondrial number per cell (the right panel) calculated from more than 24 cells per group. (B) IHF staining was performed on testes expressing mitochondrion-localized Dendra2 GFP from 4-week mice with antibodies against PLZF (red) and STRA8 (gray), counterstained with the nuclear dye DAPI. Scale bar: 20 μm. The insert shows a blow-up image of a representative region. Mitochondrial signals were not obviously altered in PLZF+ SPG vs. RA-induced dSPG. (C) The mtDNA copy number was not significantly altered in cultured SPG vs. dSPG (the left panel) or in CD9+/KIT− SPG vs. KIT+ dSPG from P12 mouse testes sorted by flow cytometry (the right panel), as measured by real-time PCR. Pecam, a nuclear DNA-coded gene, was used as the single-copy control. n = 3. (D and E) The transcript levels measured by real-time RT-PCR (D) and protein expression determined by western blots (E). Mitochondrial dynamics regulators were upregulated in RA-induced dSPG, compared to those of SPG. n = 4; ∗∗∗: p < 0.001. (F) Increased mitochondrial fusion and fission during spermatogonial differentiation were detected by confocal microscopy. PhAM; Ddx4-Cre spermatogonia were induced to differentiate by RA, and the 3D mitochondrial images in live cells were acquired for 6 min. The events of fusion and fission were quantified by changes of mitochondrial volume over time. n = 10. (A, C, E–F) Data are presented as mean ± SEM, n.s., no statistical significance.
Figure 2
Figure 2
Deficiency of mitochondrial fission in germ cells leads to male infertility (A) The expression of DRP1 protein was not detected in DDX4+ germ cells from P14 mouse Drp1 cKO testis, as analyzed by IHF staining with antibodies against DRP1 and DDX4, counterstained with DAPI. Scale bar: 25 μm. (B) Mitochondrial architecture was examined by TEM on testicular sections from Drp1f/+ and Drp1 cKO mice at P7 and P14. Orange arrows point to IMC in spermatogonia. Mitochondria were enlarged in Drp1 cKO germ cells. (C) The morphology of control and Drp1 cKO testes at P14 and P21. The size of testes was decreased in Drp1 cKO mice. (D) Histological studies on Drp1f/- and Drp1 cKO testis from mice at P14 and P21. Germ cells were reduced in Drp1 cKO mice. Scale bar: 50 μm. (E) Histology on Drp1f/- and Drp1 cKO testis and epididymis sections from adult mice. No sperm were detected in Drp1 cKO mice. Scale bar: 25 μm.
Figure 3
Figure 3
Reduced mitochondrial dynamics block spermatogonial differentiation (A) The protein expression of PLZF and DDX4 was analyzed by IHF staining on mouse testes at P14 and P21 with antibodies against PLZF and DDX4, counterstained with DAPI. PLZF+ undifferentiated spermatogonia were not altered upon Drp1 cKO. (B) IHF assays were performed on testicle sections from Drp1 cKO mice and Drp1f/+ littermates at P21 with antibodies against SYCP3 and DDX4, counterstained with DAPI. Significantly decreased SYCP3+ spermatocytes were detected in Drp1 cKO testes. (A and B) Scale bar: 25 μm. (C) Percentage of CD9+/KIT− undifferentiated spermatogonia and KIT+ differentiating spermatogonia from P14 Drp1 cKO and Drp1f/+ mice was determined by flow cytometry. Decreased KIT+ differentiating spermatogonia were detected in Drp1 cKO mice. n = 5. (D) Undifferentiated and differentiating spermatogonia in the absence (−RA) or presence (+RA) of RA were analyzed via flow cytometry upon knockdown (KD) of the key regulators of mitochondrial dynamics. Decreased KIT+ spermatogonia were detected upon reduced mitochondrial fusion and fission. Representative flow cytometry plots were shown, with graphs below summarizing results from ≥4 independent experiments. (E) Reduced expression of differentiation markers in differentiating spermatogonia was detected by real-time RT-PCR upon knockdown of key mitochondrial dynamics regulators. n = 3. : p < 0.05;∗∗: p < 0.01. n.s., no statistical significance. (D and E) SCR, scrambled control shRNA. (C–E) Data were presented as mean ± SEM.
Figure 4
Figure 4
Accelerated mitochondrial dynamics promote spermatogonial differentiation (A) The cell growth curve of undifferentiated spermatogonia upon overexpressing (OE) key regulators of mitochondrial fusion and fission over a 25-day culture. n = 3. (B) Spermatogonial marker gene expression in four groups from (A) was not altered upon upregulated mitochondrial dynamics regulators, as analyzed by real-time RT-PCR. n = 3. n.s., no statistical significance. (C and D) Flow cytometry analyses on four groups from (A) in the absence (−RA) or presence (+RA) of RA at day 8 post lentiviral infection to enforce the expression of mitochondrial dynamics regulators. Representative flow cytometry dot plots were shown (C), with graphs demonstrating the percentages of KIT+ differentiating spermatogonia from ≥6 independent experiments (D). KIT+ dSPG were increased upon upregulating mitochondrial dynamics regulators. (E) Expression of marker genes indicating differentiation was increased in spermatogonia with upregulated mitochondrial dynamics regulators following RA treatment for 48 h, as analyzed by real-time RT-PCR. n = 3. (A–E) Data are presented as mean ± SEM. EV, empty vector control.
Figure 5
Figure 5
Enhanced MFN1 expression increases mitochondrial metabolism in differentiating spermatogonia (A–C) Oxygen consumption rate (OCR) (A) was measured in MFN1-, MFN2-, or DRP1-overexpressing spermatogonia after RA treatment for 48 h using a Seahorse XFe96 flux analyzer, with an empty vector as a control. Mitochondrial basal OCR (B) or maximal respiratory capacity (C) was compared across four groups. MFN1 increased maximal respiratory capacity while DRP1 reduced mitochondrial basal OCR. (D) The formation of KIT+ differentiating spermatogonia upon induction by RA with or without treatment of alpha-lipoic acid (LA) for 48 h was determined using flow cytometry, with DMSO as a vehicle control. Representative flow cytometry dot plots were shown, with the bar graph demonstrating the percentages of KIT+ differentiating spermatogonia. n = 3. (E) Mitochondrial ROS level was measured by flow cytometry on MFN1-, MFN2-, or DRP1-overexpressing spermatogonia without RA treatment (the left panel) and after 48-h RA treatment (the right panel). No statistical significance across all four groups. (A–E) Data are presented as mean ± SEM. n ≥ 3. n.s., no statistical significance.
Figure 6
Figure 6
DRP1 regulates mPTP opening during spermatogonial differentiation (A) The mPTP opening status was measured in CD90+/KIT− undifferentiated and KIT+ differentiating spermatogonia from P14 (the left panel) and 8-week-old mouse testes (the right panel) using flow cytometry. Low calcein fluorescent intensity in KIT+ differentiating spermatogonia represents more mPTP opening. (B and C) Mitochondrial membrane potential (B) and Ca2+ level (C) were analyzed by flow cytometry on the CD90+/KIT− undifferentiated and KIT+ differentiating spermatogonia collected from P14 testes. MFI, mean of fluorescent intensity. (D) The mPTP opening was examined in cultured undifferentiated spermatogonia and RA-induced differentiating spermatogonia. (B–D) Decreased MMP and increased Ca2+ level were detected in differentiating spermatogonia, compared to undifferentiated spermatogonia. (E and F) The mPTP opening was measured by flow cytometry on CD9+/KIT− undifferentiated spermatogonia (E) and CD9+/KIT+ differentiating spermatogonia upon RA induction (F) in DRP1-, MFN1-, or MFN2-overexpressing (OE) cells. Reduced calcein fluorescent intensity (i.e., more mPTP opening) was detected in dSPG upon DRP1 upregulation. (G) The mPTP opening was measured by flow cytometry on CD9+/KIT− undifferentiated spermatogonia and CD9+/KIT+ differentiating spermatogonia from Drp1 cKO mice and Drp1f/+ littermate controls at P14. Increased calcein fluorescent intensity (i.e., reduced mPTP opening) was detected in KIT+ dSPG upon Drp1 conditional knockout. (A–G) Data are presented as mean ± SEM. n ≥ 3. n.s., no statistical significance.

References

    1. Alexander C., Votruba M., Pesch U.E., Thiselton D.L., Mayer S., Moore A., Rodriguez M., Kellner U., Leo-Kottler B., Auburger G., et al. OPA1, encoding a dynamin-related GTPase, is mutated in autosomal dominant optic atrophy linked to chromosome 3q28. Nat. Genet. 2000;26:211–215. - PubMed
    1. Anderson E.L., Baltus A.E., Roepers-Gajadien H.L., Hassold T.J., De Rooij D.G., Van Pelt A.M.M., Page D.C. Stra8 and its inducer, retinoic acid, regulate meiotic initiation in both spermatogenesis and oogenesis in mice. Proc. Natl. Acad. Sci. USA. 2008;105:14976–14980. - PMC - PubMed
    1. Le Belle J.E., Orozco N.M., Paucar A.A., Saxe J.P., Mottahedeh J., Pyle A.D., Wu H., Kornblum H.I. Proliferative neural stem cells have high endogenous ROS levels that regulate self-renewal and neurogenesis in a PI3K/Akt-dependant manner. Cell Stem Cell. 2011;8:59–71. - PMC - PubMed
    1. Bertolini I., Keeney F., Altieri D.C. Protocol for assessing real-time changes in mitochondrial morphology, fission and fusion events in live cells using confocal microscopy. STAR Protoc. 2021;2 - PMC - PubMed
    1. Buaas F.W., Kirsh A.L., Sharma M., McLean D.J., Morris J.L., Griswold M.D., De Rooij D.G., Braun R.E. Plzf is required in adult male germ cells for stem cell self-renewal. Nat. Genet. 2004;36:647–652. - PubMed

Publication types

MeSH terms

Substances

LinkOut - more resources