. 2024 Oct 12;15(1):8822.
doi: 10.1038/s41467-024-53085-9.

Zika viruses encode 5' upstream open reading frames affecting infection of human brain cells

Affiliations

Zika viruses encode 5' upstream open reading frames affecting infection of human brain cells

Charlotte Lefèvre et al. Nat Commun. .

Abstract

Zika virus (ZIKV), an emerging mosquito-borne flavivirus, is associated with congenital neurological complications. Here, we investigate potential pathological correlates of virus gene expression in representative ZIKV strains through RNA sequencing and ribosome profiling. In addition to the single long polyprotein found in all flaviviruses, we identify the translation of unrecognised upstream open reading frames (uORFs) in the genomic 5' region. In Asian/American strains, ribosomes translate uORF1 and uORF2, whereas in African strains, the two uORFs are fused into one (African uORF). We use reverse genetics to examine the impact on ZIKV fitness of different uORFs mutant viruses. We find that expression of the African uORF and the Asian/American uORF1 modulates virus growth and tropism in human cortical neurons and cerebral organoids, suggesting a potential role in neurotropism. Although the uORFs are expressed in mosquito cells, we do not see a measurable effect on transmission by the mosquito vector in vivo. The discovery of ZIKV uORFs sheds new light on the infection of the human brain cells by this virus and raises the question of their existence in other neurotropic flaviviruses.


Conflict of interest statement

The authors declare no competing interests.

Figures

Fig. 1
Fig. 1. ZIKV RNA synthesis and translation.
A Western blot analysis of ZIKV E protein and GAPDH in Vero and U251 cells infected with American isolate PE243 and African isolate Dak84 (MOI:3) for 24 h. GAPDH was used as a loading control. Molecular masses (kDa) are indicated on the left. Infections were performed in triplicate with similar results. B Map of the 10,807-nt ZIKV/Brazil/PE243/2015 genome. The 5′ and 3′ UTRs are in black, and the polyprotein ORF is in pale blue with subdivisions showing mature cleavage products. Histograms show the read densities, in reads per million mapped reads (RPM), of Ribo-Seq (red) and RNA-Seq (green truncated at 100 RPM for better visualisation) reads at 24 h p.i. (repeat 1) in Vero cells pre-treated with CHX. The positions of the 5′ ends of reads are plotted with a +12 nt offset to map (for RPFs) approximate P-site positions. Negative-sense reads are shown in dark blue below the horizontal axis. In light blue, the translational efficiency (TE) is calculated as the positive-sense Ribo-Seq/RNA-Seq ratio. Source data are provided as a Source Data file.
Fig. 2
Fig. 2. ZIKV 5′ region.
The 5′ region of the ZIKV American isolate PE243 genome shows two non-AUG uORFs in Vero cells pre-treated with CHX (A), flash-frozen Vero cells (B, upper panel) and flash-frozen U251 cells (B, lower panel). Note that in order to visualise RPFs across the uORFs properly, the y-axis has been truncated at 10 RPM for the Ribo-Seq samples for Vero cells and 3 RPM for U251 cells, leaving some RPF counts, mainly for the main ORF, off-scale. C The 5′ region of the ZIKV African isolate Dak84 genome shows the African uORF in flash-frozen Vero (upper panel) or flash-frozen U251 cells (lower panel). Note that in Vero-infected cells, the peak marked with a red asterisk, unlike all other peaks, has an unusual read-length distribution centred on 26 nt, and this is not seen in U251-infected cells. For U251 cells infected with Dak84, only RPFs with a read length of 28 and 29 were plotted. Histograms show the positions of the 5′ ends of reads with a +12 nt offset to map the approximate P-site. Reads whose 5′ ends map to the first, second or third phases relative to codons in the polyprotein reading frame are indicated in blue, orange or purple, respectively. Capsid (C) denotes the initiation of the polyprotein (main ORF). DF Bar charts of the percentage of ribosome-protected fragments (RPFs) in each phase relative to the polyprotein ORF. Regions with the least amount of overlapping, (coordinates given in plot titles), were selected. Reads whose 5′ ends map to the −2, −1 or 0 phases are indicated in blue, orange or purple, respectively. CHX-treated Vero cells infected with American isolate PE243 (D); flash-frozen Vero (E, upper panel) and U251 (E, lower panel) cells infected with PE243; and flash-frozen Vero (F, upper panel) and U251 (F, lower panel) cells infected with African isolate Dak84.
Fig. 3
Fig. 3. Analysis of ZIKV uORF translation.
A Firefly luciferase (FF-Luc) reporter constructs scheme where the 2A-FF-Luc cassette is positioned downstream of and in frame with uORF1, uORF2 or main ORF. uORF1-2A-FF-Luc includes the complete 5′-UTR (107 nucleotides) plus 22 nucleotides of the polyprotein. In this case, a tryptophan residue substitutes the uORF1 stop codon (grey asterisk) to allow the luciferase reporter expression. uORF2-2A-FF-Luc includes the complete 5′-UTR plus 89 nucleotides of the polyprotein, and the main ORF-2A-FF-Luc includes the complete 5′-UTR plus 87 nucleotides of the polyprotein. Differences in protein length are due to frame correction. B Relative FF-Luc activity for uORF1, uORF2 and main ORF normalised to Renilla luciferase (Ren-Luc) used as a transfection control. Vero-transfected cells were harvested at 30 h post-transfection (h p.t.). One-hundred percent translation accounted for the main ORF WT translation. C Scheme of the 5′ region of American isolate PE243 with initiation codons for uORF1, uORF2 and main ORF indicated in blue, orange and purple, respectively. Modified nucleotides in the different mutants are indicated by a coloured-filled square associated with the mutant name, described in (D). E Relative FF-Luc activity of different mutants for uORF1, uORF2 and main ORF normalised to Ren-Luc as described in (B). American WT FF-Luc activities of uORF1, uORF2 and main ORF from (B) have been included for clarity. F Relative FF-Luc/Ren-Luc ratio of uORF1-, uORF2- and main ORF-2A-FF-Luc reporter mRNAs in Vero cells infected with American isolate PE243 (MOI:3, purple triangle) or mock-infected (red circle) at 6 h p.t. Cells were harvested at 24 h p.i. G Relative FF-Luc/Ren-Luc ratio of main ORF-2A-FF-Luc mutant reporters in Vero cells infected with PE243 (MOI:3) or mock-infected at 6 h p.t. Cells were harvested at 24 h p.i. Experiments were performed in triplicate with three biological replicates. In all cases, error bars represent standard errors. All t-tests were two-tailed and did not assume equal variance for the two populations being compared. All p values are from comparisons of the mutant with the respective non-mutated luciferase reporter (i.e., derived from the American wild-type) in the same ORF. Source data are provided as a Source Data file.
Fig. 4
Fig. 4. The significance of uORF translation in virus infection.
A Summarising table of SHAPE and RT-PCR data for ZIKV uORFs mutant viruses derived from pCCI-SP6-American ZIKV infectious clone. B SHAPE RNA secondary structure of the 5′ region (first 180 nucleotides) of the American WT, African-like, uORF1-KO and uORF2-PTC mutant viruses. Nucleotides are colour-coded based on SHAPE reactivity. SLA stem-loop A, SLB stem-loop B and cHP capsid hairpin. C Time-course of infection of U251 cells with ZIKV mutant viruses (MOI 0.01) for 96 h. Plaque assays were performed on serial dilutions of the supernatant containing released virions. Values show the mean averages of the titration of three biological replicates. Error bars represent standard errors. PFU plaque-forming units. All t-tests were two-tailed and did not assume equal variance for the two populations being compared. All p values are from comparisons of the mutant virus with the American WT at the indicated time points. D Pie charts of competition assays of American WT with mutant viruses after 2 (p2), 4 (p4) and 6 (p6) sequential passages in U251 cells. Different proportions of each virus (50:50 and 90:10) were added as indicated in the first row (input 16 h p.i., passage 0). Chart area indicates the RNA proportion for each virus, as measured from sequencing chromatograms of RT-PCR products. Experiments were repeated independently eight times (Supplementary Table 6). E (left panels) Ribo-Seq read density in the 5′ region of the ZIKV genome at 24 h p.i. of flash-frozen Vero cells infected with American WT, uORF1-KO, uORF2-PTC1 and African-like viruses (MOI:3). Histograms show the positions of the 5′ ends of reads with a +12 nt offset to map the P-site as described in Fig. 2A–C. For these plots, the y-axis has been truncated at 18 RPM and only RPFs with a read length of 29 was plotted. Blue asterisk indicates uORF1 initiation codon, and red asterisk is the premature termination codon in uORF2. E (right panels) Bar charts of the percentage of RPFs in each phase, relative to the main ORF (plot as described in Fig. 2D–F). Source data are provided as a Source Data file.
Fig. 5
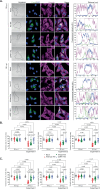
Fig. 5. ZIKV uORF1 interacts with the cytoskeleton.
A Subcellular fractionation analysis by western blot of Vero cells transfected for 48 h with plasmid pCAG (left panel) or pCAG expressing the ZIKV uORF1 protein fused with TAP-tag at the C-terminus (pCAG-ORF1-TAP, right panel). The total extract, cytosolic, membrane, nuclear, chromatin and cytoskeletal fractions were probed with antibodies against FLAG (to detect TAP-tag); GAPDH (cytosolic marker); ERp72 (membrane marker); Lamin A + C (nuclear marker); H2A (chromatin marker); and vimentin (cytoskeletal marker). Molecular masses (kDa) are indicated on the left. B Representative confocal images of Vero cells transfected for 36 h with pCAG (mock) or the pCAG-ORF1-TAP plasmids. Cells were stained with antibodies against FLAG (green) and different cytoskeletal proteins (i.e., actin, tubulin and vimentin in magenta). Nuclei were counter-stained with DAPI (blue). Images are a maximum projection of a Z-stack. Scale bars, 25 μm. Fluorescence intensity profiles of ORF1-TAP (green) and the different cytoskeletal markers (magenta) were obtained using ImageJ software, along the white straight line shown on the merged image crossing the representative cell. C AlphaFold2 prediction for ZIKV uORF1-encoded protein. D Representative confocal images of Vero cells transfected for 36 h with pCAG-ORF1-TAP-1X Pro. Cells were stained and analysed as described in (B). Experiments in (A, B and D) were repeated three times with similar results. Source data are provided as a Source Data file.
Fig. 6
Fig. 6. ZIKV uORF1-encoded protein helps in the formation of the cytoskeletal cage during infection.
A Representative brightfield and confocal images of Vero cells infected with the American WT (Am WT), the African-like and the uORF1-KO mutant viruses (MOI:3) for 18 h (upper panel) and 24 h (lower panel). Cells were stained with antibodies against the viral E protein (green) and vimentin (magenta). Nuclei were counter-stained with DAPI (blue). Images are a maximum projection of a Z-stack. Scale bars, 25 μm. Fluorescence intensity profiles (right panel) of E protein (green), vimentin (magenta) and the nuclear staining (blue) were obtained using ImageJ software, along the white straight line shown on the merged image crossing the representative cell. B Quantification of the proportion of vimentin area by fluorescence microscopy versus overall cell area, measured by brightfield microscopy, in Vero-infected cells as shown in (A), and U251-infected cells (C) as shown in Supplementary Fig. 15. Each point represents a single cell (n = 30 per condition and biological replicate). Data are represented as mean ± SD from three biologically independent experiments. Statistical analysis was repeated measures two-way ANOVA. All p values are from comparisons of the different viruses at that specific time point and from each virus or mock at the two different time points. Source data are provided as a Source Data file.
Fig. 7
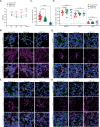
Fig. 7. ZIKV uORFs are involved in neural cell infection.
A Time-course of i3Neurons infected with ZIKV (MOI 10) for 96 h. TCID50 were performed with serial dilutions of the supernatant to measure virion release. Values show the mean averages of the titration from five biological replicates. Error bars represent standard errors. Statistical analysis was repeated measures two-way ANOVA on the log-transformed data. All p values are from comparisons of the mutant virus with the American WT at that specific time point. B Representative confocal images of i3Neurons infected with the American WT, the African-like and the uORF1-KO viruses (MOI:10) for 96 h. Cells were stained with antibodies against the viral E protein (green) and the mature neuron marker MAP2 (magenta). Nuclei were counter-stained with DAPI (blue). Images represent the maximum projection of a Z-stack. Scale bars, 25 μm. C Percentage of E+ cells in relation to total number of nuclei in ALI-COs infected with the American WT, the African-like and the uORF1-KO viruses (MOI:5) for 7 days. Thirty-three images per virus type at 20× resolution (~400–500 nuclei/image) were quantified for E-positive staining. Error bars represent standard errors. Statistical analysis was one-way ANOVA with Gaussian distribution and did not assume equal variance for the two populations being compared. All p values are from comparisons of the mutant virus with the American WT. Representative confocal images of infected ALI-COs, showing immunoreactivity for the viral E protein (green) and for different cellular markers (in magenta): nestin (D), GFAP (E) and MAP2 (F). Nuclei were counter-stained with DAPI (blue). Images represent the maximum projection of a Z-stack. Scale bars, 25 μm. G Percentage of E+ cells that are positive for nestin, GFAP and MAP2. Eleven images per virus type at 20× resolution (~400–500 nuclei/image) were quantified. Statistical analysis was performed as in (C). Four ALI-CO slices derived from two independent cerebral organoids were analysed for (C) and (G). The number of fluorescent cells corresponding to each staining was measured with ImageJ software by splitting the different channels.
Fig. 8
Fig. 8. ZIKV mutant viruses display similar transmission dynamics in mosquitoes in vivo.
A (left panel) Ribo-Seq reads in the 5′ region of the ZIKV genome at 24 h p.i. of CHX-treated C6/36 cells infected with PE243 (MOI:3). Histograms show the positions of the 5′ ends of reads with a +12 nt offset to map the approximate P-site as described in Fig. 2A–C. A (right panel) Bar charts of the percentage of RPFs translated in each frame in relation to the main ORF as described in Fig. 2D–F. B Prevalence of ZIKV infection (left), dissemination (middle) and transmission (right) over time in mosquitoes exposed to an infectious blood meal containing 2 × 106 PFU/mL of virus. Infection prevalence is the proportion of blood-fed mosquitoes with a body infection (determined by RT-PCR), dissemination prevalence is the proportion of infected mosquitoes with a virus-positive head (determined by RT-PCR), and transmission prevalence is the proportion of mosquitoes with a disseminated infection and infectious saliva (determined by focus-forming assay). The data represent three separate experiments combined, colour-coded by different ZIKV mutants (total number of Ae. aegypti mosquitoes per experiment and time points are indicated in Supplementary Table 4). The size of the data points is proportionate to the number of mosquitoes tested, and the lines are the logistic fits of the time effect for each type of virus (ignoring the experiment effect on transmission prevalence in the visual representation). The vertical error bars are the 95% confidence intervals of the proportions.

References

    1. Lazear, H. M. & Diamond, M. S. Zika virus: new clinical syndromes and its emergence in the western hemisphere. J. Virol.90, 4864–4875 (2016). - PMC - PubMed
    1. Cao-Lormeau, V.-M. et al. Guillain-Barré Syndrome outbreak associated with Zika virus infection in French Polynesia: a case-control study. Lancet387, 1531–1539 (2016). - PMC - PubMed
    1. Noronha, L., de, Zanluca, C., Azevedo, M. L. V., Luz, K. G. & Dos Santos, C. N. D. Zika virus damages the human placental barrier and presents marked fetal neurotropism. Mem. Inst. Oswaldo Cruz111, 287–293 (2016). - PMC - PubMed
    1. Mlakar, J. et al. Zika virus associated with microcephaly. N. Engl. J. Med.374, 951–958 (2016). - PubMed
    1. Moore, C. A. et al. Characterizing the pattern of anomalies in congenital Zika syndrome for pediatric clinicians. JAMA Pediatr.171, 288 (2017). - PMC - PubMed

Publication types

LinkOut - more resources