. 2024 Oct 12;15(1):8824.
doi: 10.1038/s41467-024-53107-6.

N-cadherin crosstalk with integrin weakens the molecular clutch in response to surface viscosity

Affiliations

N-cadherin crosstalk with integrin weakens the molecular clutch in response to surface viscosity

Eva Barcelona-Estaje et al. Nat Commun. .

Abstract

Mesenchymal stem cells (MSCs) interact with their surroundings via integrins, which link to the actin cytoskeleton and translate physical cues into biochemical signals through mechanotransduction. N-cadherins enable cell-cell communication and are also linked to the cytoskeleton. This crosstalk between integrins and cadherins modulates MSC mechanotransduction and fate. Here we show the role of this crosstalk in the mechanosensing of viscosity using supported lipid bilayers as substrates of varying viscosity. We functionalize these lipid bilayers with adhesion peptides for integrins (RGD) and N-cadherins (HAVDI), to demonstrate that integrins and cadherins compete for the actin cytoskeleton, leading to an altered MSC mechanosensing response. This response is characterised by a weaker integrin adhesion to the environment when cadherin ligation occurs. We model this competition via a modified molecular clutch model, which drives the integrin/cadherin crosstalk in response to surface viscosity, ultimately controlling MSC lineage commitment.


Conflict of interest statement

The authors declare no competing interests.

Figures
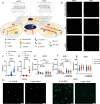
Fig. 1
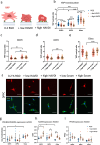
Fig. 1. Supported lipid bilayers functionalized with integrin and N-cadherin adhesive peptides as a platform to study adhesive crosstalk in hMSC adhesion and mechanosensing.
a Schematic representation of hMSCs seeded on DOPC (left) and DPPC (right) supported lipid bilayers functionalized with RGD and HAVDI peptides. Viscosity values taken from ref. . b Representative images of DAPI stained hMSCs seeded on bilayers for 24 h without functionalization, with only NA and with NA and RGD. Cell numbers quantification of hMSCs seeded for 24 h (scale bar = 50 μm) on (c) DOPC and (d) DPPC SLBs without functionalization, with only NA or with RGD (n = 15 in all conditions). On non-functionalised DOPC, no cells were found on any sample. eg hMSCs area after 24 h of cell culture on DOPC, DPPC and glass, respectively, with 0.2% mol RGD with low or high HAVDI without treatment or with N-cadherin blocked (+N-cadh Ab conditions) (n (graph (e)) from left to right 36, 38, 54, 45, 30, 36. n (graph (f)) from left to right 47, 34, 30, 47, 45, 37. n (graph (g)) from left to right 53, 59, 49, 45, 59, 50). All n represents cells. h) Representative images of hMSCs seeded on DOPC and DPPC bilayers functionalized with only RGD or RGD and HAVDI (Actin: green, DAPI:blue). All data are presented as mean values ± SD. (Scale bars = 50 μm) Statistical significance was determined using D’Agostino Pearson normality test, followed by a Kruskal−Wallis multiple-comparison test. All data are presented as mean values ± SD.*P ≤ 0.05, **P ≤ 0.01, ***P ≤ 0.001, ****P ≤ 0.0001.
Fig. 2
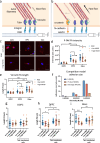
Fig. 2. HAVDI ligation reduces YAP nuclear translocation independently of viscosity.
a Schematic representation of YAP translocation to the nucleus of hMSCs on surfaces with RGD and RGD with low and high HAVDI. Image made with BioRender. b Quantification of YAP translocation of hMSCs seeded on SLBs and glass functionalized with RGD and RGD + low and high HAVDI (n from left to right = 36, 36, 32, 15, 34, 21, 20, 21, 16). All n represent cells. Statistical significance was determined using D’Agostino Pearson normality test, followed by a mixed-effects analysis. Quantification of YAP translocation to the nucleus of hMSCs seeded on (c) DOPC (from left to right n = 75, 59, 37, 38), (d) DPPC (from left to right n = 61, 48, 34, 38), and (e) glass (from left to right n = 61, 58, 45, 29) functionalized with low and high HAVDI or scrambled HAVDI peptide; statistical differences in (ce) are shown only between HAVDI and scrambled HAVDI conditions. Statistical significance was determined using D’Agostino Pearson normality test, followed by a Kruskal−Wallis multiple-comparison test. f Representative images of hMSCs seeded on DPPC functionalized with RGD, RGD + low and high HAVDI or RGD + low and high scrambled HAVDI (scale bar = 50 μm). gi show early differentiation marker expression measured by In-Cell Western of hMSCs for osteogenesis (7 days) (from left to right n = 9, 5, 7, 9, 8, 7, 9, 9, 7), chondrogenesis (from left to right n = 9, 9, 9, 9, 9, 9, 7, 6, 9) and adipogenesis (5 days) (from left to right n = 6, 5, 3, 8, 6, 7, 6, 9, 9) respectively. In graphs (gi) n represent areas in the in-cell well. All statistical differences for (gi) can be seen in Supplementary Tables 2–4. Statistical significance was determined using D’Agostino Pearson normality test, followed by followed by a mixed effects analysis. All data are presented as mean values ± SD. *P ≤ 0.05, **P ≤ 0.01, ***P ≤ 0.001, ****P ≤ 0.0001.
Fig. 3
Fig. 3. Adhesive crosstalk affects cell adhesion and the molecular clutch in a viscosity-dependent manner.
Schematic representation of the competition for actin filaments by integrin (a) and N-cadherin (b) adhesion clutches. Images made with BioRender. c Representative images of focal adhesions of hMSCs stained for P-FAK seeded on SLBs and glass with 0.2% RGD or 0.2% RGD plus high HAVDI (scale bar = 50 μm). d P-FAK intensity of hMSCs seeded on bilayers for 24 h with RGD and RGD plus low or high HAVDI (from left to right n = 21, 22, 27, 18, 19, 20, 19, 17, 25). e FA size measured by vinculin staining of hMSCs seeded on bilayers for 24 h with RGD and RGD plus low or high HAVDI (from left to right n = 23, 23, 29, 29, 30, 30, 23, 20, 26). Representative images can be seen in Supplementary Fig. 8b.f Adhesion size obtained by applying the molecular clutch competition model. Predictions are shown for different amounts of HAVDI ligands (0-75-750) at three values of viscosity (10−6 Ns/m for DOPC; 10−4 Ns/m for DPPC, and the highest modelled value of 10−3 Ns/m); full model predictions are shown in Supplementary Fig. 15. gi FA length of Y201 overexpressing Talin seeded on DOPC, DPPC and glass, respectively, functionalized with RGD and low or high HAVDI (from left to right n graph (g) = 26, 19, 25, 17, 13, 12; graph (h) n = 29, 15, 23, 20, 23, 16; graph (i) n = 25, 14, 19, 19, 19, 17). All statistical differences can be found in Supplementary Tables 5–7. Statistical significance was determined using D’Agostino Pearson normality test, followed by followed by a mixed-effects analysis. All data are presented as mean values ± SD. In all graphs n represent cells. *P ≤ 0.05, **P ≤ 0.01, ***P ≤ 0.001, ****P ≤ 0.0001.
Fig. 4
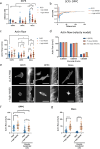
Fig. 4. HAVDI ligation affects the force of adhesion and actin flow.
a Single-cell force spectroscopy of cells (Y201) seeded on bilayers or glass functionalized with RGD or RGD with low and high HAVDI (from left to right n = 21, 12, 6, 24, 21, 28, 29, 28, 30) n represent force curves measured in 6 cells). Statistical significance was determined using D’Agostino Pearson normality test, followed by followed by a mixed-effects analysis. b Representative SCFS curves of cells seeded on DPPC bilayers functionalized with RGD or RGD with low and high HAVDI. c Actin flow of cells (Y201) seeded on supported lipid bilayers and glass functionalized with RGD or RGD with low and high HAVDI (from left to right n = 47, 28, 11, 40, 59, 22, 15, 52, 58) n represents kymographs measured in 6 cells. Statistical significance was determined using D’Agostino Pearson normality test, followed by followed by a mixed-effects analysis. d Theoretical actin flow velocity obtained by applying the competition in the molecular clutch model. Predictions are shown for different amounts of HAVDI ligands (0-75-750) at three values of viscosity (10−6 Ns/m for DOPC; 10−4 Ns/m for DPPC, and the highest modelled value of 10−3 Ns/m); full model predictions are shown in Supplementary Fig. 15.e Representative images of cells transfected with LifeAct and their corresponding kymographs. f, g Actin flow of cells (Y201) seeded on DPPC bilayers and glass functionalized with RGD or RGD with high HAVDI (from left to right (graph f) n = 27, 26, 27, 26, (graph g) n = 33, 32, 32, 33). In graphs (f and g), n represent kymographs measured in 5–6 cells). Scale bars: cell images = 50 μm; kymographs =  10 μm horizontal and 30 s vertical. Statistical significance was determined using D’Agostino Pearson normality test, followed by followed by (graph f) Kruskal-Wallis multiple-comparisons test or a (graph g) Two-Way ANOVA. All data are presented as mean values ± SD.*P ≤ 0.05, **P ≤ 0.01, ***P ≤ 0.001, ****P ≤ 0.0001.

References

    1. Hynes, R. O. Integrins: bidirectional, allosteric signaling machines. Cell110, 673–687 (2002). - PubMed
    1. Han, S. J., Bielawski, K. S., Ting, L. H., Rodriguez, M. L. & Sniadecki, N. J. Decoupling substrate stiffness, spread area, and micropost density: a close spatial relationship between traction forces and focal adhesions. Biophys. J.103, 640–648 (2012). - PMC - PubMed
    1. Murray, M. E., Mendez, M. G. & Janmey, P. A. Substrate stiffness regulates solubility of cellular vimentin. Mol. Biol. Cell25, 87–94 (2014). - PMC - PubMed
    1. Bachmann, B. et al. Stiffness matters: fine-tuned hydrogel elasticity alters chondrogenic redifferentiation. Front. Bioeng. Biotechnol.8, 373 (2020). - PMC - PubMed
    1. Cantini, M., Donnelly, H., Dalby, M. J. & Salmeron-Sanchez, M. The plot thickens: the emerging role of matrix viscosity in cell mechanotransduction. Adv. Health Mater.9, 1901259 (2020). - PubMed

Publication types