. 2025 Jan;20(1):121-131.
doi: 10.1038/s41565-024-01798-9. Epub 2024 Oct 11.

Magnetoelectric nanodiscs enable wireless transgene-free neuromodulation

Affiliations

Magnetoelectric nanodiscs enable wireless transgene-free neuromodulation

Ye Ji Kim et al. Nat Nanotechnol. 2025 Jan.

Abstract

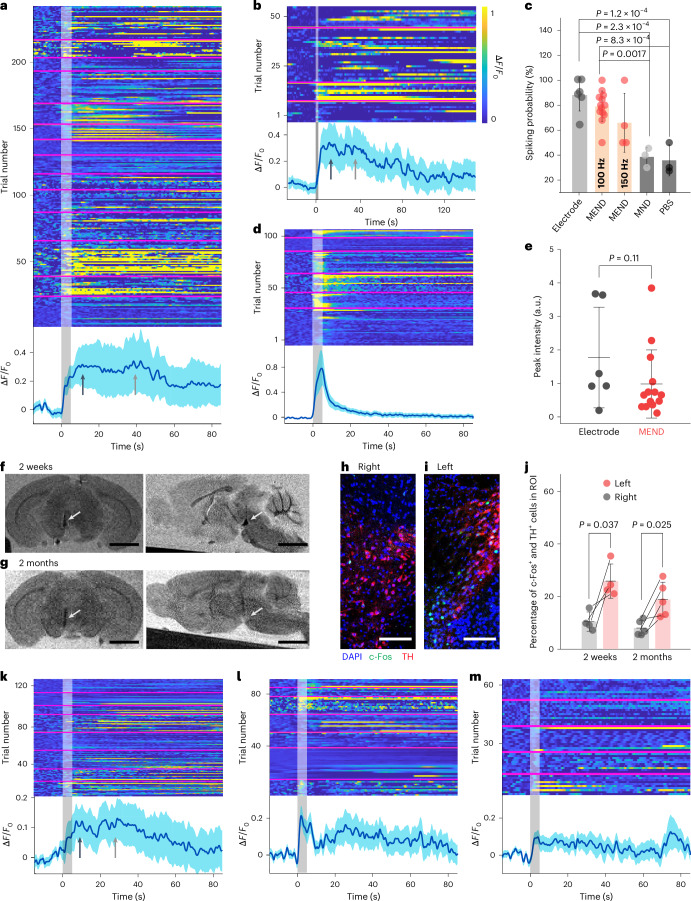
Deep brain stimulation with implanted electrodes has transformed neuroscience studies and treatment of neurological and psychiatric conditions. Discovering less invasive alternatives to deep brain stimulation could expand its clinical and research applications. Nanomaterial-mediated transduction of magnetic fields into electric potentials has been explored as a means for remote neuromodulation. Here we synthesize magnetoelectric nanodiscs (MENDs) with a core-double-shell Fe3O4-CoFe2O4-BaTiO3 architecture (250 nm diameter and 50 nm thickness) with efficient magnetoelectric coupling. We find robust responses to magnetic field stimulation in neurons decorated with MENDs at a density of 1 µg mm-2 despite individual-particle potentials below the neuronal excitation threshold. We propose a model for repetitive subthreshold depolarization that, combined with cable theory, supports our observations in vitro and informs magnetoelectric stimulation in vivo. Injected into the ventral tegmental area or the subthalamic nucleus of genetically intact mice at concentrations of 1 mg ml-1, MENDs enable remote control of reward or motor behaviours, respectively. These findings set the stage for mechanistic optimization of magnetoelectric neuromodulation towards applications in neuroscience research.


Conflict of interest statement

Competing interests: Y.J.K., F.K. and P.A. have applied for a US patent (US 63/496,112) related to the MEND technology reported in the manuscript. The remaining authors declare no competing interests.

Figures

Fig. 1
Fig. 1. MENDs for neuromodulation.
a, An illustration of neuromodulation mediated by MENDs. b,c, TEM images of Fe3O4 MNDs, which form the core of MENDs (b), and CFONDs (c). Scale bars, 100 nm. The insets show selected area electron diffraction patterns. Scale bars, 10 nm−1. d, SEM images of core–double-shell Fe3O4–CoFe2O4–BaTiO3 MENDs. Scale bar, 100 nm. e, An illustration of the electrochemical measurement apparatus that employs surface charge variation of MENDs in response to applied MF to determine the ME coefficient (αME). f, Simulated magnetostriction constant (bars) and magnetostrictive displacement maps (framed insets) for hexagonal CFONDs (pink), hexagonal MNDs (blue) and Fe3O4–CoFe2O4 core–shell spherical nanoparticles (green). Inset: colour index for direction in magnetostrictive displacement maps. g, Simulated electric polarization generated in BaTiO3 shells deposited onto CFONDs upon exposure to an OMF of HOMF = 220 mT and an AMF with an amplitude HAMF = 10 mT. h, αME at an AMF with a frequency ƒAMF = 150 Hz and HAMF = 10 mT measured at varying HOMF for MENDs (red), isotropic MENPs (black) and CFONDs (grey). i, αME for MENDs as a function of AMF frequency at HAMF = 10 mT and HOMF = 220 mT. j, αME for MENDs as a function of AMF amplitude for ƒAMF = 150 Hz and HOMF = 220 mT. In hj, the points and error bars indicate the mean and s.d. for n = 3 samples. Source data
Fig. 2
Fig. 2. MEND-mediated neuronal stimulation in vitro.
a,b, The relative GCaMP6s fluorescence change (∆F/F0) in hippocampal neurons decorated with MENDs before (a) and after (b) MF application (10 s, OMF 220 mT; AMF 1 kHz, 10 mT). Scale bars, 150 µm. c, The change in live cell ratio (counted from a live–dead assay in neurons normalized to the total number of cells marked by Hoechst staining) following three cycles of MF for neurons decorated with different MEND densities (0 µg mm−2, 0.75 µg mm−2, and 1 µg mm−2). Statistical significance was tested via one-way ANOVA and Tukey’s multiple comparison tests (n = 5 plates per condition, P = 3.79 × 10–7 for 1 µg mm−2; P = 0.79 for 0.75 µg mm−2; P = 0.998 for 0 µg mm−2; ****P ≤ 0.0001, n.s. P > 0.05). The error bars indicate s.d. d,e, Individual (d) and average (e) traces of GCaMP6s ∆F/F0 in 300 hippocampal neurons decorated with MENDs in response to 10 mT AMF with frequencies 100, 150, 250, 500 and 1,000 Hz (HOMF = 220 mT). The dashed grey and magenta lines indicate the beginning and end of MF stimulation, respectively. f, Individual cell (top) and mean (bottom) GCaMP6s fluorescence changes in 300 neurons in response to 2 s MF epochs applied at varying intervals (OMF 220 mT; AMF 150 Hz, 10 mT). g, The number of GCaMP6s fluorescence peaks as a function of stimulation epoch length for rest intervals of 10, 30, 60, 90 and 120 s (OMF 220 mT; AMF 150 Hz, 10 mT). hl, Individual cell (top) and mean (bottom) GCaMP6s fluorescence changes in response to 2 s MF (OMF 220 mT; AMF 100 Hz, 10 mT) epochs at 30 s (h), 10 s (i), 5 s (j), 2 s (k) and 1 s (l) intervals for 0.75 µg mm−2 MEND density. In f and hl bottom panels, the lines and shaded areas represent the mean and s.e.m., respectively. m, The position of the first GCaMP6s peak from the MF onset and spiking probability equal to the fraction of trials triggering GCaMP6s transients across five MF epochs. The error bars indicate s.d. (n = 3 plates per condition). Source data
Fig. 3
Fig. 3. Mechanistic study of MEND-mediated neuromodulation.
a, An illustration of stimulation mechanism, where d is spacing between MEND particles, a is cell radius, ΔV is the change in membrane potential per half-period of an AMF, and V0 is the voltage generated by a single MEND. b, The calculated ΔV as a function of V0 and d. c, Simulated membrane potential V(t) as a function of time from AMF onset for varying V0 values and d=0.25a. The threshold for action potential firing, –55 mV, is indicated with a dashed line. d, V(t) at a time t = 2 s after AMF onset as a function of d, for varying V0 values. e, Time to reach threshold membrane potential (–55 mV) from the resting potential (–75 mV) as a function of AMF frequency ƒAMF for varying V0 values. f, (i–iii) SEM images showing MENDs decorating cultured hippocampal neurons. (ii) A higher-magnification image of the area marked by a box in panel i. (iii) MENDs on the neuron surface shaded in blue. Scale bars: 20 µm (i), 5 µm (ii) and 100 nm (iii). g,h, GCaMP6s fluorescence change in neurons decorated with MEND following 2 s stimulations (OMF 220 mT; AMF 150 Hz, 10 mT, marked by vertical grey bars) in the presence of TTX, 1 µM (g) or a cocktail of AP5, 100 µM and CNQX, 20 µM (h). i, Fluorescent images of primary hippocampal neurons co-transfected with Voltron 2.0 (labelled with JF585) and GCaMP6s. Scale bars, 150 µm. j, The fluorescence change of JF585-labelled Voltron 2.0 in neurons decorated with MENDs before (left) and after (right) 2 s MF application (10 mT, 100 Hz AMF; 220 mT OMF). Scale bars, 40 µm. k,l, Individual (top) and average (bottom) traces of negative relative fluorescence change (−∆F/F0) of JF585-labelled Voltron 2.0 (k) and GCaMP6s ∆F/F0 traces from MEND-decorated neurons subjected to five 2 s epochs of combined MF (10 mT, 100 Hz AMF; 220 mT OMF) separated by 10 s intervals (l). In g and h and in bottom panels in k and l, the lines and shaded areas represent the mean and s.e.m. Source data
Fig. 4
Fig. 4. MEND-mediated neuronal stimulation in mice.
a, A schematic of mice injected with MENDs in VTA and placed inside a permanent magnet field providing OMF and a surrounding solenoid providing AMF. b, Confocal images of c-Fos-expressing neurons among DAPI-marked cells in the VTA. Top left: MENDs (1.5 mg ml−1) with (+) magnetic stimulation. Top right: MEND particles (1.5 mg ml−1) without (−) magnetic stimulation. Bottom left: control MNDs (1.5 mg ml−1) + magnetic stimulation. Bottom right: MENDs (0.5 mg ml−1) + magnetic stimulation. Scale bars, 25 µm. c, Quantification of c-Fos-expressing neurons for the conditions shown in b and in the subjects injected with PBS and exposed to MF. dg, Confocal images (d and f) and quantification (e and g) of c-Fos-expressing neurons in the mPFC (d and e) and NAc (f and g) for the same conditions as in b and c. Scale bars, 100 µm (d and f). In c, e and g, statistical significance was tested via one-way ANOVA and Tukey’s multiple comparison tests (n = 6). h, A schematic of the place preference arena (top) and experimental timeline (bottom). i, Time spent in the stimulation chamber out of a total assay time of 600 s, for pre-learning (day 1, open markers) and post-learning (day 5, solid markers). Paired t-test was performed for MEND (n = 11) and MND (n = 7) groups, and Wilcoxon signed-rank test was performed for PBS (n = 7) group because the data did not follow normal distribution. j, The change in time spent in the stimulation chamber between day 1 and day 5. P values were calculated by one-way ANOVA with Tukey’s post-hoc comparison test. k, A schematic illustration of the cylindrical arena. l,m, The numbers of contralateral (l) and ipsilateral (m) rotations during a baseline 3 min session (MF off) and during a 3 min stimulation assay consisting of 5 s MF epochs separated by 25 s intervals. Wilcoxon signed-rank test was performed to compare ipsilateral rotations of the MND group MF on and off. Other groups followed a normal distribution, and paired t-test was performed to calculate P values. In c, e, g, i, j, l and m, the lines and error bars indicate the mean and s.d. Inj., injection. Source data
Fig. 5
Fig. 5. Biocompatibility and stability of MENDs.
a,b, Fibre photometry recordings of GCaMP6s ∆F/F0 in the VTA of anaesthetized mice at 2 weeks following MEND injections in the same brain region with 5 s MF epochs of 100 Hz 10 mT AMF, 200 mT OMF (a) and 2 s MF epochs of 150 Hz 10 mT AMF, 200 mT OMF (b). c, The fraction of trials exhibiting a GCaMP6s fluorescence maximum (peak) within 20 s from the MF or current onset 2 weeks after the injection or implantation surgery. d, GCaMP6s ∆F/F0 recorded in mice implanted with a fibre and electrodes in the VTA and stimulated with 5 s current epochs. e, The mean value of GCaMP6s fluorescence peak per animal in a and d. The error bars represent s.d. f,g, MRI images (coronal view (left), scale bars 2 mm; sagittal view (right), scale bars 3 mm) of the brains isolated from mice at 2 weeks (f) and 2 months (g) following unilateral injections of MENDs into the left VTA. The arrows indicate the MEND bolus. h,i, Fluorescent images of right (h) and left (i) VTA immunostained for TH, c-Fos and DAPI. Scale bar, 100 µm. The area including MENDs in the left VTA is darker than the surroundings. j, The percentage of c-Fos-expressing cells among the TH-expressing cells in the left and right VTA at 2 weeks and 2 months following unilateral MEND injection. km, Fibre photometry traces in response to MF (5 s, OMF 220 mT, AMF 10 mT, 100 Hz) at 1 month (k), 2 months (l) and 3 months (m) following the MEND injection and fibre implantation surgery. In a, b, d and km, individual trial ∆F/F0 is shown (top) and the lines and shaded areas represent mean and s.e.m. across trials shown above (bottom) (a, n = 14; b, n = 4; d, n = 6; k, n = 8; l, n = 7; m, n = 5 mice). The grey rectangles indicate MF epochs, and the magenta horizontal lines delineate data from individual mice. In c, one-way ANOVA followed by Tukey’s post-hoc comparison test was applied for statistical analysis. P > 0.05 is not indicated. In e, two-sample t-test was performed, and in j, paired t-test was performed as the data are normally distributed. Source data

Update of

References

    1. Lozano, A. M. et al. Deep brain stimulation: current challenges and future directions. Nat. Rev. Neurol.15, 148–160 (2019). - PMC - PubMed
    1. Klomjai, W., Katz, R. & Lackmy-Vallée, A. Basic principles of transcranial magnetic stimulation (TMS) and repetitive TMS (rTMS). Ann. Phys. Rehab. Med.58, 208–213 (2015). - PubMed
    1. Violante, I. R. et al. Non-invasive temporal interference electrical stimulation of the human hippocampus. Nat. Neurosci.26, 1994–2004 (2023). - PMC - PubMed
    1. Grossman, N. et al. Noninvasive deep brain stimulation via temporally interfering electric fields. Cell169, 1029–1041.e1016 (2017). - PMC - PubMed
    1. Kennedy, J. E. High-intensity focused ultrasound in the treatment of solid tumours. Nat. Rev. Cancer5, 321–327 (2005). - PubMed

LinkOut - more resources