. 2024 Dec;131(11):1846-1857.
doi: 10.1038/s41416-024-02866-6. Epub 2024 Oct 11.

Imipridones inhibit tumor growth and improve survival in an orthotopic liver metastasis mouse model of human uveal melanoma

Affiliations

Imipridones inhibit tumor growth and improve survival in an orthotopic liver metastasis mouse model of human uveal melanoma

Chandrani Chattopadhyay et al. Br J Cancer. 2024 Dec.

Abstract

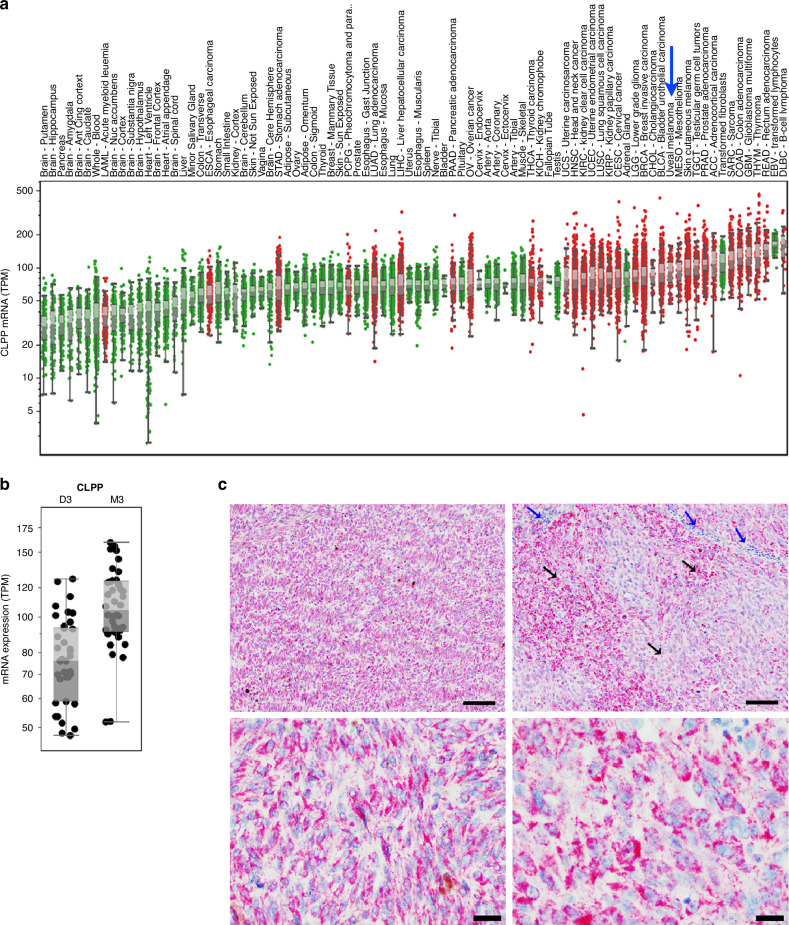
Background: Uveal melanoma (UM) is a highly aggressive disease with very few treatment options. We previously demonstrated that mUM is characterized by high oxidative phosphorylation (OXPHOS). Here we tested the anti-tumor, signaling and metabolic effects of imipridones, which are CLPP activators, which inhibit OXPHOS indirectly and have demonstrated safety in patients.

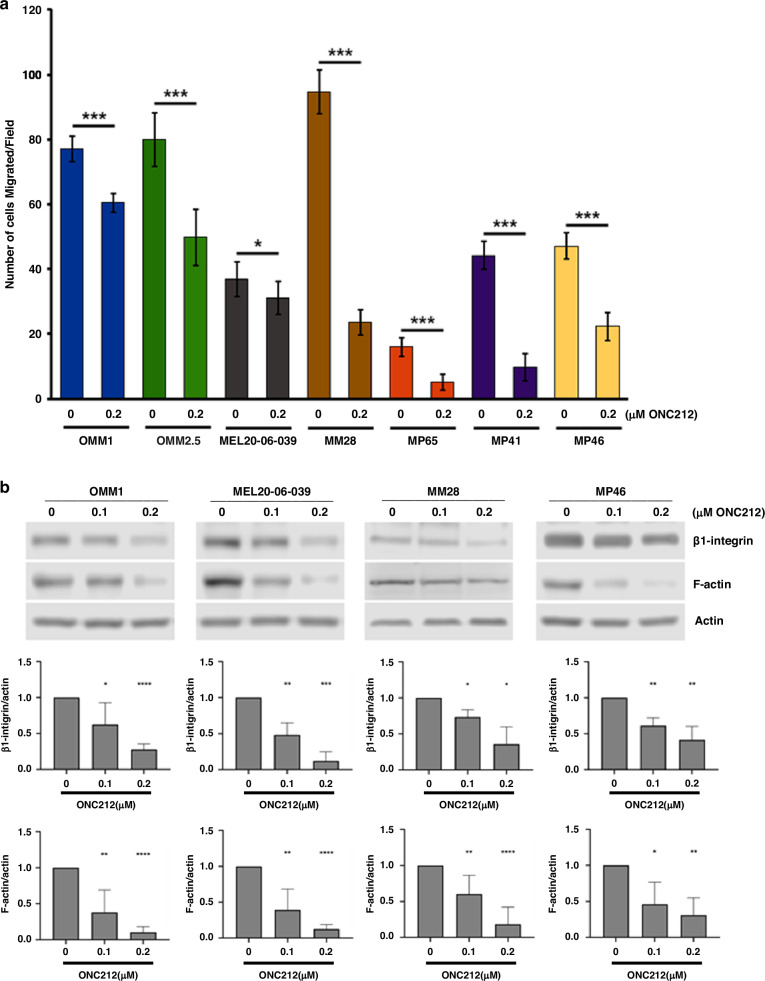
Methods: We assessed CLPP expression in UM patient samples. We tested the effects of imipridones (ONC201 and ONC212) on the growth, survival, signaling and metabolism of UM cell lines in vitro, and for therapeutic efficacy in vivo in UM liver metastasis models.

Results: CLPP expression was detected in primary and mUM patient samples. ONC201 and 212 decreased OXPHOS effectors, inhibited cell growth and migration, and induced apoptosis in human UM cell lines in vitro. ONC212 inhibited OXPHOS, increased metabolic stress and apoptotic pathways, inhibited amino acid metabolism, and induced cell death-related lipids. ONC212 also decreased tumor burden and increased survival in vivo in two UM liver metastasis models.

Conclusions: Imipridones are a promising strategy for further testing and development in mUM.


Conflict of interest statement

Competing interests: VVP is an employee and stockholder of Chimerix/Oncoceutics. MAD has been a consultant to Roche/Genentech, Array, Pfizer, Novartis, BMS, GSK, Sanofi-Aventis, Vaccinex, Apexigen, Eisai, Iovance, Merck, and ABM Therapeutics, and he has been the PI of research grants to The University of Texas MD Anderson Cancer Center by Roche/Genentech, GSK, Sanofi-Aventis, Merck, Myriad, Oncothyreon, Pfizer, ABM Therapeutics, and LEAD Pharma. Ethics approval and consent to participate: All procedures performed in obtaining tissues from human participants were in accordance with the ethical standards of The University of Texas MD Anderson Cancer Center and ethical tenets in the Declaration of Helsinki. All the human tissues were obtained and banked under The University of Texas MD Anderson Cancer Center approved IRB protocol. We attest that all human tissues were obtained with informed consent from subjects involved. All animal studies and procedures were performed in accordance with The University of Texas at MD Anderson Cancer Center’s approved IACUC protocol following relevant guidelines and regulations. Consent for publication: All authors have been provided with a copy of the manuscript and have reviewed prior to submission and have provided consent to publication.

Figures

Fig. 1
Fig. 1. CLPP expression in primary and metastatic UM.
a CLPP mRNA expression levels (transcript per million, TPM) in tumor and normal tissues were compared in 33 cancer (red dots) and corresponding normal (green dots) tissues through TCGA database analysis. The expression in UM is indicated by a blue arrow. b CLPP mRNA expression of M3 (n = 42) vs. D3 (n = 38) UM tumors from the UM TCGA. Box plots show median values and the 25th to 75th percentile range of the data (i.e., the interquartile range). c IHC for CLPP protein expression in mUM liver metastases from patients [10X (upper panels) and 40X (lower panels) magnifications; scale bar = 100 µm]. The blue arrows indicate stromal cells and lymphocytes, and the black arrows indicate the regions with melanoma tumors.
Fig. 2
Fig. 2. Imipridone treatment reduces OXPHOS effector proteins, inhibits cell survival, and induces apoptosis in UM cell lines.
a Analysis of mitochondrial respiration after ONC212 treatment (0.1 and 0.2 µM) using Mito stress test Seahorse assay in UM cells (MEL20-06-039, MEL202, MM28 and MP46). The arrows represent the timepoints of addition of Oligomycin, FCCP, and Rotenone/Antimycin (R/A). The y-axis represents oxygen consumption rate (OCR, pmol/min) normalized by cell number in corresponding sample well. b Western blot analysis of UM cell lines (MEL20-06-039, MP41, OMM2.3, and 92.1) treated with ONC201 or ONC212 for 48 h (right panels). Quantitation of SDHA and SDHB expression levels from the western blots in 2A. Actin was used for normalization (left panels). c Effect of ONC201 and ONC212 on UM cell survival (in MEl20-06-039, MP41, MEL270, OMM2.3, and OMM2.5 cell lines) by MTT-based cell survival assay. Bar graphs, mean ± SD of three independent experiments. p values were calculated by comparison to untreated controls (*p < 0.05; **p < 0.01; ***p < 0.001). d Western blot analysis of cleaved PARP, intact Caspase 9, and intact Caspase 3 following treatment with ONC201 and ONC212. e MTT-based measurement of dose-dependent growth inhibition of UM cell lines (MM28, OMM1, MP46, MEL202, MP38, and MEL20-06-039) by ONC212. Bar graphs, mean ± SD of three independent experiments. p values were calculated by comparison to untreated controls (*p < 0.05; **p < 0.01; ***p < 0.001). f Colony formation assay: The average number of colonies observed after staining with crystal violet in ONC212 treated (0.1, 0.25 and 0.5 µM) and untreated control UM cell lines (MP46, MP38, MP41, MM28, MP65, MEL20-06-039, MEL202, and 92.1) were plotted. 5 fields/condition/cell line were counted to obtain the average number of colonies. The bar graphs represent the average number of colonies per field and are a mean ± SD of three independent experiments. p values were calculated by comparing untreated controls with ONC212 treatment doses (*p < 0.05; **p < 0.01; ***p < 0.001). g FACS analysis of PI-stained cells collected after 48 h treatment with ONC212.
Fig. 3
Fig. 3. ONC212 inhibits UM cell migration.
a In vitro cell migration assay with ONC212 treatment (0.2 µM) of UM cell lines (OMM1, OMM2.5, MEL20-06-039, MM28, MP65, MP41, and MP46). An average of five fields of cells/filter were counted under a microscope with ×40 magnification. The average number of cells counted/field were obtained in two independent experiments and the mean ± SD of these average cell counts/field were plotted as bar graphs. p values were calculated by comparing untreated vs. ONC212 treated cells (*p < 0.05; **p < 0.01; ***p < 0.001). b Western blots showing the changes in cell migration markers, β1-integrin, and F-actin upon ONC212 treatment in OMM1, MEL20-06-039, MM28 and MP46 cell lines (top panels), and corresponding quantitation of these proteins normalized with β-actin loading control (bottom panels; *p < 0.05; **p < 0.01; ***p < 0.001).
Fig. 4
Fig. 4. Alterations in protein profiles of UM cells with ONC212 treatment.
a The top ten altered proteins from RPPA profiling of MEL20-06-039 and OMM2.3 UM cell lines. The RPPA expression values are displayed on the y-axis for proteins that show a significant difference (p < 0.05) compared to control sample. Untreated cells (blue bars) were compared with the cells treated for 48 h either with 0.1 µM (orange bars) or 0.2 µM (red) concentration of ONC212. b A heatmap of cellular signaling pathway activity scores after 48 h of ONC212 vs. vehicle treatment of UM cell lines (MEL20-06-039 and MEL202).
Fig. 5
Fig. 5. Alterations in metabolomic and lipidomic profiles of UM cells with ONC212 treatment.
a–g Mass spectrometry-based global metabolomics and lipidomics of UM cell line MEL20-06-039, treated with 0.1 and 0.2 µM of ONC212 for 48 h. a Pathway analysis and trends from significant changes observed in the metabolic profile. Heatmap showing changes in essential amino acids (b), and changes in metabolites involved in redox metabolism (c). d Pathway analysis and trends using lipidomics profiling showing significant changes upon ONC212 treatment. Heatmaps of lipid profiles analysis in Sphingomyelin (SM) (e), in inflammatory lipid signature such as ceramide, cholesterol ester, and CoQ (f), and in triglyceride signature (TG) (g).
Fig. 6
Fig. 6. ONC212 reduces tumor burden and improves survival in UM liver metastasis model.
a Representative images of weekly bioluminescence scans of mice with liver metastases of UM 92.1 treated with vehicle (control) or ONC212 (25 mg/kg). b Tumor growth curves plotted from bioluminescence scans post-tumor initiation. The black arrow represents the splenic injection, and the red arrow indicates the beginning of treatment. c Mouse body weight with vehicle and ONC212 treatment; red arrow indicates beginning of treatment. d Kaplan-Meier plots of 92.1 model with ONC212 treatment compared to vehicle treated controls; n = 10 per treatment group; 92.1 vehicle vs. ONC212 p = 0.0047; Hazard ratio from Cox proportional hazards model: 7.80 [95% confidence interval: 1.573 to 38.66]. e Representative images (scale bar = 100 µm) of SDHA immunohistochemical staining in vehicle and ONC212-treated 92.1 tumors in liver.

Update of

References

    1. Aronow ME, Topham AK, Singh AD. Uveal melanoma: 5-year update on incidence, treatment, and survival (SEER 1973-2013). Ocul Oncol Pathol. 2018;4:145–51. - PMC - PubMed
    1. Chattopadhyay C, Kim DW, Gombos DS, Oba J, Qin Y, Williams MD, et al. Uveal melanoma: from diagnosis to treatment and the science in between. Cancer. 2016;122:2299–312. - PMC - PubMed
    1. Jager MJ, Shields CL, Cebulla CM, Abdel-Rahman MH, Grossniklaus HE, Stern MH, et al. Uveal melanoma. Nat Rev Dis Prim. 2020;6:24. - PubMed
    1. Smit KN, Jager MJ, de Klein A, Kiliҫ E. Uveal melanoma: Towards a molecular understanding. Prog Retin Eye Res. 2020;75:100800. - PubMed
    1. Szeligo BM, Ivey AD, Boone BA. Poor response to checkpoint immunotherapy in uveal melanoma highlights the persistent need for innovative regional therapy approaches to manage liver metastases. Cancers (Basel). 2021;13:3426. - PMC - PubMed

MeSH terms

LinkOut - more resources