. 2024 Nov;25(11):5026-5052.
doi: 10.1038/s44319-024-00283-7. Epub 2024 Oct 11.

m6A modification of mutant huntingtin RNA promotes the biogenesis of pathogenic huntingtin transcripts

Affiliations

m6A modification of mutant huntingtin RNA promotes the biogenesis of pathogenic huntingtin transcripts

Anika Pupak et al. EMBO Rep. 2024 Nov.

Abstract

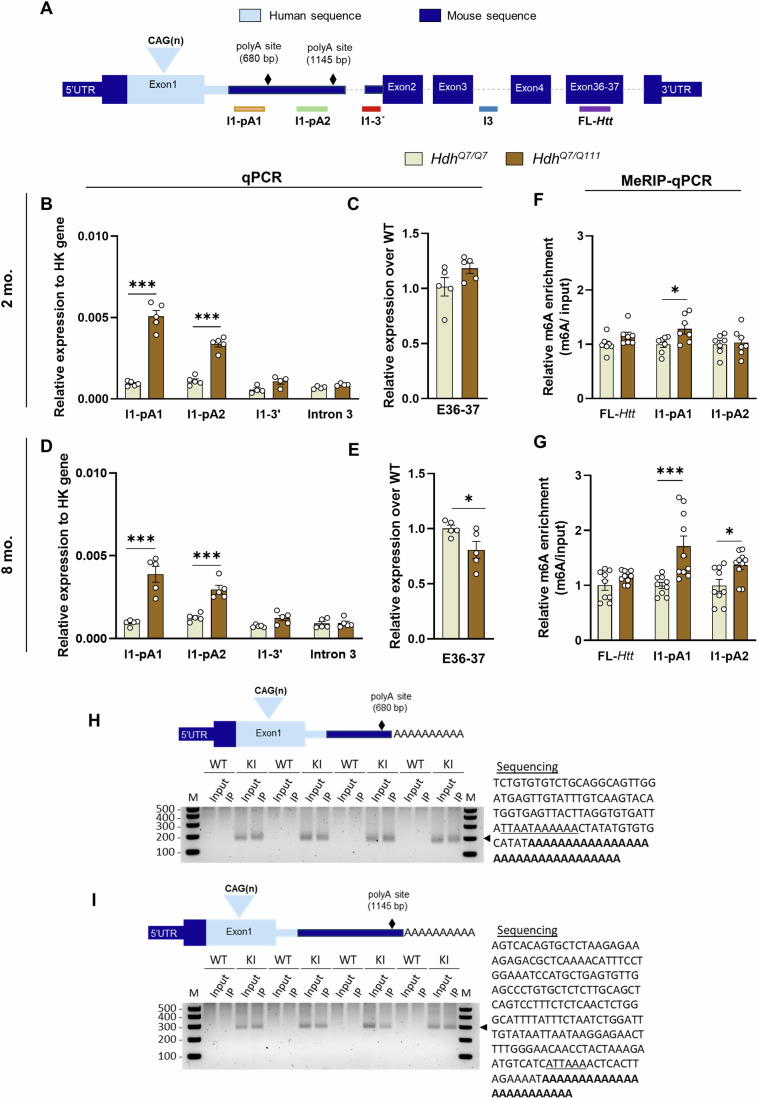
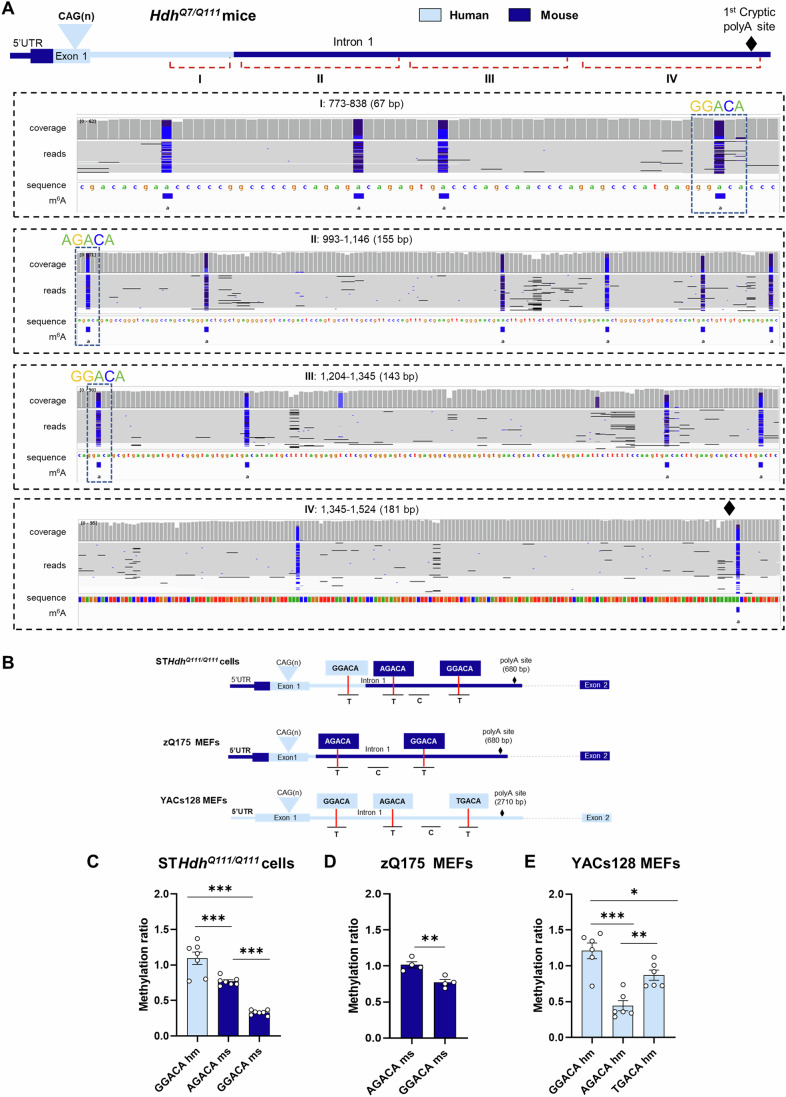
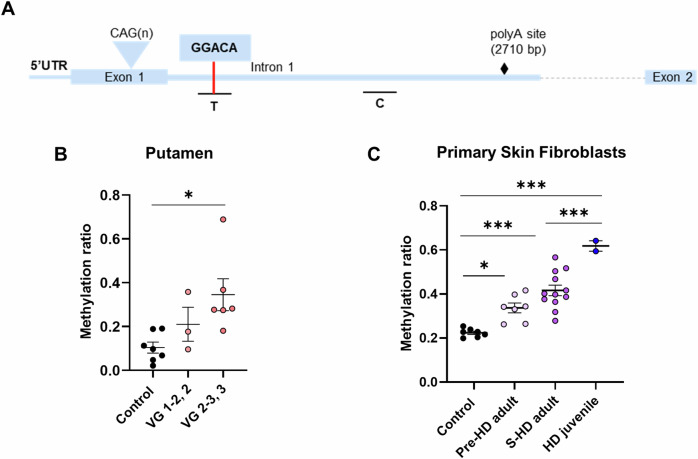
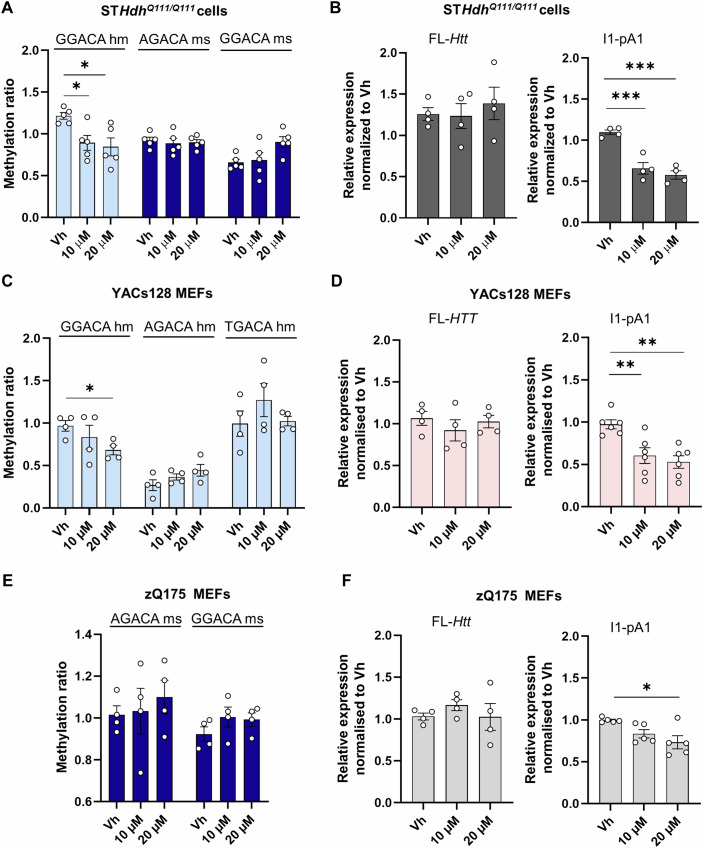
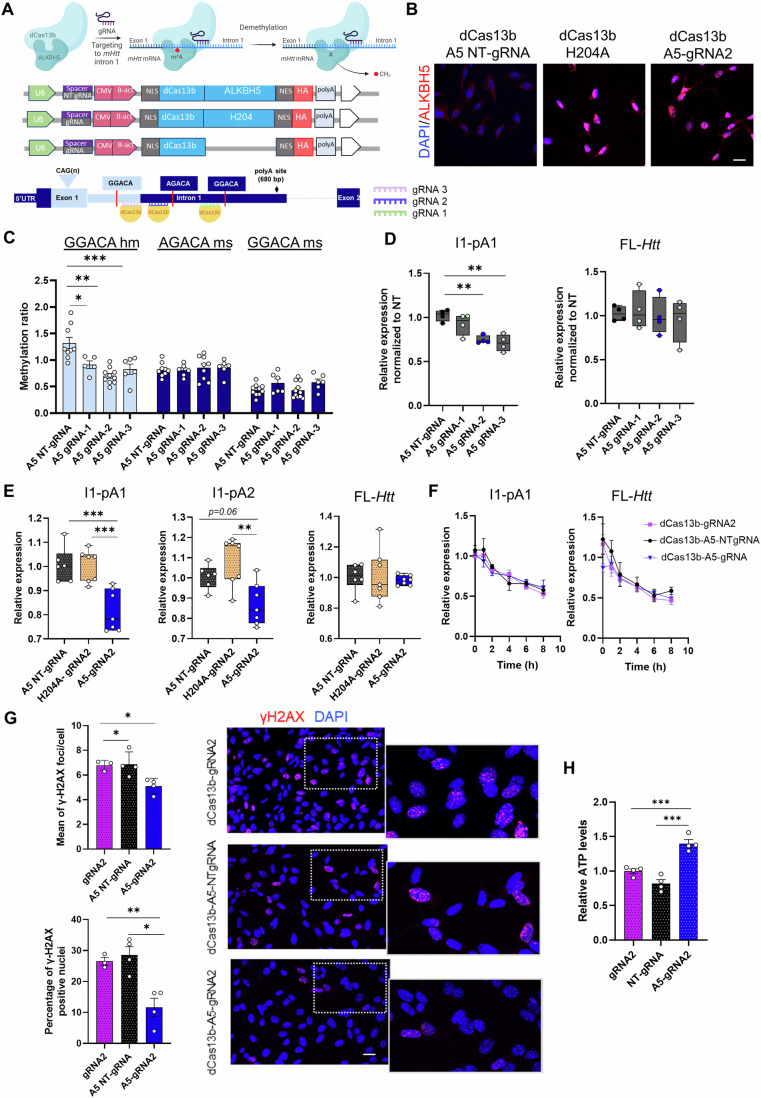
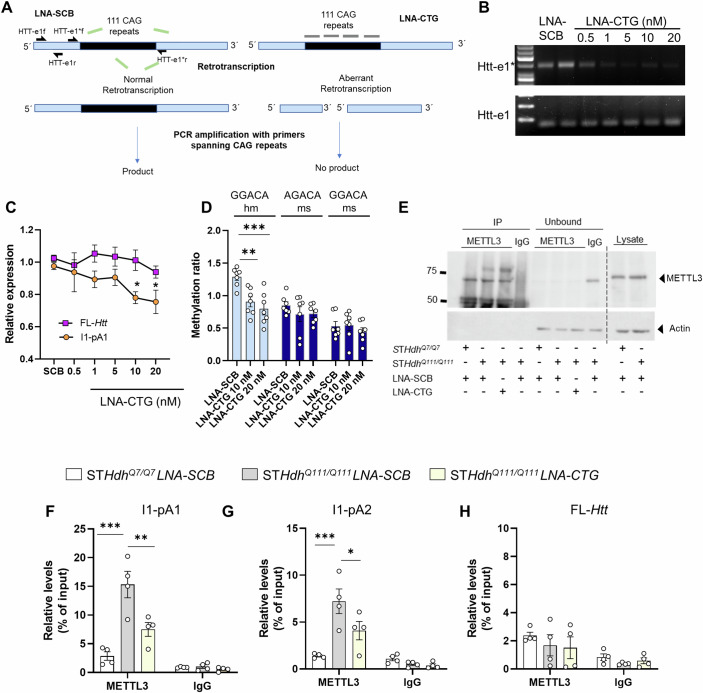
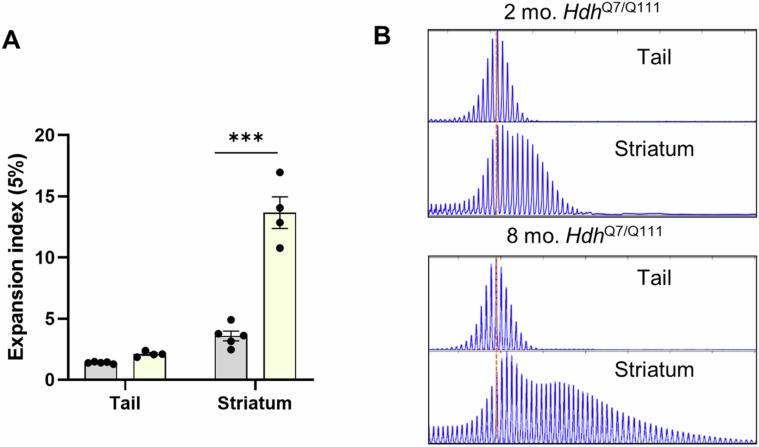
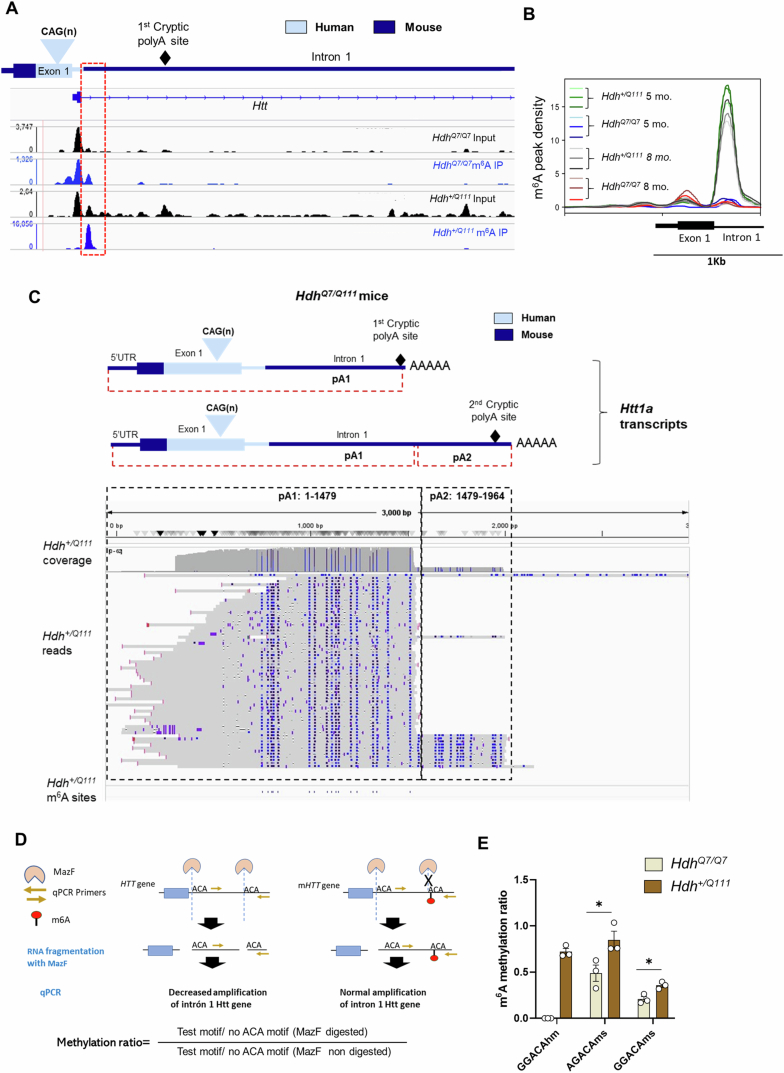
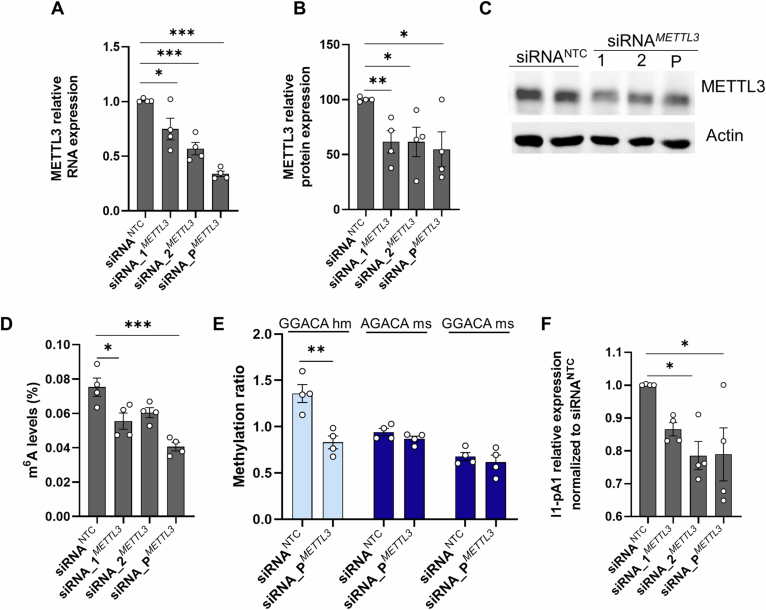
In Huntington's disease (HD), aberrant processing of huntingtin (HTT) mRNA produces HTT1a transcripts that encode the pathogenic HTT exon 1 protein. The mechanisms behind HTT1a production are not fully understood. Considering the role of m6A in RNA processing and splicing, we investigated its involvement in HTT1a generation. Here, we show that m6A methylation is increased before the cryptic poly(A) sites (IpA1 and IpA2) within the huntingtin RNA in the striatum of Hdh+/Q111 mice and human HD samples. We further assessed m6A's role in mutant Htt mRNA processing by pharmacological inhibition and knockdown of METTL3, as well as targeted demethylation of Htt intron 1 using a dCas13-ALKBH5 system in HD mouse cells. Our data reveal that Htt1a transcript levels are regulated by both METTL3 and the methylation status of Htt intron 1. They also show that m6A methylation in intron 1 depends on expanded CAG repeats. Our findings highlight a potential role for m6A in aberrant splicing of Htt mRNA.

Keywords: HTT1a; Huntington’s Disease; RNA Editing; Splicing; m6A.


Conflict of interest statement

The authors declare no competing interests.

Figures

Figure 1
Figure 1. m6A methylation levels of Htt1a transcripts are increased in the Hdh+/Q111 mouse model.
(A) Schematic of the location of the primer-probe sets used for qPCR amplification of Htt transcripts. (BE) qPCR analysis of Htt transcripts in the striatum of (B, C) 2-month-old (n = 4–5/genotype) and (D, E) 8-month-old Hdh+/Q111 mice (n = 5/genotype). The expression of intronic sequences (I1-pA1, I1-pA2, I3 and I1-3’) is presented relative to the housekeeping gene (B, D), and the relative levels of FL-Htt are shown relative to WT (C, E). Data represent the mean ± SEM. Data were analyzed using Student´s two-tailed t test, (B) I1-pA1, ***P < 0.0001; I1-pA2, ***P < 0.0001; comparison between I3 and I1-3’ is not significant, (C) FL-Htt, P = n.s., (D) I1-pA1, ***P = 0.0003; I1-pA2, ***P = 0.0003; comparison between I3 and I1-3’ is not significant (E), FL-Htt, *P = 0.0456. (F, G) Analysis of m6A enrichment was measured by MeRIP-qPCR in the striatum of (F) 2-month-old (n = 7/genotype) and (G) 8-month-old Hdh+/Q111 mice (n = 9–10/genotype). Enrichment of m6A was normalized to input. Data represent the mean ± SEM. Data were analyzed using Student´s two-tailed t test (F) *P = 0.0256 (G) I1-pA1, ***P = 0.004; I1-pA2, *P = 0.0136. FL: full-length; I: intron; pA: polyA site. (H, I) 3’RACE product in striatal samples generated from the cryptic poly(A) site at 680 bp (H) and 1145 bp (I) into intron 1 of Htt. (n = 4/genotype). M: DNA ladder. Right panel: SANGER sequencing of the generated product. The cryptic polyadenylation signal is underlined, and the poly(A) tail is shown in bold. The sequence was obtained from MeRIP and input samples (n = 1 mouse for position 680 bp; n = 2 mice for position 1145 bp). Source data are available online for this figure.
Figure 2
Figure 2. Mapping of m6A sites in the proximal region of mHtt intron 1.
(A) Analysis of m6A sites in Htt1a by Nanopore direct RNA sequencing in PolyA enriched RNA from striatum of Hdh+/Q111 mice (n = 2 replicates, each replicate is a pool of 3–4 mice). A mouse sequence (GRCmm39 genome) Htt gene including the human insert was used as reference gene (chr5: 34,919,088–35,070,342). The intronic region analyzed starts at 686 bp from the 5’ UTR and ends at 1819 bp (chr5: 34,919,774–34,920,048). IGV snapshots show the regions were m6A sites were predicted. Purple and blue dots represent high and low confidence m6A sites, respectively. Mapping of m6A sites in the whole Htt1a transcripts is shown in EV2C. Methylation sites analyzed by MazF-qPCR are highlighted in the tracks of the IGV snapshot. (B) Schematic of mHtt intron 1 m6A motifs analyzed by a qPCR-based assay coupled with MazF digestion in HD cell models, STHdhQ111/Q111, zQ175 MEFs and YAC128 MEFs. (CE) Methylation ratio obtained by MazF-qPCR analysis in (C) STHdhQ111/Q111 cells (n = 7 technical replicates/motif), (D) zQ175 MEFs (n = 4 technical replicates/motif) and (E) YAC128 MEFs (n = 6 technical replicates/motif). The levels of a targeted amplicon (labeled “T”) are measured against a control (labeled “C”) amplicon in a MazF-digested sample and normalized against a nondigested sample. Data represent the mean ± SEM. Data were analyzed using one-way ANOVA with Tukey´s multiple comparisons test (C) ***P < 0.0001, (D) **P < 0.0057, (E) *P = 0.0342, **P = 0.0082, ***P < 0.0001. hm human (light blue), ms mouse (dark blue). Source data are available online for this figure.
Figure 3
Figure 3. Increased methylation levels are detected at the m6A GGACA motif of Htt intron 1 in human samples.
(A) Schematic of the DRACH motif GGACA hm in HTT intron 1 analyzed by a qPCR-based assay coupled with MazF digestion in human samples. (B, C) Methylation ratio obtained by MazF-qPCR analysis in (B) human postmortem samples of the putamen (n = 3–7 individuals/group) and (C) in human skin fibroblasts (n = 2–12 patients/group; HD adult: Q40-Q56; HD juv: Q80 and Q180). VG: Vonsattel grade. VG1-2 (samples were from individuals with Vonsattel grades ranging between 1 and 2) VG 2–3 (samples were from individuals with Vonsattel grades ranging between 2 and 3). Pre-HD adult: pre-symptomatic HD adult; S-HD adult: symptomatic HD adult; HD Juv: HD Juvenile. The levels of a targeted amplicon (labeled “T”) are measured against a control (labeled “C”) amplicon in a MazF-digested sample and normalized against a nondigested sample. Data represent the mean ± SEM. Data were analyzed using one-way ANOVA with Tukey´s multiple comparisons test. (B) *P = 0.0141; (C) *P = 0.0169, **P = 0.0024; ***P < 0.0001. Source data are available online for this figure.
Figure 4
Figure 4. Pharmacological inhibition of METTL3 by STM2457 regulates the expression of Htt1a in HD in vitro models.
STHdhQ111/Q111 cells (A, B), YAC128 cells (C, D), and zQ175 MEFs (E, F) were treated with DMSO (vehicle (Vh)), 10 µM STM2457, or 20 µM STM2457 for 48 h. (A, C, E) Methylation ratio obtained by MazF-qPCR analysis of Htt intron 1 in (A) STHdhQ111/Q111 cells (n = 5 independent experiments; 2–4 technical replicates/experiment), (C) YAC128 (n = 4 independent experiments); and (E) zQ175 MEFs (n = 4 independent experiments) Data in (A, C, E) represent the mean ± SEM. Data were analyzed using one-way ANOVA with Tukey´s multiple comparisons test. (A) *P = 0.0470, 10 µM STM2457 compared to Vh; *P = 0.0230, 20 µM STM2457 compared to Vh; (C) *P < 0.0145. (B, D, F) qPCR analysis of Htt transcripts (FL-Htt and I1-pA1) in (B) STHdhQ111/Q111 cells, (n = 4 independent experiments; 2 technical replicates/experiment) (D) YAC128 cells (n = 4–6 independent experiments; 2–3 technical replicates/experiment) and (F) MEFs (n = 4–6 independent experiments; 2–3 technical replicates/experiment). Data in (B, D, F) represent the mean ± SEM. Data were analyzed using one-way ANOVA with Tukey´s multiple comparisons test (B) ***P =0.0006, 10 µM STM2457 compared to Vh; ***P =0.0002, 20 µM STM2457 compared to Vh; (D) **P =0.009, 10 µM STM2457 compared to Vh; **P =0.002, 20 µM STM2457 compared to Vh; (F) *P =0.013, 20 µM STM2457 compared to Vh. Source data are available online for this figure.
Figure 5
Figure 5. Target demethylation of Htt intron 1 regulates the expression of Htt1a in STHdhQ111/Q111 cells.
(A) Schematic representation of CRISPR dCas13b plasmid constructs and positions of the m6A site within Htt intron 1 mRNA and regions targeted by three different gRNAs. (B) Representative images from immunofluorescence staining of ALKBH5 in transfected STHdhQ111/Q111 cells with dCas13b (control, inactive H204A and ALKBH5). Nuclei are stained with DAPI (blue). Scale bar, 20 µm. (C) MazF-qPCR analysis of the DRACH motifs in Htt intron 1 in stably transfected cells (n = 6–9 technical replicates from 3 to 4 independent experiments). Data represent the mean ± SEM. Data were analyzed using one-way ANOVA with Tukey´s multiple comparisons test. *P = 0.0185, **P = 0.0022, ***P < 0.0001 compared to NT-gRNA. (D) qPCR analysis of the expression levels of I1-pA1 and FL-Htt transcripts in STHdhQ111/Q111 cells transfected with dCas13b-ALKBH5 (A5) combined with NT-gRNA (control) or gRNA 1, 2 and 3 (n = 4 independent experiments; 3–4 technical replicates/experiment). Data represent the mean ± SEM. Data were analyzed using one-way ANOVA with Tukey´s multiple comparisons test. I1-pA1: **P = 0.0036 (A5-gRNA3 vs NT-gRNA) and **P = 0.0014 (A5-gRNA2 vs NT-gRNA). (E) Expression levels of Htt transcripts (I1-pA1, I1-pA2, FL-Htt) in STHdhQ111/Q111 cells transfected with dCas13b-NT-gRNA, dCas13b-H204A-gRNA2 and dCas13b-A5-gRNA2 (n = 6–7 independent experiments; 2 technical replicates/ experiment). Box plot representing the distribution of relative expression normalized to NT-gRNA for the transfection with different constructs. The box extends from the first quartile to the third quartile, with a horizontal line indicating the median. The whiskers extend to the minimum and maximum values. Data were analyzed using one-way ANOVA with Tukey´s multiple comparisons test. I1-pA1: ***P = 0.0007 (A5-gRNA2 vs H204A-gRNA2), I1-pA2: **P = 0.0008 (A5-gRNA2 vs. NT-gRNA2); I1-pA2, **P = 0.0025 (A5-gRNA2 vs H204A-gRNA2). (F) RNA decay profile of Htt transcripts in transfected STHdhQ111/Q111 cells treated with actinomycin-D (Act-D) for the indicated times. Data represent the mean ± SEM (n = 4 independent experiments). Data were analyzed using one-way ANOVA with Tukey´s multiple comparisons test. (G) Histograms showing the percentage of nuclei with ɣ-H2AX foci and the average of ɣ-H2AX foci per cell in transfected STHdhQ111/Q111 cells with dCas13b-gRNA5, dCas13b-NT gRNA or dCas13b-A5 gRNA2. Data represent the mean ± SEM. Data were analyzed using Student’s t test (10–15 images from 3 to 4 independent experiments). Percentage of nuclei with ɣ-H2AX foci: *P =0.04 (gRNA2 vs A5-gRNA2), *P = 0.02 (NT-gRNA vs. A5-gRNA2); average of ɣ-H2AX foci per cell: *P =0.018 (gRNA2 vs A5-gRNA2), **P = 0.0036 (NT-gRNA vs. A5-gRNA2). Representative images of γ-H2AX foci (red) in STHdhQ111/Q111 cells. Nuclei are stained with DAPI (blue). Scale bar, 20 µm. (H) Histogram showing relative measurement of ATP in STHdhQ111/Q111 stably transfected cells. ATP was assessed with Cell Titer Glo (Promega). ATP measurements were normalized to DNA concentration. Data represent the mean ± SEM (n = 4 independent experiments; three technical replicates /experiment). Data were analyzed using one-way ANOVA with Tukey´s multiple comparisons test. ***P < 0.001. Source data are available online for this figure.
Figure 6
Figure 6. Blockage of expanded CAG repeats using LNA-CTG ASOs downregulates methylation in mHtt intron 1 RNA and decreases the levels of Htt1a.
(A) Scheme showing LNA-CTGs binding determination by the lack of PCR amplification within the LNA-bound region due to the strong incompatibility of LNA-CTG:CAG duplexes with retrotranscription and subsequent PCR amplification. HTT-e1binding sites of the primers used for PCR amplification in HTT exon 1 (HTT_e1* and HTT_e1 sets of primers) are shown. (B) Gel electrophoresis showing HTT RT-PCR products from STHdhQ111/Q111 cells transfected with different concentrations of LNA-CTG or LNA-SCB using primer sets HTT-e1* (for amplification of CAG expansions) and HTT-e1 (for amplification at 5´ of CAGs expansions). (C) qPCR analysis of the expression levels of FL-Htt and I1-pA1 transcripts in STHdhQ111/Q111 cells transfected with LNA-SCB and LNA-CTG at 0.5, 1, 5, 10 and 20 nM (n = 3–8 independent experiments; 2–3 technical replicates/experiment). Data represent the mean ± SEM. Data were analyzed using one-way ANOVA with Tukey´s multiple comparisons test. *P < 0.05 compared to LNA-SCB-transfected cells. (D) MazF-qPCR analysis of the methylation ratio of Htt intron 1 in STHdhQ111/Q111 cells transfected with 10 and 20 µM LNA-CTG or LNA-SCB. Data represent the mean ± SEM. Data were analyzed using one-way ANOVA with Tukey´s multiple comparisons test. **P < 0.01, ***P < 0.001 compared to LNA-SCB-transfected cells (n = 7 independent experiments). (EH) RIP-qPCR analysis to detect interaction between METTL3 and mHtt transcripts in STHdhQ7/Q7 treated with LNA-SCB and STHdhQ111/Q111 treated with LNA-SCB and LNT-CTGs. (E) Western blot analysis showing the presence of METTL3 in the immunoprecipitated (IP) and unbound fractions (supernatant) in STHdhQ7/Q7 and STHdhQ111/Q111 treated with LNA-SCB and LNT-CTGs. (FH) RIP-qPCR analysis showing enrichment of (F) I1-pA1, (G) I1-pA2 and (H) FL-Htt transcripts precipitated by anti-METTL3 and anti-IgG in LNA-SCB and LNA-CTG treated cells (n = 4 independent experiments). The RNA enrichment is presented as IP/input. Data represent the mean ± SEM. Data were analyzed using one-way ANOVA with Tukey´s multiple comparisons test. *P < 0.05, **P < 0.01, ***P < 0.001 compared to LNA-SCB-transfected STHdhQ7/Q7 cells. Source data are available online for this figure.
Figure EV1
Figure EV1. Comparison of somatic CAG repeat instability in 2 and 8 months old Hdh+/Q111 mice.
(A) Quantification of somatic expansion indices, of Htt CAG PCR products from tails and striatum of Hdh+/Q111 at 2 and 8 months of age using a 5% peak height threshold. Error bars represent mean ± SEM; n = 4–5/age. Data were analyzed for each tissue using Student-T test, ***P < 0.0001. (B) Representative GeneMapper traces showing somatic CAG repeat expansions in the striatum and tails at the different ages analyzed. Source data are available online for this figure.
Figure EV2
Figure EV2. m6A enrichment in Htt intron 1 of Hdh+/Q111 mice.
(A) Genome browser snapshots harboring m6A enrichment in the proximal region of Htt intron 1 to the 5’ exon1-intron 1 splice site. The sequence data, narrow Peak, and alignment data supporting the data is available NCBI GEO repository under the accession code GSE175618 (Pupak et al, 2022). (B) Comparison of fold enrichment distribution of methylation sites in the Htt intron 1 between 8- and 5-month old WT and Hdh+/Q111 mice obtained by MeRIP-seq (n = 3/genotype/age, Pupak et al 2022). (C) Mapping of m6A sites in mutant Htt1a transcripts by direct RNA sequencing. IGV snapshot show m6A sites in Htt1a transcripts in the striatum of Hdh+/Q111 mice. Mouse sequence (GRCmm39 genome) of the Htt gene including the human insert was used as reference gene (chr5: 34,919,088–35,070,342). Purple and blue dots represent high and low confidence m6A sites, respectively. (D) Schematic representation of the MazF-qPCR approach used for quantification of residue specific m6A methylation. MazF interfase enzyme only cuts at the ACA sequence when not methylated allowing for interrogation of specific m6A motifs and measurement of m6A ratio following formula shown in the figure. (E) Methylation ratio of three different m6A motifs obtained by MazF-qPCR analysis in the striatum of HdhQ7/Q7 and Hdh+/Q111 (n = 3 mice/genotype). Data represent the mean ± SEM. Data were analyzed using Student-T test. *P = 0.0416 (AGACAms), *P = 0.0144 (GGACAms). Source data are available online for this figure.
Figure EV3
Figure EV3. METTL3 knockdown with siRNA decreases I1-pA1 levels in STHdhQ111/Q111 cells.
METTL3 mRNA levels and protein expression levels analyzed by qPCR (A) and western blot (B) in STHdhQ111/Q111 transfected for 24h with non-targeting control (siRNANTC), two different targeting sequences (siRNA_1METTL3 and siRNA_2METTL3) and a pool of 3 target-specific siRNA (siRNA_PMETTL3) against METTL3. (A) qPCR analysis of the expression levels of METTL3 (n = 3–4 independent experiments; 2 technical replicates/experiment). Data represent the mean ± SEM. Data were analyzed using one-way ANOVA with Tukey´s multiple comparisons test. *P =0.0358 (siRNANTC vs, siRNA_1METTL3), ***P = 0.0009 (siRNANTC vs, siRNA_2METTL3) and ***P < 0.0001 (siRNANTC vs, siRNA_PMETTL3). (B) Western Blot analysis of the protein expression levels of METTL3. Data represent the mean ± SEM. Data were analyzed using Student-T test. **P = 0.0091 (siRNANTC vs, siRNA_1METTL3), *P = 0.027 (siRNANTC vs, siRNA_2METTL3) and *P = 0.028 (siRNANTC vs, siRNA_PMETTL3). (C) Representative western blots showing expression of METTL3 and actin used as loading control. (D) Overall m6A levels were measured using EpiQuik m6A RNA Methylation Quantification Kit in STHdhQ111/Q111 cells. Histograms show percentage of m6A levels in total RNA (n = 3–4 independent experiments; 2 technical replicates/experiment). Data were analyzed using one-way ANOVA with Tukey´s multiple comparisons test. *P = 0.0207 (siRNANTC vs, siRNA_1METTL3), ***P = 0.0003 (siRNANTC vs, siRNA_PMETTL3). (E) MazF-qPCR analysis of the DRACH motifs in Htt intron 1 (n = 4 independent experiments) in STHdhQ111/Q111 transfected for 24 h with non-targeting control (NTC) and a pool of 3 target-specific siRNA (siRNA_PMETTL3) against METTL3. Data represent the mean ± SEM. Data were analyzed using Student-T test. **P = 0.0043 (siRNANTC vs, siRNA_PMETTL3). (F) qPCR analysis of the I1-pA1 Htt transcript in STHdhQ111/Q111 transfected for 24h with non-targeting control (NTC), two different targeting sequences (siRNA_1METTL3 and siRNA_2METTL3) and a pool of 3 target-specific siRNA (siRNA_PMETTL3) against METTL3 (n = 4 independent experiments). Data represent the mean ± SEM. Data were analyzed using one-way ANOVA with Tukey´s multiple comparisons test. *P = 0.0309, **P = 0.0339 compared with cells treated with siRNANTC. Source data are available online for this figure.

References

    1. Adhikari S, Xiao W, Zhao Y-L, Yang Y-G (2016) m 6 A: signaling for mRNA splicing. RNA Biol 13:756–759 - PMC - PubMed
    1. Akhtar J, Renaud Y, Albrecht S, Ghavi-Helm Y, Roignant J-Y, Silies M, Junion G (2021) m6A RNA methylation regulates promoter-proximal pausing of RNA polymerase II. Mol Cell 81:3356–3367.e6 - PubMed
    1. Ayala-Peña S (2013) Role of oxidative DNA damage in mitochondrial dysfunction and Huntington’s disease pathogenesis. Free Radic Biol Med 62:102–110 - PMC - PubMed
    1. Cantara WA, Crain PF, Rozenski J, McCloskey JA, Harris KA, Zhang X, Vendeix FAP, Fabris D, Agris PF (2011) The RNA modification database, RNAMDB: 2011 update. Nucleic Acids Res 39:D195–D201 - PMC - PubMed
    1. Carroll SM, Narayan P, Rottman FM (1990) N6-methyladenosine residues in an intron-specific region of prolactin pre-mRNA. Mol Cell Biol 10:4456–4465 - PMC - PubMed

LinkOut - more resources