. 2025 Aug;43(8):1360-1372.
doi: 10.1038/s41587-024-02420-y. Epub 2024 Oct 11.

A comprehensive proteogenomic pipeline for neoantigen discovery to advance personalized cancer immunotherapy

Affiliations

A comprehensive proteogenomic pipeline for neoantigen discovery to advance personalized cancer immunotherapy

Florian Huber et al. Nat Biotechnol. 2025 Aug.

Abstract

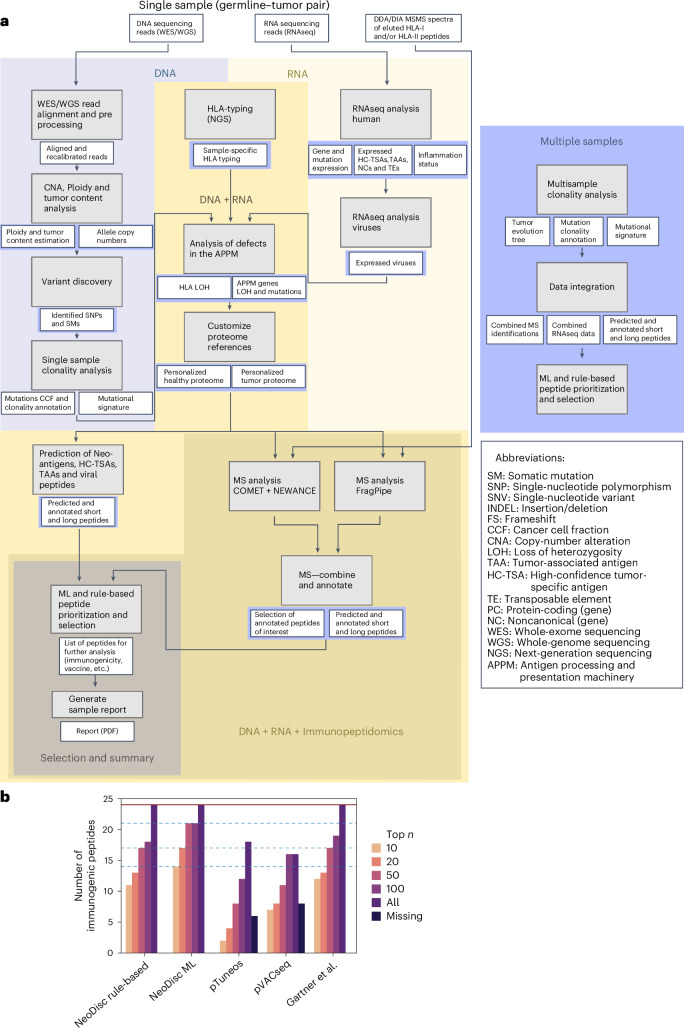
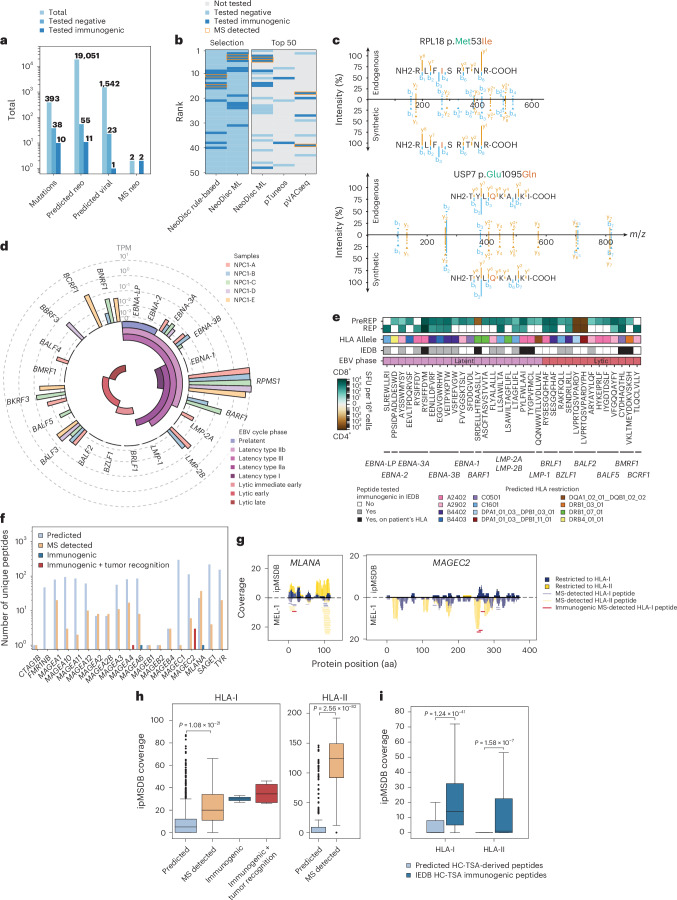
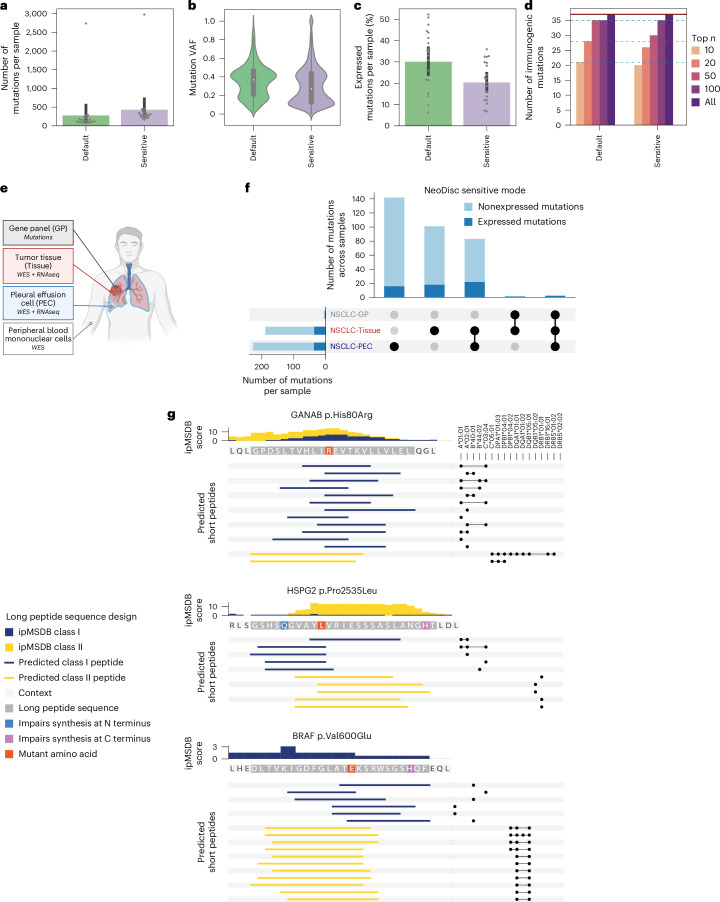
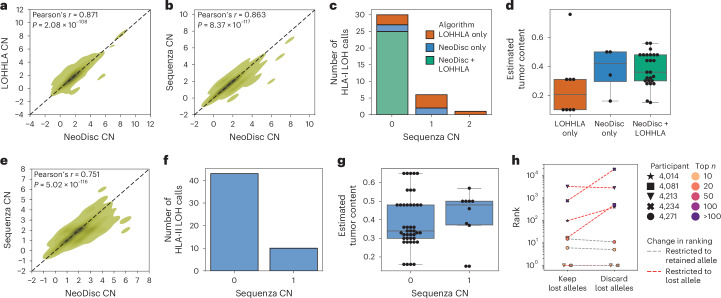
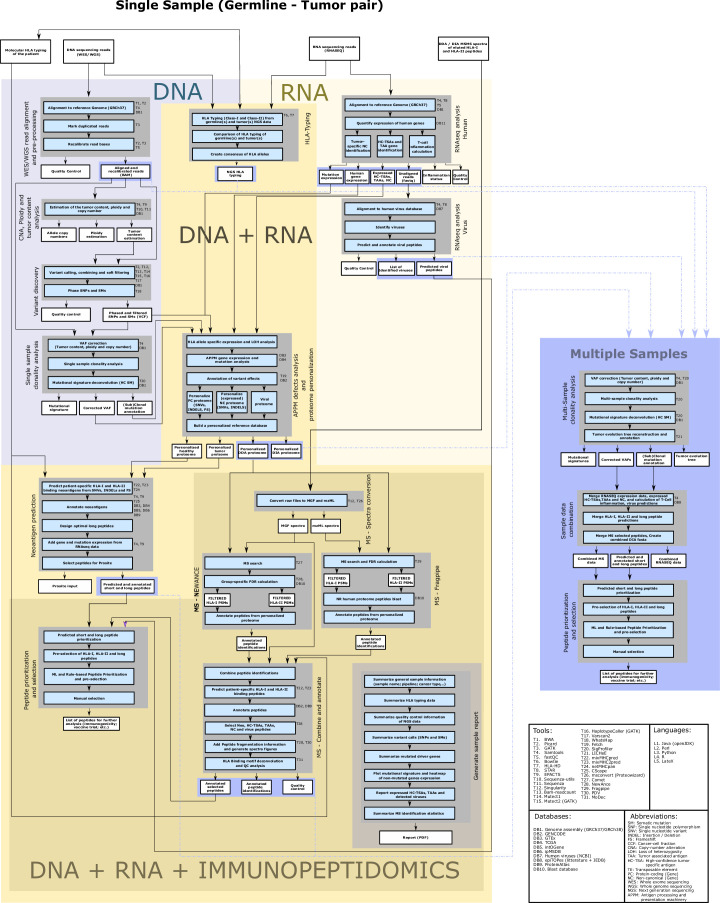
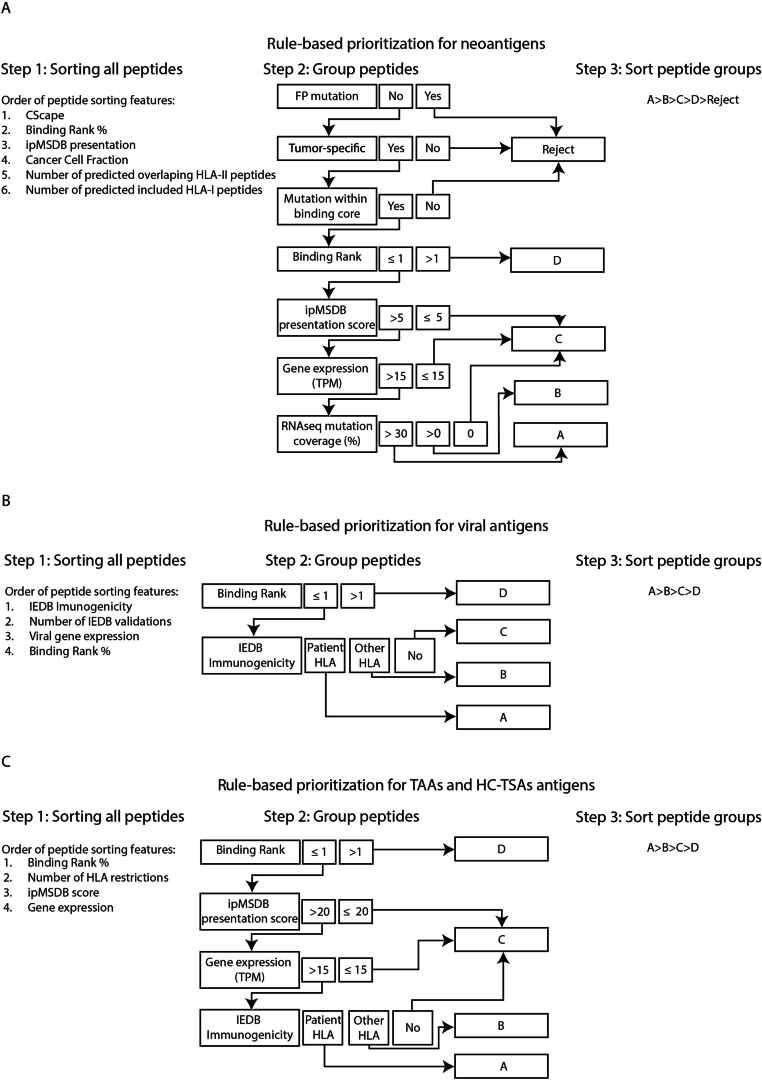
The accurate identification and prioritization of antigenic peptides is crucial for the development of personalized cancer immunotherapies. Publicly available pipelines to predict clinical neoantigens do not allow direct integration of mass spectrometry immunopeptidomics data, which can uncover antigenic peptides derived from various canonical and noncanonical sources. To address this, we present an end-to-end clinical proteogenomic pipeline, called NeoDisc, that combines state-of-the-art publicly available and in-house software for immunopeptidomics, genomics and transcriptomics with in silico tools for the identification, prediction and prioritization of tumor-specific and immunogenic antigens from multiple sources, including neoantigens, viral antigens, high-confidence tumor-specific antigens and tumor-specific noncanonical antigens. We demonstrate the superiority of NeoDisc in accurately prioritizing immunogenic neoantigens over recent prioritization pipelines. We showcase the various features offered by NeoDisc that enable both rule-based and machine-learning approaches for personalized antigen discovery and neoantigen cancer vaccine design. Additionally, we demonstrate how NeoDisc's multiomics integration identifies defects in the cellular antigen presentation machinery, which influence the heterogeneous tumor antigenic landscape.


Conflict of interest statement

Competing interests: G.C. has received honoraria from Bristol-Myers Squibb. CHUV has received honoraria for advisory services provided by G.C. to Iovance and EVIR. G.C. has received royalties from the University of Pennsylvania for CAR T cell therapy licensed to Novartis and Tmunity Therapeutics. G.C., A.H., M.A., S.B., F.H. and M.B.-S. have received royalties from the Ludwig Institute for Cancer Research, UNIL and CHUV for NeoTIL intellectual property previously licensed to Tigen Pharma. S.B., G.C. and A.H. are inventors in technologies related to T cell expansion and engineering for T cell therapy. F.H., M.M. and M.B.-S. are inventors on a patent application related to ML prioritization of neoantigens. F.H. and M.B.-S. are inventors on a patent application filed under certain subject matters disclosed herein. D.G. has received honoraria for consultations from CeCaVa and Gnubiotics. The other authors declare no competing interests.

Figures

Fig. 1
Fig. 1. NeoDisc pipeline overview and benchmarking.
a, Schematic overview of NeoDisc pipeline. Input data are shown in the top white boxes, while the different modules of NeoDisc are represented in gray boxes and their output is shown as white boxes. Background colors indicate the data types used by the modules. Arrows display the flow of data between modules. Dark blue squares, below module output boxes, highlight which data are used in combination for multiple-sample analysis. b, Number of immunogenic peptides from the NCI-test dataset (15 samples and 24 immunogenic peptides) ranked by NeoDisc rule-based algorithm, ML algorithm, pTuneos and pVACseq and reported by Gartner et al. The color of the bars indicates the number of immunogenic peptides when considering only the top n ranked peptides in each person. Horizontal dashed bars indicate the highest number of immunogenic peptides ranked in the top n across all algorithms. The red horizontal line shows the total number of immunogenic peptides.
Fig. 2
Fig. 2. Detection of immunogenic TSAs.
a, Explored antigens in CESC-1: ‘mutations’, actionable SMs; ‘predicted neo’ and ‘predicted viral’, predicted rank ≤ 2%; ‘MS neo’, MS-identified neoantigens. b, Ranking of top 50 HLA-I neoantigens tested for immunogenicity in CESC-1. Initial selection with rule-based prioritization compared to ordering of the same peptides with the ML tool (‘selection’) and to the ML, pTuneos and pVACseq prioritizations that include untested peptides (white, ‘top 50’). c, Endogenous and synthetic peptide spectral comparison of immunogenic neoantigens RPL18 p.Met53Ile and USP7 p.Glu1095Gln (cosine similarities of 0.950104 and 0.660189, respectively; mutant amino acids, red; y-ion fragments, orange; b-ion fragments, blue). d, EBV gene expression in NPC-1 through EBV cycle phases. e, IFNγ SFU per 106 cells (mean ± s.d.) from preREP and REP TILs rechallenged with EVB peptides in NCP-1 (CD8, cyan; CD4, brown). HLA alleles and predicted HLA restrictions are presented. IEDB annotations: antigen absent, white; antigen present, gray; antigen present and immunogenic on any NPC-1 HLAs, black. The EBV phase denotes the gene expression across the EBV cycle. f, Peptides derived from expressed HC-TSAs in MEL-1: predicted (rank ≤ 0.5%), blue; MS-identified, orange; immunogenic validated by IFNγ ELISpot assay, dark blue; confirmed as tumor-rejecting by TCR cloning, red. g, Comparison of ipMSDB presentation (above x axis) and binding predicted (below x axis) HLA-I (blue) and HLA-II (yellow) hotspots for MLANA and MAGEC2 for MEL-1. Binding-restricted hotspots (gray) and MS-identified and immunogenic (red) peptides are shown. h, Distribution of ipMSDB coverage of HLA-I and HLA-II predicted peptides (rank ≤ 0.5%) (HLA-I, n = 872; HLA-II, n = 464), MS-identified peptides (HLA-I, n = 110; HLA-II, n = 51), immunogenic peptides (HLA-I, n = 2) and peptides confirmed following tumor recognition assays (HLA-I, n = 4) in MEL-1 (independent one-sided t-test). i, Comparison of ipMSDB coverage across all HC-TSA predicted binder peptides annotated as immunogenic in IEDB (HLA-I, n = 91; HLA-II, n = 42) and HC-TSAs not annotated as immunogenic in IEDB (HLA-I, n = 14,721; HLA-II, n = 16,769) (independent one-sided t-test). The box plot center lines represent the median. The bounds of the box represent the 25th and 75th percentiles (interquartile range (IQR)). The whiskers extend to the smallest and largest values within 1.5× the IQRs. Individual dots represent minima and maxima beyond the whiskers. Source data
Fig. 3
Fig. 3. Mutation prioritization and personalized vaccine design.
ac, Comparison of NeoDisc default and sensitive modes across all NCI-test samples on the number of SMs identified per sample (n = 20 samples) (a), VAF of the identified SMs (n = 20 samples) (b) and percentage of mutations supported by RNAseq reads (n = 20 samples) (c). d, Number of immunogenic mutations from the NCI-test dataset (20 samples and 37 immunogenic mutations) ranked by NeoDisc ML algorithm in default and sensitive mode. The bar colors indicate the number of immunogenic mutations identified in the top n ranked mutations in each participant. Horizontal dashed lines indicate the highest number of immunogenic mutations ranked in the top n. The red horizontal line shows the total number of immunogenic mutations. e, Schematic overview of samples available for participant NSCLC-1. f, Number of actionable SMs identified with NeoDisc’s sensitive mode in NSCLC-1-Tissue and NSCLC-1-PEC samples compared to the GP. The number of SMs per sample is shown with bars on the left. The distribution of mutations across samples is shown with the top bars, with connected dots highlighting in which sample(s) they were identified. g, Three examples of long neoantigen peptide sequences designed by NeoDisc based on short peptide predictions and hotspot annotation. Sorted (top to bottom) HLA-I and HLA-II predicted neoantigens considered for the design of the long peptide sequence are displayed below the long peptide sequence in dark blue and yellow, respectively. The connected dots indicate which allele(s) the short HLA-I and HLA-II peptides are predicted to bind. For the bar plots, the heights of the bars represent the mean value and error bars represent the 95% confidence interval of the bootstrap distribution. For the violin plot, the center dot represents the median. The bounds of the box represent the 25th and 75th percentiles, indicating the IQR. The whiskers extend to the smallest and largest values within 1.5× the IQR from the 25th and 75th percentiles, respectively. Panel e created with BioRender.com. Source data
Fig. 4
Fig. 4. HLA CN analysis and LOH event detection.
a, Comparison of decimal CN estimation of 346 heterozygous HLA-I alleles from the NCI cohort (n = 68 samples) reported by NeoDisc (x axis) and LOHHLA (y axis). b, Comparison of rounded CN estimation of 389 (homozygous and heterozygous) HLA-I alleles from the NCI cohort (n = 68 samples) reported by NeoDisc (x axis) and Sequenza (y axis). c, Sequenza estimation of HLA-I CN (x axis) of all NeoDisc and LOHHLA HLA-I loss calls (n = 17 participants and 37 events; y axis). Colors indicate common and tool-specific calls. d, Tumor content estimation of samples with HLA-I loss calls (n = 37 samples). e, Comparison of rounded CN estimation of 639 (homozygous and heterozygous) HLA-II alleles from the NCI cohort (n = 68 samples) reported by NeoDisc (x axis) and Sequenza (y axis). f, HLA-II CN estimated by Sequenza (x axis) of all NeoDisc HLA-II loss calls (n = 18 samples and 53 events; y axis). g, Tumor content estimation of samples with HLA-II loss calls (n = 53 events). The box plot center lines represent the median. The bounds of the box represent the 25th and 75th percentiles (IQR). The whiskers extend to the smallest and largest values within 1.5× the IQR. Individual dots represent minima and maxima beyond the whiskers. All individual values are shown as dots. h, Comparison of the effect of keeping or discarding lost HLA-I alleles from the ML prioritization on the ranking of immunogenic peptides from the NCI samples with HLA-I loss (n = 5 samples and 8 peptides). In a, b and e, correlation coefficients and P values were calculated using a two-sided Pearson test. Source data
Fig. 5
Fig. 5. Altered antigenic landscape mediated by HLA LOH and APPM defects.
a, Inferred HLA allele-specific CN and their expression level in participant MEL-2, represented as bars and connected dots above, respectively. b, HLA allele distribution of all unique MS-identified antigen sequences (left, n = 27,910) and of HC-TSAs (right, n = 37) from participant MEL-2. c, mIF staining of a tumor tissue sample derived from participant MEL-2 (n = 1 slide). d, mIF quantification of HLA-ABC and HLA-DR on cancer cells (Sox10+) from participant MEL-2 (n = 352 tiles). e, Genome-wide CNVs in samples MEL-3-A (top), MEL-3-B (center) and MEL-3-C (bottom). Chromosomal segments are displayed along the x axis and their estimated minor and major CNs are displayed along the y axis. The color map represents the CCF of the B2M p.Glu67fs mutation across samples. f, Inferred HLA allele-specific CNs and their expression level in participant MEL-3, represented as bars and connected dots above, respectively. g, Expression levels of B2M in healthy sun-exposed skin (GTEx, n = 701), MEL samples (TCGA, n = 468) and MEL-3 samples, correlated with B2M CCF. The box plot center lines represent the median. The bounds of the box represent the 25th and 75th percentiles (IQR). The whiskers extend to the 5th and 95th percentiles. h, mIF staining of a tumor tissue sample derived from participant MEL-3 (n = 1 slide). i, mIF quantification of HLA-ABC and HLA-DR on cancer cells (Sox10+) from participant MEL-3 (n = 605 tiles). Source data
Fig. 6
Fig. 6. Deep characterization of sample heterogeneity in MEL-4.
a, Phylogenetic tree of tumors and cell lines, annotated with mutations in known driver genes (black) and B2M defects (red). b, mIF-derived CD8+ T cell infiltration in GI and P samples. Dots represent CD8 densities in the stroma and tumor in each tile. c, Digital reconstruction and density map from mIF quantification of Sox10+ cells expressing HLA-ABC and HLA-DR in GI and P lesions. d, mIF quantification of HLA-ABC and HLA-DR on cancer cells (Sox10+) GI and P lesions. e, Heat map comparing expression levels of genes encoding for TSAs in healthy tissues (GTEx, 90th percentile expression value; left) and MEL-4 tumors and the HLA-low and HLA-high isogenic cell lines derived from the P lesion with and without IFNγ treatment (right). f, DIA-based quantification of HLA-I and HLA-II tumor-specific peptides identified by MS DDA and DIA across MEL-4 tumors and cell lines with and without IFNγ treatment. Gray boxes reflect the absence of detection. g, FACS quantification of HLA in the primary P lesion cell line. Diagram of HLA-low and HLA-high cell isolation by FACS sorting and histograms of HLA-ABC expression of isolated HLA-low and HLA-high populations before and after IFNγ treatment. h, Expression levels of genes involved in the APPM. Green and orange boxes show their expression levels in healthy sun-exposed skin (GTEx, n = 701 samples) and MEL samples (TCGA, n = 468 samples), respectively. Connected dots represent gene expression levels in HLA-high and HLA-low cell lines treated or not with IFNγ. In box plots, the center line represents the median. The bounds of the box represent the 25th and 75th percentiles, indicating the IQR. The whiskers extend to the smallest and largest values within 1.5× the IQR from the 25th and 75th percentiles, respectively. i, Tumor reactivity of antigen-specific TCR clonotypes from MEL-4. Reactivity was assessed by CD137 upregulation of TCR-transfected primary autologous activated CD8+ T cells following coculture with IFNγ-treated or untreated HLA-low and HLA-high isogenic cell lines. Data are presented as the mean values ± s.d. of technical replicates (n = 2). The positivity threshold is described in the Methods. Irr_Ctrl, irrelevant TCR; mock, transfection with water. Panel g created with BioRender.com. Source data
Extended Data Fig. 1
Extended Data Fig. 1. Detailed overview of the NeoDisc pipeline.
Input data are shown in the top white boxes, while the different modules of NeoDisc are represented in gray boxes, with steps in the analysis shown as light blue boxes, and their output is shown as white boxes. Background colors indicate the data types used by the modules. Arrows display the flow of data between modules. Dark blue squares, below module output boxes, highlight which data are used in combination for multiple sample analysis. Tools and databases are annotated next to the blue boxes.
Extended Data Fig. 2
Extended Data Fig. 2. NeoDisc rule-based prioritization.
a) Flow chart of NeoDisc rule-based prioritization for HLA-I and HLA-II neoantigens. b) Flow chart of NeoDisc rule-based prioritization for HLA-I and HLA-II viral antigens. c) Flow chart of NeoDisc rule-based prioritization for HLA-I and HLA-II HC-TSAs.
Extended Data Fig. 3
Extended Data Fig. 3. Immunogenicity of tumor-specific antigens.
a) Epitope mapping of preREP TILs from sample CESC-1 (IFNγ Spot Forming Unit (SFU) per 106 cells, mean +/− SD). CD8 neoantigens (in green) and CD8 viral antigen (in blue) were validated by CD137 up-regulation. b) Gating strategy of CD137 up-regulation on CD8 + REP TILs from sample NPC-1 following the stimulation with EBNA-3A viral peptide (RYSIFFDYM). D) Expression level of EBV genes, either detected as expressed (>0 TPM) or tested immunogenic in patient NPC-1. The height of the bars corresponds to the gene expression levels across the samples. The inner bars display the expression pattern of the genes through EBV cycle phases. c) Viral epitope mapping of preREP TILs from sample NPC-1 (IFNγ SFU per 106 cells, mean +/− SD). d) Viral epitope mapping of REP TILs from sample NPC-1 (middle) (IFNγ SFU per 106 cells, mean +/− SD). Flow cytometry data showing the frequency of EBNA-3A (RYSIFFDYM)-reactive CD8 T-cells (left) and the frequency of BALF2 (LVPRTQSVPARDYPH)-reactive CD4 T-cells (right). C-D) CD8 and CD4 reactivities, assessed by CD137 up-regulation, are shown in blue and orange, respectively. e) CD8 HC-TSA reactivity of REP TILs from sample MEL-1 (IFNγ SFU per 106 cells, mean +/− SD). HC-TSA reactivities also validated as tumor-rejecting antigens (by TCR cloning) are shown in red. All peptides were identified by MS. f) Tumor reactivity of antigen-specific TCR clonotypes from sample MEL-1. Reactivity assessed by CD137 up-regulation of TCR-transfected primary activated CD8+ T cells following co-culture with autologous tumor cells. Positivity threshold described in the Methods section. (Irr_Ctrl: irrelevant TCR, Mock: transfection with water).
Extended Data Fig. 4
Extended Data Fig. 4. Mutations identification and personalized vaccine design.
a) Number of actionable SMs identified with NeoDisc’s default mode in NSCLC1-Tissue and NSCLC1-PEC samples, compared to the gene panel. The total number of SMs per sample is shown with bars on the left. Distribution of the mutations across samples is shown with the top bars, connected dots highlighting in which sample(s) they were identified. b) Top-10 long neoantigen peptide sequences designed by NeoDisc based on short peptide predictions and hotspot annotation. Sorted (top to bottom) HLA-I and -II predicted neoantigens considered for the design of the long peptide sequence are displayed below the long peptide sequence in dark blue and yellow, respectively. The connected dots indicate which allele(s) the short HLA-I/II peptides are predicted to bind.
Extended Data Fig. 5
Extended Data Fig. 5. HLA LOH analysis.
a) Example of HLA-A alleles copy-number estimation in patient MEL-3. The horizontal axis shows HLA-A exons and on the Y axis are shown (top to bottom) estimated b-allele frequency (BAF), LogR, copy-numbers (CN), depth ratio and RNAseq support (% RNAseq reads) between HLA-A*25:01:01 (red) and HLA-A*02:05:01 (blue). b) Example of the two naive Bayes classifiers trained on MEL-3 exome-wide copy-number estimations for the prediction of HLA copy numbers. Density of the copy-numbers depth ratio used for training classifier one is shown at the top left. Bottom left shows the confusion matrix of classifier one. Density of the copy-numbers allele frequency alone and in combination with the depth ratio, both used for the training of classifier two, are shown at the top center and right, respectively. Bottom right shows the confusion matrix of the classifier two. c) Immunogenicity assessment of REP TILs from sample MEL-2 (IFNγ SFU per 106 cells, mean +/− SD). CD8 (in green) and CD4 (in violet) neoantigen reactivity was validated by CD137 upregulation. Predicted HLA binder is annotated below the peptide sequence. d) Separate channels of mIF staining of a tumor tissue sample derived from patient MEL-2 (n = 1 slide). e) Separate channels of mIF staining of a tumor tissue sample derived from patient MEL-3 (n = 1 slide).
Extended Data Fig. 6
Extended Data Fig. 6. Extended characterization of samples heterogeneity in MEL-4.
a) T-cell inflammation heatmap of the GI and P tumor samples, in the context of all skin cutaneous melanoma patients in TCGA (n = 468). The top bar shows the inferred inflammation status. The rows represent expression values of immune related genes, and the color indicates their expression level. MEL-4 samples are highlighted at the top and annotated with B2M deficiencies. b) Expression levels of genes involved in the APPM. Green and Orange boxes show healthy sun-exposed skin (GTEx, n = 701 samples) and melanoma (TCGA, n = 468 samples) expression levels of the genes, respectively, and connected dots represent gene expression in MEL-4 tissues. In boxplots, the center line represents the median. The bounds of the box represent the 25th and 75th percentiles, indicating the IQR. The whiskers extend to the smallest and largest values within 1.5 times the IQR from the 25th and 75th percentiles, respectively. c) mIF staining of the GI and P lesions (n = 1 slide). d) Number of peptides identified by MS DDA and DIA in all MEL-4 samples. Binders are defined by a predicted binding rank ≤ 2. The percentage over the blue bar indicates the percentage of binders over the total, written next to the bar. e) Gene expression, represented as color intensity, and DIA-based quantification (as the sum of HLA-I and HLA-II intensities; shown as the width of the circles) of genes encoding for MS-identified tumor-specific peptides across MEL-4 tumors (top) and cell-lines treated or not with IFNγ (bottom). f) Peptide (n = 106) intensities in the tissues (left) and in the cell lines (right) separated between samples without (blue) and with (red) B2M p.Ser31fs. Paired one-sided t-test was applied to assess differences in the distributions. g) Antigen reactivity validation of ELOVL1(P149S)-specific TCR clonotypes from patient MEL-4. Reactivity assessed by luminescence of TCR-transfected Jurkat cells following co-culture with autologous CD4 blasts loaded with neoepitope HSVLSWSWW. Data are presented as mean values +/− SD of technical replicates (n = 2). (CD4 blasts alone: unloaded, Irr_Ctrl: irrelevant TCR, Mock transfection with water, RLU: Relative Light Unit).

Similar articles

Cited by

References

    1. De Mattos-Arruda, L. et al. Neoantigen prediction and computational perspectives towards clinical benefit: recommendations from the ESMO Precision Medicine Working Group. Ann. Oncol.31, 978–990 (2020). - PMC - PubMed
    1. Chong, C., Coukos, G. & Bassani-Sternberg, M. Identification of tumor antigens with immunopeptidomics. Nat. Biotechnol.40, 175–188 (2022). - PubMed
    1. Rieder, D. et al. nextNEOpi: a comprehensive pipeline for computational neoantigen prediction. Bioinformatics38, 1131–1132 (2022). - PMC - PubMed
    1. Schenck, R. O., Lakatos, E., Gatenbee, C., Graham, T. A. & Anderson, A. R. A. NeoPredPipe: high-throughput neoantigen prediction and recognition potential pipeline. BMC Bioinformatics20, 264 (2019). - PMC - PubMed
    1. Tang, Y. et al. TruNeo: an integrated pipeline improves personalized true tumor neoantigen identification. BMC Bioinformatics21, 532 (2020). - PMC - PubMed