. 2024 Nov;21(11):2128-2134.
doi: 10.1038/s41592-024-02454-9. Epub 2024 Oct 11.

Single-shot 20-fold expansion microscopy

Affiliations

Single-shot 20-fold expansion microscopy

Shiwei Wang et al. Nat Methods. 2024 Nov.

Abstract

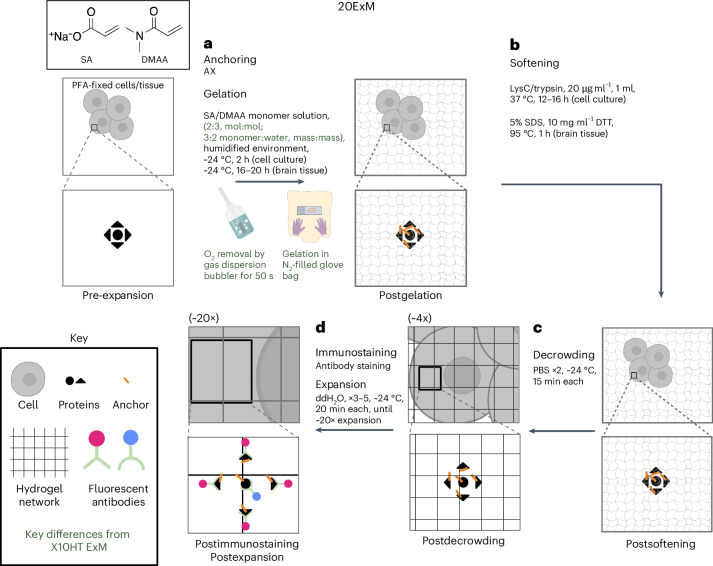
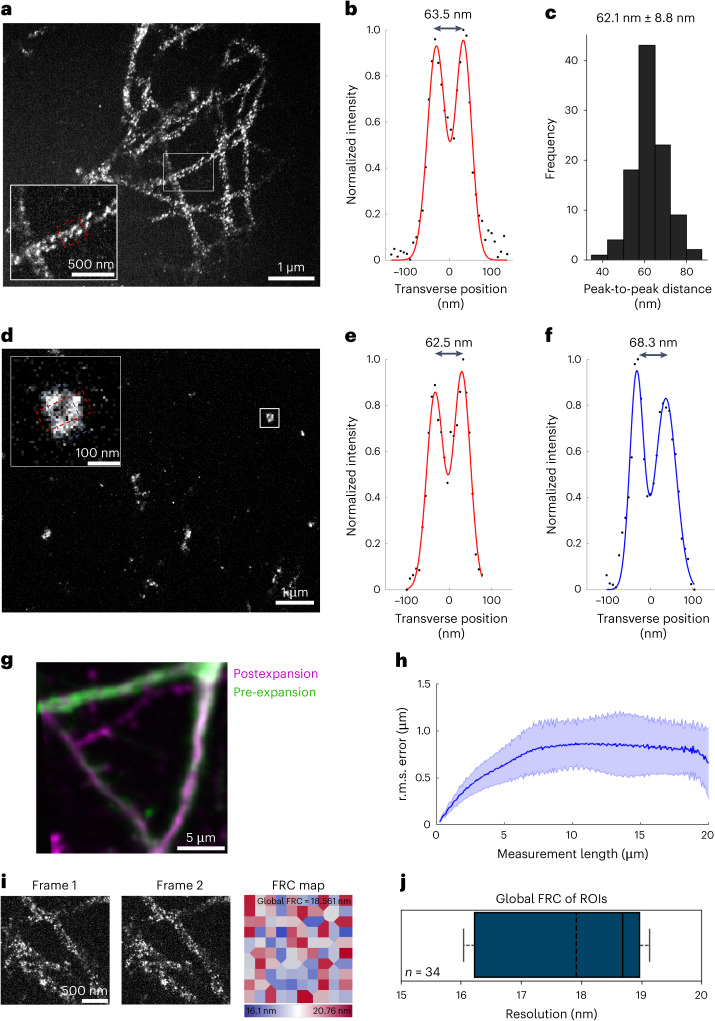
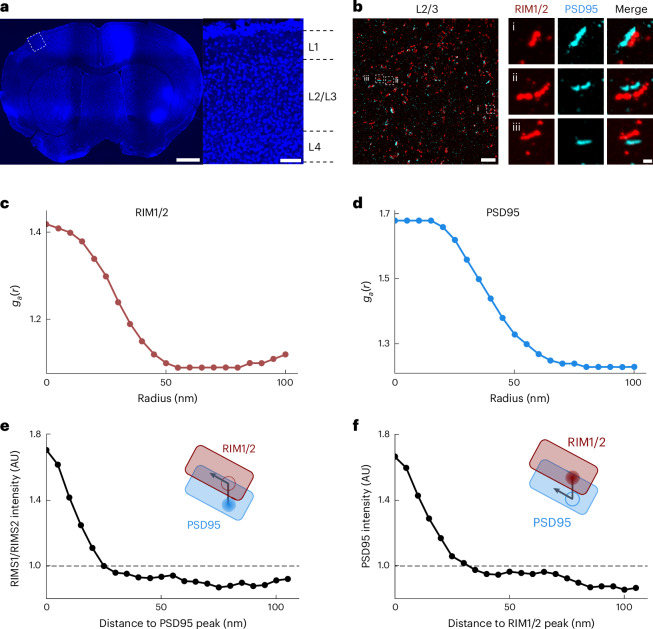
Expansion microscopy (ExM) is in increasingly widespread use throughout biology because its isotropic physical magnification enables nanoimaging on conventional microscopes. To date, ExM methods either expand specimens to a limited range (~4-10× linearly) or achieve larger expansion factors through iterating the expansion process a second time (~15-20× linearly). Here, we present an ExM protocol that achieves ~20× expansion (yielding <20-nm resolution on a conventional microscope) in a single expansion step, achieving the performance of iterative expansion with the simplicity of a single-shot protocol. This protocol, which we call 20ExM, supports postexpansion staining for brain tissue, which can facilitate biomolecular labeling. 20ExM may find utility in many areas of biological investigation requiring high-resolution imaging.


Conflict of interest statement

S.W., T.W.S., H.B.Y., Y.L., L.L.K. and E.S.B. are co-inventors on a patent application for 20ExM. E.S.B. is cofounder of a company seeking to deploy applications of ExM-related technologies. P.Y. is cofounder, director and consultant of Ultivue, Inc., and Digital Biology, Inc. The other authors declare no competing interests.

Figures

Fig. 1
Fig. 1. Single-shot 20ExM.
ad, Workflow for expanding cell culture and tissue samples ~20-fold with only one gelation step. Key differences from the published X10HT protocol (ref. ) are shown in green text; PFA, paraformaldehyde; AX, N-acryloxysuccinimide; DTT, dithiothreitol; PBS, phosphate-buffered saline; ddH2O, double-distilled water. For steps after decrowding (c), the linear expansion factor of the hydrogel–specimen composite is shown in parentheses above the schematic of the step. a, Cell culture or tissue samples are treated to attach gel-anchorable groups to proteins. The sample is then permeated with monomer solution and incubated to form a superabsorbent polyacrylate hydrogel. b, Samples are incubated in a softening buffer to denature proteins. c, Softened samples are washed in a buffer to partially expand them. d, Samples are stained with antibodies and fully expanded by immersion in water.
Fig. 2
Fig. 2. Validation of the nanoscale precision of 20ExM.
a, Confocal image (maximum intensity projection from one representative experiment of three culture batches) of expanded HEK293 cells with pre-expansion microtubule staining. The inset shows a magnified view of the white boxed region. Brightness and contrast settings were set using Fiji’s autoscaling function. Quantitative analysis in b and c was conducted on raw image data. b, Transverse profile of microtubules in the red dotted boxed region of the inset in a after averaging down the long axis of the box and then normalizing to peak value (black dots), with superimposed fit with a sum of two Gaussians (red lines). c, Population data for peak-to-peak distances of 100 microtubule segments (mean ± s.d. from 21 cells from three culture batches). d, Confocal image (single xy plane from one representative experiment of three culture batches) of expanded HEK293 cells with pre-expansion microtubule staining. The inset shows a magnified view of the white boxed region, highlighting the microtubule circular cross-section. Brightness and contrast settings were set using Fiji’s autoscaling function. Quantitative analysis in e and f was conducted on raw image data. e, As in b but for the red dotted box in the inset of d. f, As in b but for the blue dotted box in the inset of d. g, Nonrigidly registered pre-expansion ×40 magnification confocal image (green) and postexpansion ×4 magnification confocal image (magenta) of the same region in the same Thy1–yellow fluorescent protein mouse brain slice (from one representative experiment of two brain slices from one mouse). h, r.m.s. measurement error as a function of measurement length of data acquired as in g (blue line, mean; shaded area, ±1 s.d.; n = 6 areas from two brain slices from one mouse). i, To measure resolution, we used block-wise FRC resolution analysis. The method requires more than one independent image of the same region for noise realization. Left and middle, two independent confocal images (single xy plane) of expanded HEK293 cells with pre-expansion microtubule staining, showing the same region of interest under the same imaging conditions. Right, local mapping of FRC resolution values. A global FRC resolution is calculated by averaging FRC resolution values across all blocks. j, Box plot of global FRC resolution calculated for n = 34 regions of interest from two culture batches (black vertical line, median; dotted vertical line, mean; leftmost edge of the box, first quartile; rightmost edge of the box, third quartile; left dotted line extended from the box, first quartile minus 1.5× the interquartile range; right dotted line extended from the box, third quartile plus 1.5× the interquartile range). Scale bars are provided in biological units (that is, physical size divided by expansion factor) for all images; ROIs, regions of interest. Source data
Fig. 3
Fig. 3. 20ExM reveals synaptic nanoarchitecture in mouse brain tissue.
a, Confocal image of a DAPI-stained mouse brain slice (left) and zoomed-in view (right) of the white dotted boxed region showing layers 1–4 of the somatosensory cortex (from one representative experiment of two brain slices from one mouse). b, Maximum z intensity-projected confocal image of layers 2 and 3 of the mouse somatosensory cortex after performing 20ExM and postexpansion immunostaining with antibodies to RIM1/2 (red) and PSD95 (cyan). Left, low-magnification image. Right, zoomed-in images of the three white dotted boxes (iiii) with separate channels for each antibody along with the merged image. The image shown is from a representative experiment using four brain slices from two mice. Brightness and contrast settings were first set by Fiji’s autoscaling function and then manually adjusted to improve contrast and highlight the boundary of the synapses; quantitative analysis in cf was conducted on raw image data. c,d, Autocorrelation analysis, as described in refs. ,, for RIM1/2 (c) and PSD95 (d; n = 90 synapses from four brain slices from two mice). Autocorrelation analysis examines the protein distribution. A uniform distribution would be predicted if baseline ga(r) values are observed at all radii, whereas a nonuniform distribution with regions of high local intensity would be predicted if high ga(r) values are observed at short radii and decay as the radius is increased. e,f, Enrichment analysis that calculates the average molecular density for RIM1/2 to PSD95 peak (e) and PDS95 to RIM1/2 peak (f; n = 90 synapses from four brain slices from two mice). Enrichment values above 1 represent regions of high local intensity in the measured channel, so the enrichment profiles in e and f suggest that the peak of the reference channel closely aligns with the regions of high intensity in the measured channel for both comparisons. Therefore, this suggests that enriched regions of RIM1/2 and PSD95 are aligned in nanoscale precision with each other, consistent with previous studies,. Scale bars are provided in biological units: 1,000 µm (left) and 100 µm (right; a), 1 µm (left) and 100 nm (right, i–iii; b); AU, arbitrary units.
Extended Data Fig. 1
Extended Data Fig. 1. Molecular mechanism of DMAA gel polymerization.
DMAA polymerization follows similar initiation and propagation steps as bis-acrylamide gels. However, the crosslinking is achieved by hydrogen extraction and radical transfer (branching). Since the intermediate radicals in this reaction are especially susceptible to reaction with oxygen, the effectiveness of the branching (crosslinking) step will be impacted by the concentration of dissolved oxygen in the gelation solution (ref. ).
Extended Data Fig. 2
Extended Data Fig. 2. Oxygen-control setup of 20ExM.
(a) The gas dispersion tube is connected to a compressed nitrogen cylinder. With minimal N2 flow, the gas dispersion tube is placed within the gelation solution, with the sponge part fully wetted and generating bubbles. If the N2 flow is too strong, the gelation solution will evaporate rapidly and freeze. (b) The glove bag is connected to a compressed nitrogen cylinder. All tools required are listed in the figure. All gelation steps are conducted at room temperature (no ice or ice block is needed).
Extended Data Fig. 3
Extended Data Fig. 3. Examples of gelation chamber construction and handling.
(a-c) Example gelation chamber construction for tissue. (d-f) Example gelation chamber construction for cell culture. The capping of the gelation chamber (c,f) is performed within the glove bag. (g) Example setup of the airtight humidified chamber, as described in Extended Data Fig. 2b. (h) Example of handling glass slides inside the glove bag. The platform (plate lid) can be used to move glass slides inside the glove bag.
Extended Data Fig. 4
Extended Data Fig. 4. Reproducibility and time dependence of 20ExM without biological specimen embedded.
(a) Fully expanded gels made in 5 different batches with gelation time of 1 hour, all reaching an expansion factor of ~16x. Unexpanded gels were cut into ~0.5 × 0.5 cm shapes (note, the shapes were not exactly rectangular – they were the shapes shown) and expanded gels are ~8 × 8 cm. (b) Fully expanded gels with various gelation times. Unexpanded gels were cut into ~0.5 × 0.5 cm shapes (note, the shapes were not exactly rectangular – they were the shapes shown). Expansion factor and gelation time are indicated in the figure. Right side: same images as the left side, with border of gels highlighted by white dotted lines. Scale bars: 1 cm.
Extended Data Fig. 5
Extended Data Fig. 5. Applications of 20ExM.
(a) Confocal image (maximum intensity projection; from one representative experiment from two culture batches) of expanded NUP96::Neon-AID DLD-1 cells with pre-expansion anti-mNeonGreen staining, with some NPCs highlighted by white dotted circles. Inset: magnified view of the white boxed region. Note: We noticed some single-puncta signals that did not participate in a ring. These could be parts of other nuclear pore complexes (for example, partially assembled), or incompletely stained nuclear pore complexes, or nonspecific staining. We did not use a special NPC preparation strategy, as is common for microtubules. More specialized fixation and extraction methods, such as permeabilization with detergent prior to fixation, cryofixation with methanol, or extracting nuclei from intact cells prior to staining and expansion, might in principle further improve staining quality (of course, such practices, while they may improve the appearance of NPCs, do not resemble a typical ExM user’s application, nor is it representative of methods that optimally preserve general biological ultrastructure). However, in earlier best-practices ExM studies visualizing nuclear pore complexes, even with specialized fixation, purification, and staining methods designed to optimize nuclear pore appearance, the investigators often observed single puncta that did not appear to be part of a ring (ref. ). This reference, which claimed similar resolution to what we show here (albeit with an iterative form of expansion microscopy), also reported images and numbers similar to ours regarding the shapes of nuclear pores, the number of corners of each nuclear pore, and the diameters of nuclear pores. Our goal in the current study was not to study NPCs, but rather to validate the resolution and gel-contributed error of 20ExM with NPCs. Furthermore, our goal was not to better earlier iterative methods like iExM or ExR, but rather to show that such performance could be achieved in a single step. Since our current protocol was sufficient to for these purposes, and indeed, matched the performance of previous best-practices expansion microscopy protocols when tested against nuclear pore visualization, we did not pursue further optimization. Expansion factor: 22.8 ± 0.4 as measured by physical gel size (n = 2 culture batches). Brightness and contrast settings: first set by Fiji’s auto-scaling function and then manually adjusted to improve contrast for the stained structures of interest; quantitative analysis in b–d was conducted on raw image data. (b) Box plot of radius of 35 NPCs in top view (from n = 7 cells from two culture batches; black horizontal line, median; dotted horizontal line, mean; upper edge of the box, first quartile; lower edge of the box, third quartile; top dotted line extended from the box represents first quartile minus 1.5x the inter-quartile range; bottom dotted line extended from the box represents third quartile plus 1.5x the inter-quartile range). (c) Population data for 35 NPCs (from n = 7 cells from two culture batches), showing a histogram of corners per NPCs. (d) Box plot of distances between adjacent corners of 35 NPCs in top view (from n = 108 measurements of 35 NPCs from 7 cells from two culture batches; black horizontal line, median; dotted horizontal line, mean; upper edge of the box, first quartile; lower edge of the box, third quartile; top dotted line extended from the box represents first quartile minus 1.5x the inter-quartile range; bottom dotted line extended from the box represents third quartile plus 1.5x the inter-quartile range). (e) Confocal image (maximum intensity projection; from one representative experiment from two culture batches) of expanded HEK293 cells with pre-expansion anti-TOM20 (red) staining and post-expansion DAPI (blue) staining. (f) Confocal image (single-xy plane; from one representative experiment of two kidney slides from one mouse) of mouse kidney after performing 20ExM and post-expansion NHS-AlexaFluor488 staining. (g) Confocal image (single-xy plane; from one representative experiment of two spleen slides from one mouse) of mouse spleen after performing 20ExM and post-expansion NHS-AlexaFluor488 staining. (h) Confocal image (single-xy plane; from one representative experiment of two spleen slides from one mouse) of mouse spleen after performing 20ExM and post-expansion NHS-AlexaFluor488 staining. Expansion factor for f–h: 16.5 ± 0.4 (n = 2 spleen, 2 kidney sections from 1 mouse; measured by physical gel size). Scale bars are provided in biological units (that is, physical size divided by expansion factor) throughout all figures: (a) 250 nm and 50 nm in inset, (e) 1 µm, (f) 5 µm, (g) 5 µm, (h) 2 µm. Source data

References

    1. Chen, F., Tillberg, P. W. & Boyden, E. S. Expansion microscopy. Science347, 543–548 (2015). - PMC - PubMed
    1. Tillberg, P. W. et al. Protein-retention expansion microscopy of cells and tissues labeled using standard fluorescent proteins and antibodies. Nat. Biotechnol.34, 987–992 (2016). - PMC - PubMed
    1. Truckenbrodt, S. et al. X10 expansion microscopy enables 25-nm resolution on conventional microscopes. EMBO Rep.19, e45836 (2018). - PMC - PubMed
    1. Saal, K. A. et al. Heat denaturation enables multicolor X10-STED microscopy. Sci. Rep.13, 5366 (2023). - PMC - PubMed
    1. Truckenbrodt, S., Sommer, C., Rizzoli, S. O. & Danzl, J. G. A practical guide to optimization in X10 expansion microscopy. Nat. Protoc.14, 832–863 (2019). - PubMed

LinkOut - more resources