. 2024 Nov;25(11):2124-2139.
doi: 10.1038/s41590-024-01986-8. Epub 2024 Oct 11.

Spatial microniches of IL-2 combine with IL-10 to drive lung migratory TH2 cells in response to inhaled allergen

Affiliations

Spatial microniches of IL-2 combine with IL-10 to drive lung migratory TH2 cells in response to inhaled allergen

Kun He et al. Nat Immunol. 2024 Nov.

Abstract

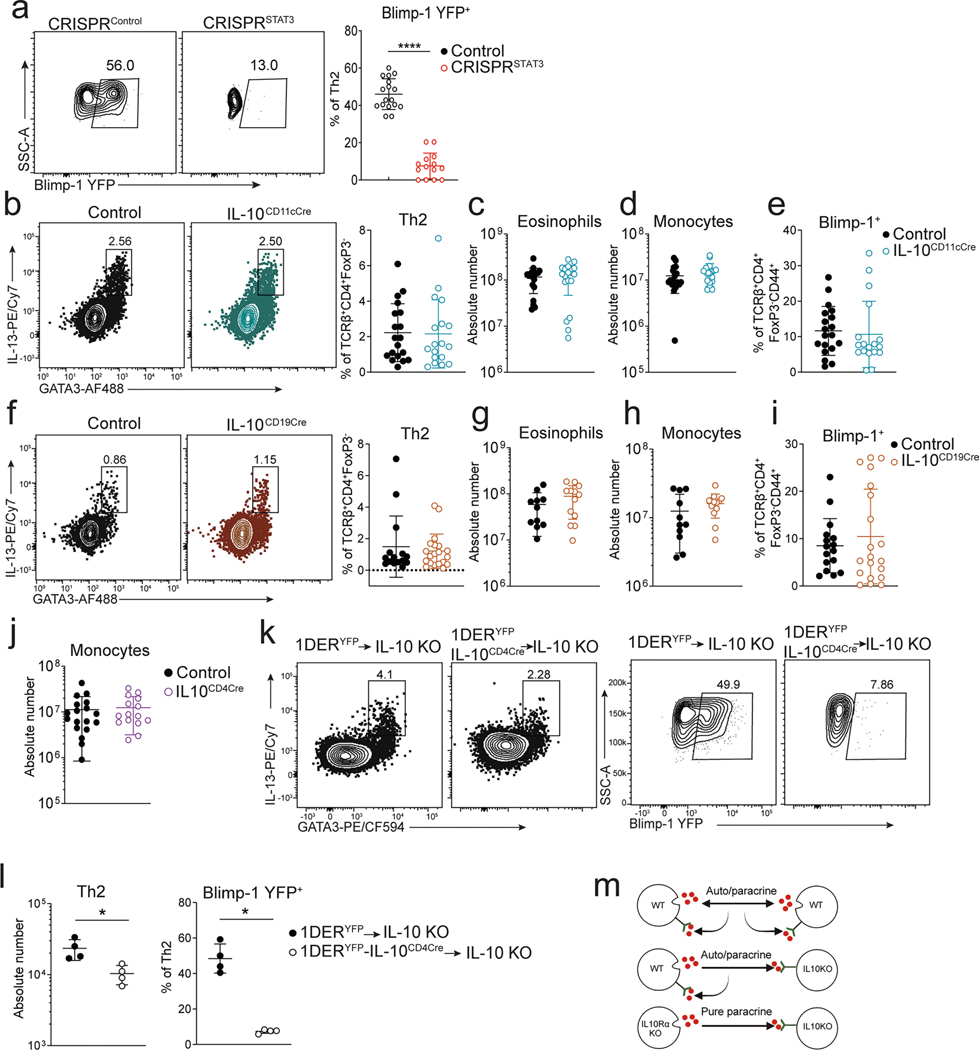
The mechanisms that guide T helper 2 (TH2) cell differentiation in barrier tissues are unclear. Here we describe the molecular pathways driving allergen-specific TH2 cells using temporal, spatial and single-cell transcriptomic tracking of house dust mite-specific T cells in mice. Differentiation and migration of lung allergen-specific TH2 cells requires early expression of the transcriptional repressor Blimp-1. Loss of Blimp-1 during priming in the lymph node ablated the formation of TH2 cells in the lung, indicating early Blimp-1 promotes TH2 cells with migratory capability. IL-2/STAT5 signals and autocrine/paracrine IL-10 from house dust mite-specific T cells were essential for Blimp-1 and subsequent GATA3 upregulation through repression of Bcl6 and Bach2. Spatial microniches of IL-2 in the lymph node supported the earliest Blimp-1+TH2 cells, demonstrating lymph node localization is a driver of TH2 initiation. Our findings identify an early requirement for IL-2-mediated spatial microniches that integrate with allergen-driven IL-10 from responding T cells to drive allergic asthma.


Conflict of interest statement

Competing interests

The authors declare no competing interests.

Figures

Extended Data Fig. 1 |
Extended Data Fig. 1 |. 1DER T cells proliferation kinetics in medLN and lung.
a, naïve 1DERYFP CD4 + T cells were enriched and analyzed for purity before adoptive transfer experiments. b-c, Proportion and kinetics of Ki67 expressionin 1DER T cells from medLN and lung after the HDM administration for 3d (n = 6), 5d (n = 9) and 10d (n = 6). Each point represents one individual sample. Data are shown as means ± SD above and presented two independent experiments (b-c). Kruskal-Wallis oneway ANOVA test (c). *P = 0.0135, **P = 0.0017, ****P < 0.0001.
Extended Data Fig. 2 |
Extended Data Fig. 2 |. Cellular phenotype and source of IL-10 driving Th2 cells in the lung.
a, Representative flow plots (a, left) and percentage (a, right, n = 17 in CRISPRcontrol, n = 14 in CRISPRSTAT3) of Blimp-1 YFP+ cells within Th2 cells in the lung. b-e, flow cytometry analysis of Th2 cells(gated on live TCRβ + CD4+FoxP3-) in the lung (b) isolated from control (IL-10f/fCD11cCre) or IL-10CD11cCre (IL-10f/fCD11cCre+) animals i.n. immunized with HDM. c-d, percent of infiltrating eosinophils (c) and monocytes (d) in the BAL. e, Percent of effector CD4 + T cells expressing Blimp-1 in the lung (gated on live TCRβ + CD4+FoxP3-). Blimp-1f/fCD4Cre+ (Blimp-1 cKO) mice were used as gating control for Blimp-1 detection. b-e, control (IL-10f/fCD11cCre, n = 19), IL-10CD11cCre (IL-10f/fCD11cCre+, n = 18). f-i, flow cytometry analysis of Th2 cells (gated on live TCRβ + CD4+FoxP3-) in the lung (f) isolated from control (IL-10f/fCD19Cre) or IL-10CD19Cre (IL-10f/fCD19Cre+) animals i.n. immunized with HDM. g, percent of infiltrating eosinophils (g) and monocytes (h) in the BAL. i, Percent of effector CD4 + T cells expressing Blimp-1 in the lung (gated on live TCRβ + CD4+FoxP3-). Blimp-1 cKO mice were used as gating control for Blimp-1 detection. For f, i, control (IL-10f/fCD19Cre, n = 16) or IL-10CD19Cre (IL-10f/fCD19Cre+, n = 20). For g-h, control (IL-10f/fCD19Cre, n = 11) or IL-10CD19Cre (IL-10f/fCD19Cre+, n = 13). j, number of infiltrating monocytes in the BAL from control (IL-10f/fCD4Cre, n = 18) or IL-10CD4Cre (IL-10f/fCD4Cre+, n = 15) animals i.n. immunized with HDM. k-l, experimental setup of naïve IL-10CD4Cre-1DERYFP (CD45.1/2+) CD4 + T cells transferred into IL-10 KO (CD45.2+) recipients followed by 5d i.n. HDM immunization. Flow analysis (k) and absolute cell number of Th2 cells (l, left, n = 4) and Blimp-1 YFP+ expression within Th2 cells (l, right, n = 4) isolated from lung after HDM. m, experiment diagram for 50:50 mixes of 1DERYFP T cells for data in Fig. 2 (k-o). Each point represents one individual sample. Data are shown as means ± SD above and presented two independent experiments (l) or three independent experiments (a, b-e, f-i, j). Two-tailed unpaired Mann-Whitney t test (a, l). a: ****P < 0.0001; l (left): p = 0.0286, l (right): p = 0.0286.
Extended Data Fig. 3 |
Extended Data Fig. 3 |. Blimp-1 + 1DER effector T cells migrate from medLN to the lung.
a-c, Histograms of transcription factor RORγt and T-bet from Teff population (live TCRβ + CD4 + CD45.1 + CD45.2+FoxP3- cells) in 1DER T cell isolated from medLN after 3d (n = 8) and 5d (n = 9) HDM. d-e, naïve CD451 + CD45.2 + 1DERYFP T cells were adoptive transferred into CD45.2+ recipients followed by total 3 (doses) immunization. FTY720 was given by i.p. 6 h after the 2nd dose of HDM and was given 6 h before the 3rd dose of HDM (n = 7). DMSO injection was as control group (n = 6). Representative flow cytometry and absolute cell number on YFP+ cells showing Blimp-1 expression from Teff population in the medLN (d) and lung (e). f, 1DER TCR Tg mice were crossed to IL-10 GFP mice (1DERGFP) and naïve 1DERGFP CD4 T cells (CD45.1/2+) were transferred into host (CD45.2+), followed by 3d of HDM immunization (i.n). Representative flow plots of IL-10GFP gated on 1DERGFP T cells and percentage of IL-10-expressing (GFP+) Teff and TFH cells in the medLN. n = 5. g, Sensitization and challenge protocol using HDM. Mouse lung tissue was harvested 3 min after antibody anti-Thy1.2 was injected by i.v. Tissue resident CD4 + T cells were identified by CD44+Thy1.2- (h-i) and Blimp-1 YFP+ cells (j) were identified on d30 from the lung (n = 3 for unimmunized group, n = 2 for HDM group). k-l, Representative flow cytometry of Blimp-1 expression from lung analyzed on d23 after immunization. Gated from TCRβ + CD4+FoxP3- effector cells. l, Frequency of Blimp-1 expression among effector cells. n = 2 in Blimp-1CD4Cre, n = 12 in iBlimp-1Δ/Δ (day-4 ~ 0), n = 7 in iBlimp-1Δ/Δ (day-1 ~ 3), n = 12 in iBlimp-1Δ/Δ(day1 ~ 5), n = 7 in iBlimp-1Δ/Δ(day6 ~ 10), n = 5 in iBlimp-1Δ/Δ(day11 ~ 15), n = 20 in iBlimp-1+/+, n = 9 in Blimp-1+/++vehicle, n = 9 in Blimp-1Δ/Δ +vehicle. Each point represents one individual sample. Data are shown as means ± SD above and presented one independent experiment (j), two independent experiments (b-f) or three independent experiments (l). Two-tailed unpaired Mann-Whitney t test (d-f), Kruskal-Wallis one-way ANOVA test (l). d: **p = 0.0023, e: ***P = 0.006; f: **p = 0.0079; l: *p < 0.036, **p < 0.0079.
Extended Data Fig. 4 |
Extended Data Fig. 4 |. CITE-seq and response with CCR8 deficiency.
a, UMAP visualization to identify labeled CD45.1 + 1DER T cells. b, Pseudotime trajectory analysis of CD4 T clusters. c, Pseudotime trajectory analysis using Slingshot assay. d-g, Naïve 1DERYFP (CD45.1/2+) CD4 + T cells were electroporated with CRISPR sgRNA/Cas9 RNPs targeting CCR8 or scramble control and immediately transferred into WT (CD45.2+) recipients immunized (24 h later) with HDM for 5d. (d, f) flow cytometry plots, absolute number of Th2 cells (e, n = 11) and (g, n = 11) Blimp-1 YFP+ cells within Th2 cells from 1DERYFP T cells in the lung. Data are shown as means ± SD and presented two independent experiments. Two-tailed unpaired Mann-Whitney t test (e, g), p > 0.05.
Extended Data Fig. 5 |
Extended Data Fig. 5 |. Impacts of STAT5a, STAT5b Bcl6 and Bach2 on 1DER Th2 formation and Blimp-1.
a, Representative flow plots of TFH (CXCR5 + PD-1+) T cells showing IL-2Rα and Bcl6 expression cells 3d after HDM in the medLN. b-c, Representative flow plots and percentage of pSTAT5+ (blue dots) in IL-2Rα + (red dots) 1DER T cells after 24 h (n = 4), 48 h (n = 7) and 72 h (n = 7). Naïve CD45.1 + 1DER T cells (gray) were used as gating control. d, schematic model of hypothesis. e-j, naïve 1DERYFP (CD45.1/2+) CD4 + T cells were electroporated with targeting or nontargeting sgRNA/Cas9 RNPs for mouse STAT5a or STAT5b. e-f, Representative flow plots representative flow plots and percent data shows 1DER cells in the medLN (e, g, left) and lung (f, g, right) after STAT5a or STAT5b deficiency on d5. h-j, percent of Treg (h), TH1 (i) and TH17 (j) cells from 1DER T cells in the lung gated on live TCRβ + CD4 + CD45.2 + CD45.1 + . For g-j, n = 11 in CRISPRcontrol, n = 8 in CRISPRSTAT5a, n = 8 in CRISPRSTAT5b. k, Representative flow plots (k, left) and percentage (k, right, n = 13 in CRISPRcontrol, n = 5 in CRISPRBcl6) of IL-2Rα+ cells in the absence of Bcl6 at 72 h in the medLN. l-n, representative flow plots (l, left) and percentage of IL-2Rα+ cells (l, right, n = 10 in CRISPRcontrol, n = 9 in CRISPRBach2) in the absence of Bach2 from Teff isolated from medLN at 72 h. Percentages of GATA3+ (m, left) and Bcl6+ (m, right, n = 10 in CRISPRcontrol, n = 9 in CRISPRBach2) cells from medLN in the absence of Bach2. n, T-Bet + , RORγt + , TFH and Treg of 1DER T cells isolated from medLN 3d after HDM in the absence of Bach2 (n = 8 in CRISPRcontrol, n = 9 in CRISPRBach2). Each point represents one individual sample. Data are shown as means ± SD above and presented two independent experiments (c, g-n). Two-tailed unpaired Mann-Whitney t test (k, l, n), Kruskal-Wallis one-way ANOVA test (c, h). * P < 0.05, ** P < 0.01, *** P < 0.001, ****P < 0.0001. Specific P values are as follows: c: **p = 0.0073; h: ***p = 0.0007; n: *p = 0.0206 for Tbet+, *p = 0.0152 for RORγt+.
Extended Data Fig. 6 |
Extended Data Fig. 6 |. IL-2-STAT5 supports Blimp-1 and GATA3 in nascent Th2 cells by suppressing Bcl6 and Bach2.
Naïve 1DER T cells (CD45.1/2+) were labeled with CTV prior to adoptive transfer into CD45.2+ recipients followed by 3d HDM i.n. immunization. a, Representative RNA flow plots of Prdm1 and Bach2 expression by CTV of 1DER T cells concatenated from 7 samples (n = 7). b, Naïve 1DER T cells were processed for CRISPR knockout targeting STAT5b sgRNA or scramble control sgRNA followed by culture for 72 h in the presence of anti-CD3, anti-CD28, then cells were collected for qPCR assay (n = 4 biological samples). naive 1DER T cells were used as control. c-d, Representative flow plots (c), percentage of Blimp-1 YFP+ (d) and Bcl6+ cells (e) at 72 h in the medLN in the absence of STAT5b and/or Bach2. For d-e, n = 7 in CRISPRcontrol, n = 5 in CRISPRSTAT5b, n = 7 in CRISPRBach2, n = 5 in CRISPRSTAT5b+Bach2. f-h, Representative flow plots (f), percentage of Blimp-1 YFP+ (g) cells at 72 h in the medLN in Bach2-deficient alone (n = 5), STAT5b and Bach2-deficient (n = 4), Bcl6 and Bach2-deficient (n = 7) or with IL-2 blockade (n = 4). h, Naïve 1DER T cells were processed for CRISPR knockout targeting Bach2 or scramble control sgRNAs followed by culture for 72 h in the presence of anti-CD3, anti-CD28, and additional cytokine conditions [IL-2 (100U) or anti-IL2 (20 μg/ml) or IL-10 (20 μg/ml)] as indicated above (h, left), percentage of Blimp-1 YFP+ cells (h, right) cells at 72 h. Data was collected from 3 independent culture experiments. naive 1DER T cells were used as control for gating. i, schematic model summarizing the molecular pathways for Th2 cell initiation to inhaled allergen. Each point represents one individual sample. Data are shown as means ± SD above and presented two independent experiments (d, e, g). Kruskal-Wallis one-way ANOVA test (d, e, g). * P < 0.05, ** P < 0.01, ****P < 0.0001. Specific P values are as follows: d: CRISPRcontrol versus CRISPRBach2 = 0.074, CRISPRSTAT5b versus CRISPRBach2+STAT5b = 0.0379, ****P < 0.0001; e: **p = 0.007; g: CRISPRBach2 versus CRISPRBach2+STAT5b = 0.0138.
Extended Data Fig. 7 |
Extended Data Fig. 7 |. Spatial imaging and transcriptomics identifies factors that underlie Th2 and TFH cell localization.
a-d, The medLN were collected at indicated time points for immunofluorescence staining of B220 (blue), YFP (yellow) and CD45.1 (red). Scale bar, 500 μm. Zoom-in images show separately acquired regions of interest of the T cell zone based on CD4 and B220 staining. (d) Blimp-1-YFP + 1DER CD4 + T cells in T cell zone and B cell zone were quantified after 0d (n = 6), 3d (n = 9), 5d (n = 10) and 10d (n = 8). e-f, The medLN were collected for cross-section and immunofluorescence staining of B220 (blue), YFP (yellow), GATA3 (green) and CD45.1 (red) 3d after HDM immunization (left). Scale bar, 500 μm. Zoom-in images show separately acquired regions of interest of the T-B border. Quantification of the images showing the location of GATA3 + YFP + 1DER cells in T cell center or T-B border within the medLN (f, n = 8). g, genes in significant latent factor Z13 with high weighted expression in Th2 or TFH regions. h-m, Naïve CD45.1/2 + 1DER T cells were adoptive transferred into CD45.2+ recipients followed by HDM immunization for 3d (n = 2) or 5d (n = 2). medLN were collected for Curio Biosciences Slide Seeker protocol (Slide-seq). Serial sections were collected and stained for immunofluorescence of B220 (blue), CD4 (green), CD45.1 (red) and CD11c (magenta) (h, k, left). RCTD deconvolution was performed to assign regions with 7 cell types (i, l). RCTD, robust cell-type decomposition. Isolated regions mapped with Th2 transcriptomes or B cell transcriptomes were visualized by spatial location (j, m). n-o, Pathways analysis of genes identified in standalone latent factors enriched via SLIDE analysis performed on Slide-seq datasets at d3 (n) and d5 (o), the latent factors were identified for d3 (delta=0.085, lambda=1, spec=0.5, FDR = 0.1) and for d5 (delta=0.085, lambda=1, spec=0.1, FDR = 0.1). Each point represents one individual sample. Data are shown as means ± SD above and presented two (f) or three (d) independent experiments. Ordinary two-way ANOVA test (d), two-tailed unpaired Mann-Whitney t test (f). d: 0d versus 3d (T cell area)=0.0001, 0d versus 5d (T cell area)=0.0023; f: * P = 0.0281.
Extended Data Fig. 8 |
Extended Data Fig. 8 |. Spatial imaging identifies IL-2+ microniches that impact Th2 cells.
a-b, Representative images as in (a) and (b) showing CD45.1 co-staining with RNA targets Cd19, Prdm1, Gata3, Il2 and Il2ra. B cell zone and T cell area were annotated by Cd19 and Cd4 RNA regions. c, Zoom-in images show separately acquired regions of interest of the T-B border for data in Fig. 7f. d-h, Naïve CD45.1/2 + 1DER T cells were adoptive transferred into CD45.2 + IL2eGFP reporter recipients followed by HDM immunization for 3d. Distance (μm) of IL-2eGFP+ cells to annotated B cell zone (d, n = 4) and frequency of IL-2eGFP+ cells distribution across medLN (e, n = 4). f, number of IL-2eGFP+ cells from immune cells in the medLN after 2d HDM i.n. immunization by flow cytometry assay (n = 3). naive unimmunized IL-2eGFP mouse were set as control (n = 2). g, Distance of GATA3 + , GATA3 + IL-2Ra + , IL-2Ra + 1DER T cells (CD45.1+) within a 50-μm-radius circle from IL-2GFP+ cells (n = 4). h, abundance of indicated FoxP3+ and GATA3 + CD4 + T cells surrounding IL2GFP+ cells within 50-μm-radius circle (n = 4). Data are shown as means ± SD above and representative of two independent experiments. Kruskal-Wallis one-way ANOVA test (g), Ordinary two-way ANOVA test (h). * P < 0.05, ** P < 0.01, ****P < 0.0001. Specific P values are as follows: g: CD45.1+IL2Ra+GATA3+ versus CD45.1+IL2Ra+=0.0098, CD45.1+GATA3+ versus CD45.1+IL2Ra+<0.0001; h: FoxP3+ (T cell zone) versus FoxP3+ (T-B border)=0.0333, ****P < 0.0001.
Fig. 1 |
Fig. 1 |. Blimp-1 kinetics in allergen-specific CD4+T cells in response to inhaled HDM.
a, Experimental design. b, Flow plots of 1DERYFP T cell percentages in the medLN and lung over time. c,d, Quantitation in medLN (c) and lung (d) of b at 0 h (n = 7), 24 h (n = 4), 48 h (n = 4), 60 h (n = 8), 72 h (n = 12), 5 days (n = 13) and 10 days (n = 10). e, Top: flow plots of Teff and TFH percentages of 1DERYFP T cells in medLN over time. Teff (middle) and TFH (bottom) are gated on or respectively and show percentage of Blimp-1 YFP+ cells. f, The graphs display percentage of Teff and TFH cells over time. g, The percentage of Blimp-1 YFP+ Teff and TFH cells over time. h, Representative flow plots gated on 1DERYFP T cells showing the percentage of Blimp-1 YFP+ cells in the lung over time. i, Graph of Blimp-1 YFP+ cells in the lung over time. j, Top: representative flow plots gated on 1DERYFP T cells of TH1 (T-bet+ss-γ+), TH2 (GATA3+IL-13+), TH17 (RORγt+IL-17A+) and T regulatory cells (Treg, FoxP3+) in lungs after 5 days. Bottom: the percentage of Blimp-1 YFP+ cells within subsets in the lung. For f, j and i: 0 h (n = 7), 24 h (n = 4), 48 h (n = 4), 60 h (n = 8), 72 h (n = 9), 5 days (n = 20) and 10 days (n = 10). k, The graph displays the percentage of subsets gated on 1DERYFP T cells in the lung. l, The percentage of Blimp-1 YFP+ T cells within each subset (n = 14). Each point represents one individual sample. The data are shown as means ± s.d. and present three independent experiments. A Kruskal–Wallis one-way ANOVA test was performed for d, i and l and an ordinary two-way ANOVA test for f and g. *P < 0.05, ***P < 0.001, ****P < 0.0001. The specific P values are as follows for d: 72 h versus 5 days, P = 0.0445; for f: Teff versus TFH (48 h), P < 0.001, Teff versus TFH (60 h), P < 0.001, Teff versus TFH (72 h), P < 0.001, Teff versus TFH (10 days), P = 0.0279; for g: Teff versus TFH (72 h), P < 0.0001, Teff versus TFH (5 days), P < 0.0001, Teff versus TFH (10 days) P = 0.0005; for i: 72 h versus 5 days, P = 0.0401, 72 h versus 10 days, P = 0.0363; and for l: TH2 versus TH1, P = 0.0462, TH2 versus TH17, P < 0.0001. PerCP, peridinin-chlorophyll-protein; APC, allophycocyanin; SSC-A, side scatter area.
Fig. 2 |
Fig. 2 |. Autocrine/paracrine IL-10 from allergen-specific T cells supports Blimp-1 and TH2 cells in the lung.
ac, Flow plots (a) and quantitation of TH2 cells (GATA3+IL-13+) (b) and Blimp-1 YFP in TH2 cells (c) from lung at day 5. n = 10, CRISPRControl; n = 9, CRISPRIL−10Rα. d, Flow plots of TH2 cells from lung of control (IL-10f/fCD4Cre) or IL-10CD4Cre (IL-10f/fCD4Cre+) animals immunized with HDM. e,f, Quantitation of TH2 cells (e) and GATA3+ cells (TCRβ+CD4+FoxP3) (f) from animals in d. n = 16, control; n = 18, IL-10CD4Cre. g, The percent and absolute number of eosinophils in the BAL from animals in d. n = 16, control; n = 18, IL-10CD4Cre. hj, Flow plots (h) and absolute cell number of TH2 cells (i) and Blimp-1 YFP+in TH2 cells (j) from lung after HDM; n = 16, WT host; n = 18, IL-10-KO host. ko, Naive 1DERYFP T cells (CD45.1+ (k, left) or CD45.1/2+, n = 6 (k, right)), 1DERYFP-IL-10Control (n = 8) (l, left) and 1DERYFP-IL-10CD4Cre (n = 8) (l, right), and 1DERYFP-IL-10RαCD4Cre (n = 10) (m, left) and 1DERYFP-IL-10CD4Cre (n = 10) (m, right) with congenic marker (CD45.1+ or CD45.1/2+) were mixed 50:50 and transferred to IL-10-KO host (CD45.2+), followed by immunization with HDM for 5 days depicting flow plots, number of TH2 cells (n) and Blimp-1 YFP+ cells in TH2 cells (o) from 1DERYFP T cells in the lung. Each point represents one individual sample. The data are shown as means ± s.d. and present three independent experiments. A two-tailed unpaired Mann–Whitney U test was performed for b, c, f and g, and a multiple paired test with correction for multiple comparison using the Holm–Šidák method was performed for n and o. *P < 0.05, ***P < 0.001, ****P < 0.0001. The specific P values are as follows for b: P = 0.0172; for c: P = 0.0004; for e: P = 0.0180; for f: P = 0.0002; for g: P < 0.0001; for n: P = 0.0285; and for o: P = 0.0386. SSC-A, side scatter area.
Fig. 3 |
Fig. 3 |. TH2 initiation occurs early in the medLN.
a, Flow plots of GATA3 by CTV in 1DER T cells concentrated from four samples. b,c, Flow plots (b) and quantitation (c) of cells expressing GATA3 and Bcl6 gated on Teff or TFH 1DER T cells from medLN after 3 days of HDM (n = 12). d,e, Histograms (d) and quantitation (e) of GATA3 from the Teff population in 1DER T cell from medLN after 3 days (n = 8) and 5 days (n = 9) after HDM. f,g, Histograms (f) and quantitation (g) of Bcl6 in Teff and TFH in 1DER T cells in the medLN 3 days (n = 8) and 5 days (n = 9) after HDM. h,i, 1DERYFP-IL-10RαControl (n = 12) and 1DERYFP-IL-10RαCD4Cre (n = 9) with congenic marker (CD45.1/2+) were transferred into hosts (CD45.2+), followed by immunization with HDM for 3 days depicted by flow plots (h) and GATA3 expression of 1DER T cells (i) in the medLN. Each point represents one individual sample. The data are shown as means ± s.d. and present three independent experiments (c, h and i) and two independent experiments (e and g). An ordinary two-way ANOVA test was performed for c and g, and a two-tailed unpaired Mann–Whitney U test was performed for e and h. ***P < 0.001, ****P < 0.0001. The specific P values are as follows for c: GATA3hiBcl6lo (Teff versus TFH), P = 0.0007, Bcl6hiGATA3lo (Teff versus TFH), P < 0.0001; for e: ****P < 0.0001; for g: Teff versus TFH (3 days or 5 days), P < 0.001, 3 days versus 5 days (TFH), P = 0.0001; for h: P < 0.0001; and for i: P = 0.0009.
Fig. 4 |
Fig. 4 |. Early expression of Blimp-1 is required for TH2 cells in the lung.
a, The experimental design for inducible deletion of Blimp-1. b, Flow plots of TH2 cells (GATA3+IL-13+) from lung on day 23 after HDM immunization. The colors match tamoxifen administration timeline shown in a. c, Quantitation of TH2 cells (TCRβ+CD4+FoxP3) in the lung (day 23). d, Quantitation of eosinophils in the BAL (day 23). e,f, Quantitation of effector T cells expressing GATA3 (e) and Bcl6 (f) in the lung (day 23). Blimp-1CD4Cre, n = 2 for c and d, n = 4 for e and f; iBlimp-1Δ/Δ (day −4 to 0), n = 12; iBlimp-1Δ/Δ (day −1 to 3), n = 7; iBlimp-1Δ/Δ (day 1 to 5), n = 12; iBlimp-1Δ/Δ (day 6 to 10), n = 11; iBlimp-1Δ/Δ (day 11 to 15), n = 10; iBlimp-1+/+, n = 30; Blimp-1+/+ + vehicle, n = 15; Blimp-1Δ/Δ + vehicle, n = 9. Each point represents one individual sample. The data are shown as means ± s.d. above and present three independent experiments (lo). A Kruskal–Wallis one-way ANOVA test was performed for cf. *P < 0.05, **P < 0.01, ***P < 0.001, ****P < 0.0001. The specific P values are as follows for c: Blimp-1CD4Cre versus iBlimp-1Δ/Δ (day 11 to 15), P = 0.0033, Blimp-1CD4Cre versus iBlimp-1+/+, P = 0.0003, Blimp-1CD4Cre versus Blimp-1+/+ + vehicle, P = 0.0089, iBlimp-1Δ/Δ (day −4 to 0) versus iBlimp-1+/+, P = 0.0038, iBlimp-1Δ/Δ (day −1 to 3) versus iBlimp-1+/+, P = 0.0041; for d: iBlimp-1Δ/Δ (day −4 to 0) versus iBlimp-1+/+, P = 0.0105, iBlimp-1Δ/Δ (day −4 to 0) versus iBlimp-1+/+, P = 0.0105, iBlimp-1Δ/Δ (day −4 to 0) versus Blimp-1+/+ + vehicle, P < 0.0001, Blimp-1CD4Cre versus iBlimp-1Δ/Δ (day 11 to 15), P = 0.0105; for e: Blimp-1CD4Cre versus iBlimp-1Δ/Δ (day 11 to 15), P = 0.0099, Blimp-1CD4Cre versus iBlimp-1+/+, P = 0.0021, Blimp-1CD4Cre versus iBlimp-1+/+ + vehicle, P = 0.0150, iBlimp-1Δ/Δ (day −4 to 0) versus iBlimp-1+/+, P = 0.0040; for f: Blimp-1CD4Cre versus iBlimp-1+/+, P = 0.0001, Blimp-1CD4Cre versus iBlimp-1+/+ + vehicle, P = 0.0088, iBlimp-1Δ/Δ (day −4 to 0) versus iBlimp-1+/+, P < 0.0001, iBlimp-1Δ/Δ (day −4 to 0) versus iBlimp-1+/+ + vehicle, P = 0.0003, iBlimp-1Δ/Δ (day −1 to 3) versus iBlimp-1+/+, P = 0.0102.
Fig. 5 |
Fig. 5 |. Single-cell transcriptomics identifies distinct subpopulations of TFH and TH2 cells.
a, A UMAP visualization of CD4+T cells. Naive 1DER T cells (CD45.1/2+) were adoptively transferred into CD45.2+ recipient followed by 3 days of HDM immunization. medLNs (n = 2 biological samples) were processed and labeled with barcoded anti-CD45.1 antibody followed by scRNA-seq with CITE-seq, respectively. Clusters are labeled 0–11. b, A UMAP visualization of indicated transcriptomes mapped to the clusters in a. c, The expression level (violin plots) of signature genes across 12 clusters identified in a. d, RNA velocity granular stream analysis of CD4+T cell clusters. eh, Flow plots of CCR4 deletion (e) and CCR8 deletion (g) and quantitation of TH2 cells and Blimp-1 YFP+in TH2 cells after CCR4 deletion (f) and CCR8 deletion (h) from 1DERYFP T cells in the lung (n = 11 in CRISPRControl, n = 12 in CRISPRCCR4). Each point represents one individual sample. The data are shown as means ± s.d. and present two independent experiments. A two-tailed unpaired Mann–Whitney U test was performed. f (left): CRISPRControl versus CRISPRCCR4 = 0.0091, f (right) = 0.007; h: CRISPRControl versus CRISPRCCR4 = 0.0112. SSC-A, side scatter area.
Fig. 6 |
Fig. 6 |. IL-2/STAT5 supports Blimp-1 and GATA3 in nascent TH2 cells indirectly via repression of Bcl6 and Bach2.
a, Flow plots of IL-2Rα expression concatenated from four samples. b, Flow plots 3 days after HDM in the medLN. c,d, pSTAT5 (pY694) and pSTAT6 (pY641) after 24 (n = 4), 48 (n = 7) and 72 h (n = 7); histograms (c) and quantitation of pSTAT5+ and pSTAT6+ are at different time points (d). e, Integrative Genomics Viewer genome browser tracks of STAT5 binding to selected genes from IL-2 treated mouse CD4+T cells activated in vitro for 48 h (GEO: GSE77656). f,g, Histogram (left) (n = 8 CRISPRControl, n = 9 CRISPRSTAT5a, n = 8 CRISPRSTAT5b) and percentage (right) (n = 13 CRISPRControl, n = 13 CRISPRSTAT5a, n = 14 CRISPRSTAT5b) of Bcl6+ (f) and GATA3+ (g) cells at 48 h from medLN. h, Histograms (left) and percentage (right) of GATA3+ cells at 72 h. n = 14 CRISPRControl, n = 8 CRISPRSTAT5a, n = 10 CRISPRSTAT5b, n = 7 CRISPRBcl6. i, Flow plots (left) and percentage of Blimp-1 YFP+ cells (right) at 72 h. n = 9 CRISPRControl, n = 8 CRISPRSTAT5a, n = 7 CRISPRSTAT5b. j, Flow plots (left) and percentage (right) of Blimp-1 YFP+ cells in the medLN at 72 h. n = 12 CRISPRControl, n = 6 CRISPRBcl6. k, Flow plots (left) and percentage (right) of Blimp-1 YFP+ cells in the medLN at 72 h. n = 10 CRISPRControl, n = 9 CRISPRBach2. l,m, Flow plots (left) and percentages of GATA3+Blimp-1 YFP+, GATA3+Blimp-1 YFP T cells 72 h after HDM (l) (right, n = 10 CRISPRControl, n = 9 CRISPRBach2), GATA3+IL-2Rα+ or GATA3+IL-2Rα (m) (right, n = 10 CRISPRControl, n = 9 CRISPRBach2). Each point represents one individual sample. The data are shown as means ± s.d. and present two (d and km) or three (f and gj) independent experiments. A Kruskal–Wallis one-way ANOVA test for d and fi and a two-tailed unpaired Mann–Whitney U test for jm were performed. *P < 0.05, **P < 0.01, ***P < 0.001, ****P < 0.0001. The specific P values are as follows for d (left): 48 h versus 72 h, P = 0.0320; for d (right): P = 0.0041; for f: *P = 0.0375, ***P = 0.0003; for g: **P = 0.0015, ****P < 0.0001; for h: CRISPRControl versus CRISPRSTAT5b, P = 0.0210, CRISPRControl versus CRISPRBcl6 = 0.0425, CRISPRBcl6 versus CRISPRSTAT5b = 0.0128; for i: P = 0.0002; for l: *P = 0.0172; for m: *P = 0.0294, **P = 0.0021.
Fig. 7 |
Fig. 7 |. Spatial imaging and transcriptomics identify TH2 cells localized to T–B border.
a,b, Left: immunofluorescence staining sections: B220 (blue), CD4+(green), CD45.1 (red) and CD11c (magenta). Right: the spatial heat maps show regions with TFH, TH2 and B cells transcriptomes identified using cell2location. The scale indicates the percentage of region with corresponding transcriptomes. Naive CD45.1/2+1DERYFP T cells were adoptive transferred into CD45.2+ recipients, followed by HDM immunization for 3 days (n = 2) or 5 days (n = 2). Fresh-frozen medLNs were collectecd for cross-section, and a 10x Genomics Visium Spatial Gene expression assay was perfomed. c, medLNs were collected for immunofluorescence staining of B220 (blue), YFP (yellow), GATA3 (green), CD45.1 (red) and Bcl6 (white) 3 days after HDM immunization. Arrows: white, Bcl6+1DER TFH; red, GATA3+1DER TH2; green, Blimp-1 YFP+ 1DER T cell. Scale bar, 50 μm. The representative images show acquired regions of interest at the T–B border. d, The quantification of images from c n = 7 medLNs shows the distance of GATA3+, GATA3+YFP+ and Bcl6+1DER cells to the annotated T–B border. The representative images are from medLNs (n = 7) with two independent experiments. The data are represented as mean ± s.d., and a Kruskal–Wallis one-way ANOVA test was performed; ****P < 0.0001. e,f, Significant interacting latent factors identified by SLIDE of day 3 (e) and day 5 (f) samples on 10x Visium datasets. The blue boxes denote significant standalone latent factors, and the red boxes denote significant interacting latent factors. The color of the gene corresponds to the cell type.
Fig. 8 |
Fig. 8 |. Spatial activation microniches of IL-2 support Blimp-1 in nascent TH2 cells.
a, RNAScope targeting mouse Cd19, Prdm1, Gata3, Il2 and Il2ra in medLN 3 days after HDM. Left: representative image (scale bar, 100 μm) of Il2+ spots. The T and B cell zones are determined by Cd19 and Cd4 (not shown). b,c, Distance (in micrometers) (b) and frequency distribution (c) of Il2+ spots to the annotated B cell zone (b, n = 3; c, n = 3). d, Representative image showing RNA+ spots (Gata3, Prdm1 and Il2ra) within a 50 μm radius (scale bar, 20 μm) from a single Il2+ cell. The magenta circles show Il2+spots, the red circles show Il2ra+Prdm1+ and Il2ra+ Prdm1+ Gata3+ spots, the cyan circles show Gata3+ alone spots and the yellow circles show Il2ra+ alone spots. All RNA spots were verified by Cd4 and DAPI staining. e, Abundance of indicated cells surrounding an Il2+ spot within 50-μm-radius circle, n = 3. f, Representative image of day 3 medLN multiplexed immunofluorescence staining. B220 (blue), IL-2-GFP (green), GATA3 (white), FoxP3 (purple), IL-2Rα (cyan) and CD45.1 (red) 3 days after HDM immunization. Scale bar, 500 μm. g, Zoom-in images showing separately acquired regions of interest of the T–B border. h, Naive 1DERYFP (CD45.1/2+) CD4+ T cells electroporated with CRISPR sgRNA–Cas9 ribonucleoprotein particles targeting IL-2Rα or scramble control and transferred into 2BiT-Thy1.1 reporter (CD45.2+) recipients immunized with HDM for 3 days. The representative images of medLN show Blimp-1 YFP+IL-2Rα+ cells (cyan circle), GATA3+ cells (white circle) surrounding IL-2 Thy1+ cells (stained by AF647 anti-mouse Thy1.1 antibody, circled by purple) within 50-μm-radius circle in control 1DERYFP T cells (top) and 1DERYFP T cells in the absence of IL-2Rα (bottom). i, Quantification of GATA3+1DER T cells within a 50 μm radius of IL-2+ cells, n = 3. The data are shown as means ± s.d. and are representative of two independent experiments. A two-tailed unpaired Mann–Whitney U test was performed for i, and a Kruskal–Wallis one-way ANOVA test was performed for e. *P = 0.0246, ****P < 0.0001.

References

    1. McDaniel MM, Lara HI & von Moltke J. Initiation of type 2 immunity at barrier surfaces. Mucosal Immunol. 16, 86–97 (2023). - PMC - PubMed
    1. Hammad H. & Lambrecht BN The basic immunology of asthma. Cell 184, 1469–1485 (2021). - PubMed
    1. Hammad H, Debeuf N, Aegerter H, Brown AS & Lambrecht BN Emerging paradigms in type 2 immunity. Annu. Rev. Immunol. 40, 443–467 (2022). - PubMed
    1. Paul WE & Zhu J. How are TH2-type immune responses initiated and amplified? Nat. Rev. Immunol. 10, 225–235 (2010). - PMC - PubMed
    1. Rahimi RA & Sokol CL Functional recognition theory and type 2 immunity: insights and uncertainties. Immunohorizons 6, 569–580 (2022). - PMC - PubMed

MeSH terms

LinkOut - more resources