. 2024 Oct 12;150(10):456.
doi: 10.1007/s00432-024-05938-5.

SCYL1-mediated regulation of the mTORC1 signaling pathway inhibits autophagy and promotes gastric cancer metastasis

Affiliations

SCYL1-mediated regulation of the mTORC1 signaling pathway inhibits autophagy and promotes gastric cancer metastasis

Zihao Zhao et al. J Cancer Res Clin Oncol. .

Abstract

Background: The SCY1-like (SCYL) family has been reported to be closely related to cancer metastasis, but it has not been reported in gastric cancer (GC), and its specific mechanism is not clear.

Methods: We utilized databases like Deepmap, TCGA, and GEO to identify SCYL1's role in GC. Clinical samples were analyzed for SCYL1 expression and its correlation with patient prognosis. In vitro and in vivo experiments were conducted to assess SCYL1's function in GC cell migration, invasion, and autophagy.

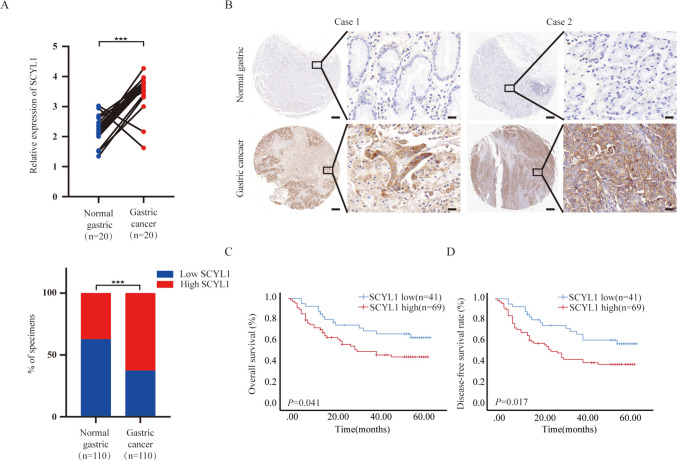
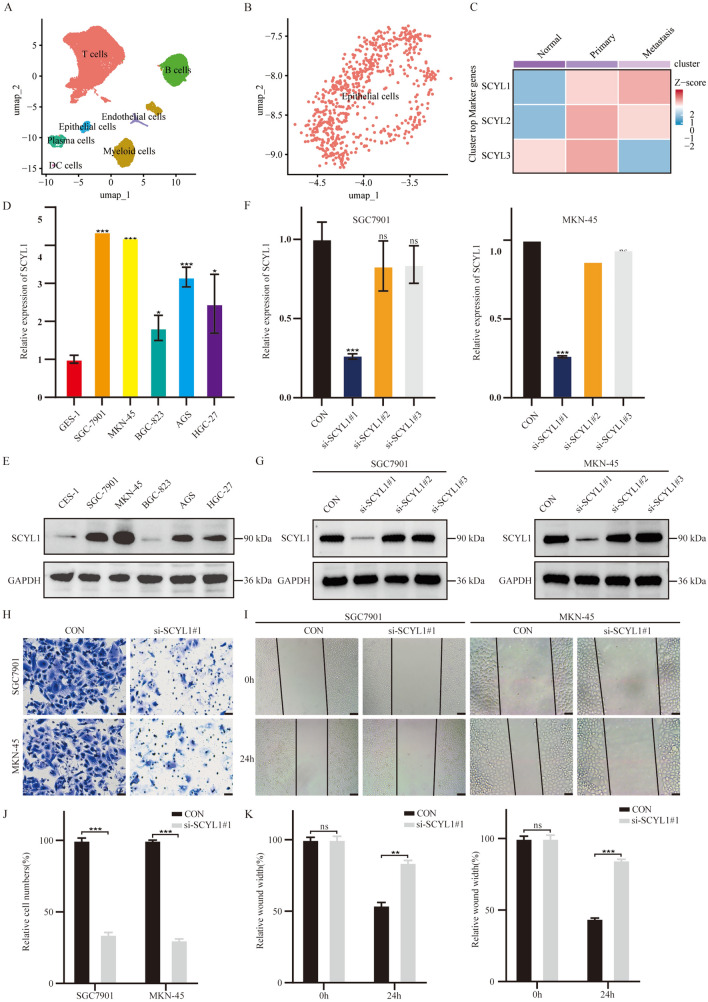
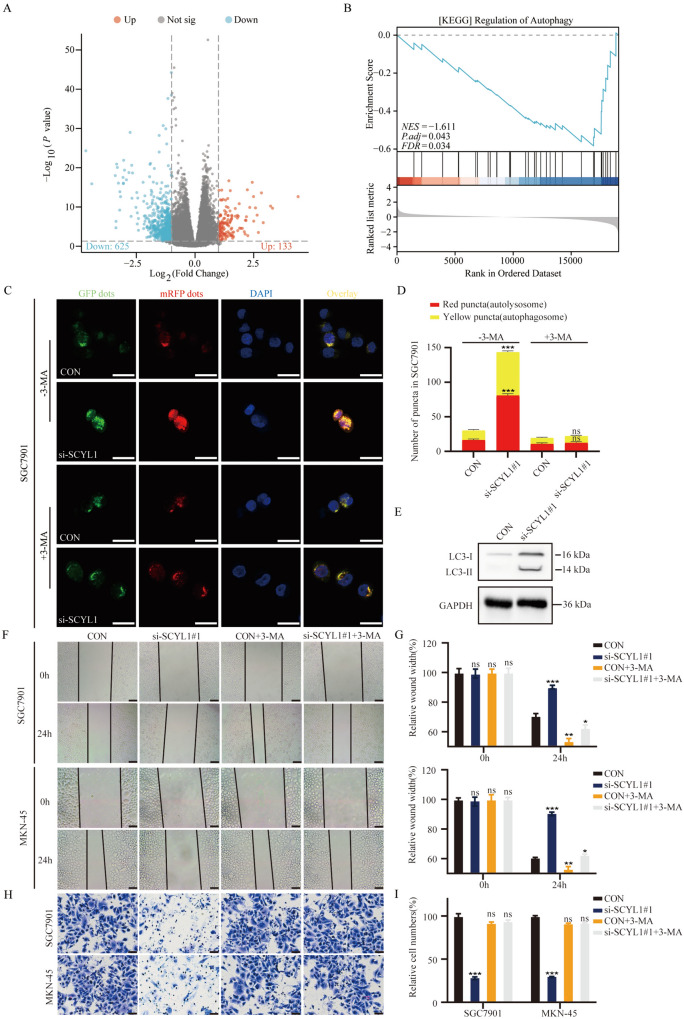
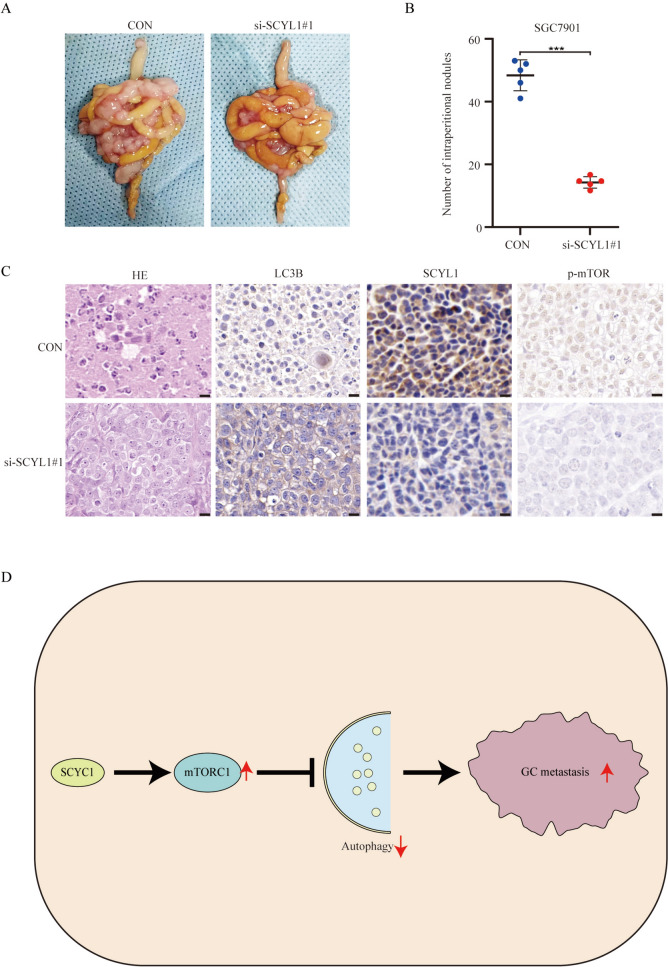
Results: SCYL1 showed an increased expression in GC tissues, which correlated with a negative prognosis. In vitro experiments demonstrated that SCYL1 promotes GC cell migration and invasion and inhibits autophagy. GSEA indicated an inverse relationship between SCYL1 and autophagy, while a direct relationship was observed with the mTORC1 signaling pathway. Knockdown of SCYL1 enhanced autophagy, while activation of mTORC1 reversed this effect.

Conclusions: SCYL1 is a significant contributor to GC progression, promoting metastasis by activating the mTORC1 signaling pathway and inhibiting autophagy. These findings suggest SCYL1 as a potential therapeutic target for GC treatment.

Keywords: Autophagy; Gastric cancer; Metastasis; SCYL1; mTORC1.


Conflict of interest statement

The authors declare that the research was conducted in the absence of any commercial or financial relationships that could be construed as a potential conflict of interest.

Figures

Fig. 1
Fig. 1
SCYL1 is predicted to be upregulated in GC tissues and associated with poor prognosis based on online databases. (a) Genome-wide CRISPR-Cas9 essentiality screening of SCYL family members in 20 gastric adenocarcinoma cell lines, yielding CERES scores. Original data were downloaded from DepMap. According to CERES scores, lower scores indicate higher cancer dependency on specific genes. (b, c) Expression of SCYL family members in paired GC tissues, data sourced from TCGA and GEO databases. Red indicates higher expression in GC, green indicates lower expression, and grey represents no significant difference. (d) Expression levels of SCYL1 in GC and normal tissues in all TCGA-STAD samples. (e) Relationship between SCYL1 expression levels and overall survival rates of GC patients in the Kaplan–Meier Plotter database. (f) In the TCGA database, the correlation of SCYL1 with OS (Overall Survival), DFI (Disease-Free Interval), PFI (Platinum-Free Interval) and DSS (Disease-Specific Survival)
Fig. 2
Fig. 2
SCYL1 is significantly upregulated in clinical GC samples and is associated with poor prognosis. (a) qRT-PCR analysis of SCYL1 expression levels in 20 pairs of fresh GC tissue samples. (b) Typical tissue microarray image analysis of SCYL1 expression in 110 patients. Scale bar, 50 μm. (c) Quantification of SCYL1 expression by immunohistochemistry analysis. (d) OS (P = 0.041) and DFS (P = 0.017) of GC patients related to SCYL1 expression by Kaplan–Meier survival curve analysis
Fig. 3
Fig. 3
In vitro experiments show that SCYL1 promotes the migration and invasion of GC cells. (a) The single-cell annotation plot for the GSE163558 chip. (b) Epithelial cells in the GSE163558 chip. (c) Expression of SCYLs in normal gastric tissue, primary GC tissue, and metastatic GC tissue. (d, e) qRT-PCR and WB analysis of SCYL1 mRNA expression levels in various GC cell lines and normal gastric mucosal epithelial cells. (f, g) qRT-PCR and WB analysis of siRNA knockdown efficiency of SCYL1 in GC cells. (h, i) Transwell and wound healing assays to assess the impact of si-SCYL1 on the migratory ability of GC cells SGC7901. (j, k) Quantification of transwell (j) and wound healing assays (k). Scale bar, 50 μm. (ns, P > 0.05; **P < 0.01; ***P < 0.001)
Fig. 4
Fig. 4
SCYL1 inhibits autophagy in GC cells, promoting their migration and invasion. (a) Volcano plot based on high and low expression genes of SCYL1 in TCGA. (b) GSEA enrichment analysis sorted by log2FC values from high to low, based on the TCGA database. Gene set: “c2.cp.all.v2022.1.Hs.symbols.gmt”. (c) Detection of autophagic flux using GFPmRFP-LC3 lentivirus in CON or si-SCYL1 SGC7901 groups. Scale bar, 20 μm. (d) Quantification of LC3 dots (red and yellow representing autophagosomes or autolysosomes, respectively) in CON or si-SCYL1 SGC7901 groups. (e) Western blot analysis of autophagy-related markers: LC3 and P62 protein levels, with GAPDH as an internal reference. (fi) Transwell and wound healing assays to assess the effect of autophagy inhibitor 3-MA on restoring the migratory ability of GC cells treated with si-SCYL1. Scale bar, 50 μm. (ns, P > 0.05; *P < 0.05; **P < 0.01; ***P < 0.001)
Fig. 5
Fig. 5
SCYL1 inhibits autophagy in GC cells by activating the mTORC1 signaling pathway. (a) Gene Set Enrichment Analysis (GSEA) based on the TCGA database, sorted by log2FC values from high to low. The gene set used is “h.all.v7.5.1.symbols.gmt”. (b) WB analysis to detect the levels of proteins related to the mTORC1 pathway. (c) WB analysis of the impact of si-SCYL#1 and the mTOR Agonist MHY1485 on autophagy levels in SGC-7901. (d) Detection of autophagic flux using the GFPmRFP-LC3 lentivirus in CON, si-SCYL1, and si-SCYL1 + MHY14845 SGC7901 groups. Scale bar, 20 μm. E. Quantification of LC3 in CON, si-SCYL1, and siSCYL1 + MHY14845 SGC7901 groups (red and yellow represent autophagosomes or autolysosomes, respectively). (ns, P > 0.05; ***P < 0.001)
Fig. 6
Fig. 6
SCYL1 promotes the migration of GC in vivo. (a, b) Representative images and numbers of intraperitoneal metastatic nodules in nude mice injected with recombinant GC cells and control cells. (c) HE and IHC staining intensity for SCYL1, LC3B, and p-mTOR in different groups. Scale bar, 10 μm. (d) Summary of the findings: SCYL1 promotes GC migration by activating the mTORC1 signaling pathway and inhibiting autophagy in GC cells

Similar articles

References

    1. Aslan C, Maralbashi S, Salari F, Kahroba H, Sigaroodi F, Kazemi T et al (2019) Tumor-derived exosomes: Implication in angiogenesis and antiangiogenesis cancer therapy. J Cell Physiol 234(10):16885–16903 - PubMed
    1. Chen Y, Wang B, Zhao Z, Li M, Wang F (2022) PRSS2 overexpression relates to poor prognosis and promotes proliferation, migration and invasion in gastric cancer. Tissue Cell 79:101949 - PubMed
    1. Chen K, Yu B, Liao J (2021) LncRNA SOX2OT alleviates mesangial cell proliferation and fibrosis in diabetic nephropathy via Akt/mTOR-mediated autophagy. Mol Med 27(1):71. - PMC - PubMed
    1. Debnath J, Gammoh N, Ryan KM (2023) Autophagy and autophagy-related pathways in cancer. Nat Rev Mol Cell Biol 24(8):560–575 - PMC - PubMed
    1. Hao Y, Hao S, Andersen-Nissen E, Mauck WM, 3rd, Zheng S, Butler A, et al. (2021) Integrated analysis of multimodal single-cell data. Cell 184(13):3573–3587 e29. - PMC - PubMed

Substances

LinkOut - more resources