. 2024 Oct 11;22(1):925.
doi: 10.1186/s12967-024-05710-w.

Immunometabolic changes and potential biomarkers in CFS peripheral immune cells revealed by single-cell RNA sequencing

Affiliations

Immunometabolic changes and potential biomarkers in CFS peripheral immune cells revealed by single-cell RNA sequencing

Yujing Sun et al. J Transl Med. .

Abstract

The pathogenesis of Myalgic encephalomyelitis/chronic fatigue syndrome (ME/CFS) remains unclear, though increasing evidence suggests inflammatory processes play key roles. In this study, single-cell RNA sequencing (scRNA-seq) of peripheral blood mononuclear cells (PBMCs) was used to decipher the immunometabolic profile in 4 ME/CFS patients and 4 heathy controls. We analyzed changes in the composition of major PBMC subpopulations and observed an increased frequency of total T cells and a significant reduction in NKs, monocytes, cDCs and pDCs. Further investigation revealed even more complex changes in the proportions of cell subpopulations within each subpopulation. Gene expression patterns revealed upregulated transcription factors related to immune regulation, as well as genes associated with viral infections and neurodegenerative diseases.CD4+ and CD8+ T cells in ME/CFS patients show different differentiation states and altered trajectories, indicating a possible suppression of differentiation. Memory B cells in ME/CFS patients are found early in the pseudotime, indicating a unique subtype specific to ME/CFS, with increased differentiation to plasma cells suggesting B cell overactivity. NK cells in ME/CFS patients exhibit reduced cytotoxicity and impaired responses, with reduced expression of perforin and CD107a upon stimulation. Pseudotime analysis showed abnormal development of adaptive immune cells and an enhanced cell-cell communication network converging on monocytes in particular. Our analysis also identified the estrogen-related receptor alpha (ESRRA)-APP-CD74 signaling pathway as a potential biomarker for ME/CFS in peripheral blood. In addition, data from the GSE214284 database confirmed higher ESRRA expression in the monocyte cell types of male ME/CFS patients. These results suggest a link between immune and neurological symptoms. The results support a disease model of immune dysfunction ranging from autoimmunity to immunodeficiency and point to amyloidotic neurodegenerative signaling pathways in the pathogenesis of ME/CFS. While the study provides important insights, limitations include the modest sample size and the evaluation of peripheral blood only. These findings highlight potential targets for diagnostic biomarkers and therapeutic interventions. Further research is needed to validate these biomarkers and explore their clinical applications in managing ME/CFS.

Keywords: Biomarkers; Immune dysregulation; Immunometabolism; Myalgic encephalomyelitis/Chronic fatigue syndrome (ME/CFS); Peripheral blood mononuclear cells (PBMCs); Single-cell RNA sequencing (scRNA-seq).


Conflict of interest statement

The authors declare that there are no conflicts of interest.

Figures

Fig. 1
Fig. 1
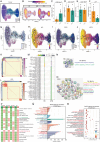
Single-cell transcriptomes of PBMCs from ME/CFS Patients. A. Schematic of single-cell transcriptome profiling of PBMCs from Myalgic encephalomyelitis/chronic fatigue syndrome (ME/CFS) patients (CFS) and healthy controls (HC). The flowchart outlines the process as follows: single-cell RNA sequencing (ScRNAseq) is performed to identify molecular pathways. This data is then subjected to internal verification and supplemented with external data verification to ensure robustness and accuracy of the findings. B. Heatmap displaying the top 10 marker gene expressions in PBMC cell subpopulations. C. Uniform Manifold Approximation and Projection (UMAP) projections of 45,633 PBMCs from the HC group (4 samples, 28,180 cells) and ME/CFS group (4 samples, 17,453 cells), depicting single-cell transcriptomes from ME/CFS and HC groups. D. Cell density plots comparing ME/CFS group and HC group segregated by ancestry. E-I. Proportion of cell types in each individual, encompassing T cells (E, p = 0.0045), NK cells (F, p = 0.0044), Monocyte cells (G, p = 0.047), B cells (H, p = 0.5), cDCs (I, p = 0.029), and pDCs cells (J, p = 0.035). Group information is represented by colors. ns, not significant; *p < 0.05, **p < 0.01; ME/CFS group compared with HC group
Fig. 2
Fig. 2
Cluster analysis of phenotypic and functional differences between CD4+T cell subsets. A. UMAP plot illustrating the distribution of CD4+T cell subsets, with each color representing a distinct cell subset. B. Density plots of CD4+ T cell subsets for ME/CFS and HC groups, segregated by ancestry. C-F. Cell numbers of CD4+ T cell types in each individual, including CD4+ Naive (C, p = 0.032), CD4+ TCM (D, p = 0.21), CD4+ TEM (E, p = 0.047), and CD4+ CTL cells (F, p = 0.99). Colors denote cell type information. ns, no significant. *p < 0.05. ME/CFS group compared to HC group. G-J. Monocle3-based pseudotemporal analysis of CD4+ T cell subsets. Cells are color-coded by CD4+ T cell subsets and the pseudotime trajectory in HC group (G-H) or ME/CFS groups (I-J). K-L. Regulon modules based on the correlation matrix of shared regulons of HC(K) and ME/CFS(L) of CD4+ T cells. The network shows 515 orthologous transcription factor regulons grouped into 5 major modules (red boxes) with representative transcription factor (TF) regulons. M. Bubble diagram show the top 10 enriched regulons for the CD4+ T cells. N-O. STRING plot depicting confidence of gene-gene interactions among phase-specific regulons of HC(N) and ME/CFS(O) based on the STRING database and gene ontology (GO) terms highlighted. P. Heatmap of up and down regulated genes from the HC group enriched in GO Biological Process (BP) terms in CD4+ Naive, CD4+ TCM, CD4+ TEM, and CD4+CTL cells. *p < 0.05, **p < 0.01, ***p < 0.001. note: p means the significance of all paths in the GO Biological Process (BP) pathway. Q. Heatmap of up and down regulated genes from the ME/CFS group enriched in KEGG pathway in CD4+Naive, CD4+ TCM, CD4+ TEM, and CD4+ CTL cells. *p < 0.05, **p < 0.01, ***p < 0.001. note: p means the significance of all paths in the KEGG pathway
Fig. 3
Fig. 3
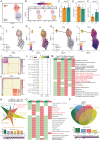
Cluster analysis of variations in cellular proportion and functional differences among CD8+T cell subsets. A. UMAP plot displaying the distribution of CD8+ T cell subsets, with each color indicating a specific cell subset. B. Density plots depicting CD8+ T cell subset distributions for ME/CFS and HC groups, categorized by ancestry. C-F. Proportion of cell types in each individual, including CD8+ Naïve (C, p = 0.039), CD8+ TCM (D, p = 0.42), CD8+ TEM (E, p = 0.95), and γδT cells (F, p = 0.042). Colors signify cell type information. ns, no significant. ME/CFS group compared to the HC group. H-I. Pseudotime analysis revealing distinct trajectories of CD8+T cell subset differentiation in ME/CFS. Cells are color-coded based on CD8+T cell subsets, along with pseudotime trajectories for HC group (G-H) or ME/CFS group (I-J). L-L. Regulon modules based on the correlation matrix of shared regulons of HC(K) and ME/CFS(L). The network shows 499 orthologous transcription factor regulons grouped into 4 major modules (red boxes) with representative transcription factor (TF) regulons. M. Bubble diagram show the top 10 enriched regulons for the CD8+ T cells. N-O. STRING plot depicting confidence of gene-gene interactions among phase-specific regulons of HC(N) and ME/CFS(O) based on the STRING database and GO terms highlighted. P. Heatmap displaying upregulated genes enriched in Gene Ontology Biological Processes (GO BP) terms for CD8+ Naive, CD8+ TCM, CD8+ TEM, and γδT cells in the ME/CFS group. *p < 0.05, **p < 0.01, ***p < 0.001, p means the significance of all paths in the GO Biological Process (BP) pathway. Q. Vertical axis depicting CD8+ naive upregulated genes of the ME/CFS group enriched in annotated KEGG pathways, with the graph indicating the number of metabolites annotated within each secondary classification under the primary pathway classification. R. Bubble chart analysis of upregulated genes enriched in GO BP terms for CD8+ Naive cells in the ME/CFS group
Fig. 4
Fig. 4
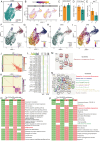
Cluster analysis of the phenotypic and functional differences between B cell subsets. A. UMAP plot depicting the distribution of B cell subsets, with each color representing a distinct cell subset. B. Density plots of B cell subsets for ME/CFS and HC groups, segregated by ancestry. C-E. Proportion of cell types in each individual, including naive B cells (C, p = 0.81), memory B cells (D, p = 0.38), and plasma cells (E, p = 0.25). The different colors indicate cell type information.“ns” indicates no significant difference. The ME/CFS group compared to HC group. F-I. Pseudotime analysis revealing distinct trajectories of B cell subset differentiation in the ME/CFS group. Cells are color-coded by B cell subset and pseudotime trajectory in the HC group (F-G) or ME/CFS group (H-I). J-K. Regulon modules based on the correlation matrix of shared regulons of HC(J) and ME/CFS(K) of NK cells. The network shows 500 orthologous transcription factor regulons grouped into 5 major modules (red boxes) with representative transcription factor (TF) regulons. L. Bubble diagram show the top 10 enriched regulons for the B cells. M. Heatmap of up-regulated and down regulated genes in the ME/CFS group, enriched in GO BP terms in naive B cells, memory B cells, and plasma cells. *p < 0.05,**p < 0.01,***p < 0.001. note: p mean the significance of all paths in the GO BP pathway. N. Venn diagram of the intersection genes of the Figure M red marked signaling pathway. O. Heatmap of up-regulated and down regulated genes in the ME/CFS group, enriched in KEGG terms in naive B cells, memory B cells, and plasma cells. *p < 0.05,**p < 0.01,***p < 0.001. note: p mean the significance of all paths in the KEGG pathway. P. Venn diagram of the intersection genes of the Figure O red marked signaling pathway
Fig. 5
Fig. 5
Analysis of phenotypic and functional differences among NK cell subsets. A. UMAP plot displaying the distribution of NK cell subsets, with each color denoting a distinct cell subset. B. Density plots illustrating NK cell subsets in the ME/CFS and HC groups, differentiated by ancestry. C-E. Proportion of cell types in each individual, encompassing NK (C, p = 0.16), NK-CD56bright (D, p = 0.28) and NKT (E, p = 0.031) cells. Colors indicate cell type information. *p < 0.05, ns, no significant. D-I. Pseudotime analysis unveiling distinctive trajectories of NK cell subset differentiation in the ME/CFS context. Cells are color-coded based on NK cell subsets, along with their pseudotime trajectory in HC groups (F-G) or ME/CFS groups (H-I). J-K. Regulon modules based on the correlation matrix of shared regulons of HC(J) and ME/CFS(K) of NK cells. The network shows 495 orthologous transcription factor regulons grouped into 5 major modules (red boxes) with representative transcription factor (TF) regulons. L. Bubble diagram show the top 10 enriched regulons for the NK cells. M-N. STRING plot depicting confidence of gene-gene interactions among phase-specific regulons of HC(M) and ME/CFS(N) based on the STRING database and gene ontology (GO) terms highlighted. O. Heatmap analysis depicting NK cells upregulated and downregulated genes enrichment of GO BP terms pathways of ME/CFS group. *p < 0.05,**p < 0.01,***p < 0.001. note: p mean the significance of all paths in the GO BP pathway. P. Heatmap analysis depicting NK cells upregulated and downregulated genes enrichment of KEGG pathways of ME/CFS group. *p < 0.05,**p < 0.01,***p < 0.001. note: p mean the significance of all paths in the KEGG pathway. Q-S. The frequency of Granzyme B (Q), CD107a (R) and Perforin (S) in NK cells from PBMCs of ME/CFS patients. NK cells from ME/CFS patients were cocultured with target cells for 6 h. Flow cytometry assay(FACS, n = 4 vs. 4) was used to detect cell function in target cells. T. NK cells from ME/CFS patients were cocultured with target cells for 6 h. Flow cytometry assay was used to detect 7-AAD staining in target cells
Fig. 6
Fig. 6
Cluster analysis of phenotypic differences in monocyte cell subsets. A. UMAP plot displaying the distribution of monocyte cell subsets, with each color representing a specific cell subset. B. Density plots of monocyte cell subsets in ME/CFS and HC groups, categorized by ancestry. C-E. Proportion of cell types in each individual, including CD14 monocytes (C, p = 0.22), CD16 monocytes (D, p = 0.35), and cDC cells (E, p = 0.18). The colors indicate cell type information. ns, indicates no significance. ME/CFS group compared to HC group. F-I. Pseudotime analysis revealing distinct trajectories of monocyte cell subset differentiation in ME/CFS. Cells are color-coded by monocyte cell subsets and pseudotime trajectories in HC group (F-G) or ME/CFS group (H-I). J-K. Regulon modules based on the correlation matrix of shared regulons of HC(J) and ME/CFS(K) of monocyte cells. The network shows 530 orthologous transcription factor regulons grouped into 5 major modules (red boxes) with representative transcription factor (TF) regulons. L. Bubble diagram show the top 10 enriched regulons for the monocyte cells. M-N. STRING plot depicting confidence of gene-gene interactions among phase-specific regulons of HC(M) and ME/CFS(N) based on the STRING database and gene ontology (GO) terms highlighted. O-P. Heatmap analysis illustrating the upregulated and downregulated genes enriched in GO BP (O) and KEGG(P) terms in monocyte cells of ME/CFS group. *p < 0.05,**p < 0.01,***p < 0.001. note: p mean the significance of all paths in the GO BP or KEGG pathway datebase
Fig. 7
Fig. 7
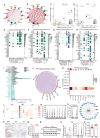
Cell-cell communication networks. A-B. Circle plot depicting cell-to-cell communication relationships between 12 main cell types and monocyte cluster cells of the HC(A) and ME/CFS(B) group. The quantitative network diagram uses nodes to represent different cell types, arrows to indicate interaction signals from ligand cells to recipient cells, and line thickness to denote the number of significant ligand-receptor interaction pairs detected between different cell types. C-D. Illustration of the incoming and outgoing interaction strengths for each of the cell types of the HC(C) and ME/CFS(D) group. E-F. The outgoing signaling pathways of each cell type of the HC(E) and ME/CFS(F) group. G-H. The incoming signaling pathways of each cell type of the HC(G) and ME/CFS(H) group. I. Significant signaling pathways ranked based on differences in overall information flow within inferred networks between ME/CFS and HC. Enriched signaling pathways more prominent in ME/CFSS are shown in blue. J. Chord diagrams of APP signals pathway from monocyte cells to other cell types in the ME/CFS group. monocyte cells are color matched to the origin, with each arc representing one pathway and arc length depicting the strength. K. The heatmap shows the communication probability of the APP signaling pathway. L-M. UMAP plot displaying the APP distribution of PBMC(L) and monocyte(M) cell subsets(L). N-O. Violin plots of APP expression in each ME/CFS patients(N) and group(O) of monocyte cells. P. Immunohistochemical staining reveal the distribution and expression of the APP. Q. Quantification of protein expression shown in figure P. ***p < 0.001, ns p>0.05, ME/CFS group(n = 3) compare with HC group (n = 3). R. Representative western blot images showing the expression of APP in the PBMC cells of the ME/CFS and HC group. β-actin was used as a loading control. S. Quantification of Western blot bands with ImageJ software. The bar graph shows the intensities of the immunoblot bands in Figure R, which were quantified using ImageJ software. ***p < 0.001, ME/CFS group (n = 3) compare with HC group (n = 3). T. The gene regulatory networks for monocyte cells enriched regulons of APP. U. Violin plots of ESRRA expression in total group of monocyte cell types (n = 4). V. Bar graph of ESRRA expression in male patients’ monocyte cell types from the GSE214284 database. *p < 0.05, ME/CFS group(n = 10) compare with HC group(n = 10)

Similar articles

Cited by

References

    1. Briese T, et al. A multicenter virome analysis of blood, feces, and saliva in myalgic encephalomyelitis/chronic fatigue syndrome. J Med Virol. 2023;95(8):e28993. - PMC - PubMed
    1. Arron HE, et al. Myalgic Encephalomyelitis/Chronic fatigue syndrome: the biology of a neglected disease. Front Immunol. 2024;15:1386607. - PMC - PubMed
    1. Xiong R, et al. Multi-‘omics of gut microbiome-host interactions in short- and long-term myalgic encephalomyelitis/chronic fatigue syndrome patients. Cell Host Microbe. 2023;31(2):273–e2875. - PMC - PubMed
    1. Wang PY, et al. WASF3 disrupts mitochondrial respiration and may mediate exercise intolerance in myalgic encephalomyelitis/chronic fatigue syndrome. Proc Natl Acad Sci U S A. 2023;120(34):e2302738120. - PMC - PubMed
    1. Choutka J, et al. Unexplained post-acute infection syndromes. Nat Med. 2022;28(5):911–23. - PubMed