. 2024 Oct 11;24(1):678.
doi: 10.1186/s12888-024-06143-x.

Associations between plasma markers and symptoms of anxiety and depression in patients with breast cancer

Affiliations

Associations between plasma markers and symptoms of anxiety and depression in patients with breast cancer

Yibo He et al. BMC Psychiatry. .

Abstract

Background and purpose: Among patients with solid tumors, those with breast cancer (BC) experience the most severe psychological issues, exhibiting a high global prevalence of depression that negatively impacts prognosis. Depression can be easily missed, and clinical markers for its diagnosis are lacking. Therefore, this study in order to investigate the diagnostic markers for BC patients with depression and anxiety and explore the specific changes of metabolism.

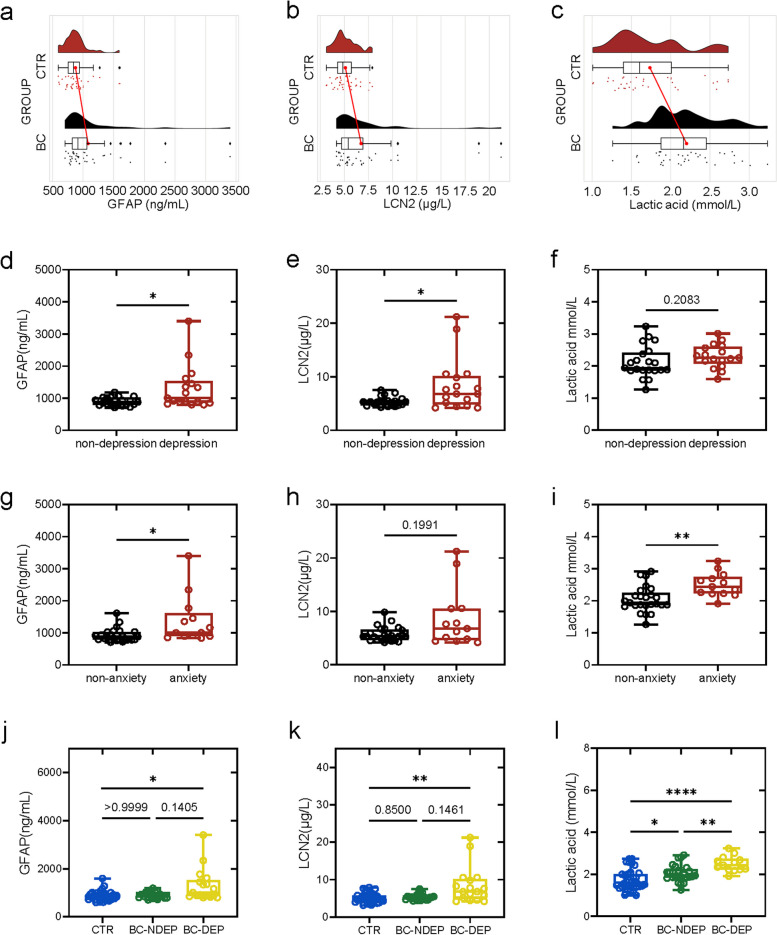
Method and results: Thirty-eight BC patients and thirty-six matched healthy controls were included in the study. The anxiety and depression symptoms of the participants were evaluated by the 17-item Hamilton Depression Scale (HAMD-17) and Hamilton Anxiety Scale (HAMA). Plasma levels of glial fibrillary acidic protein (GFAP) and lipocalin-2 (LCN2) were evaluated using enzyme linked immunosorbent assay, and plasma lactate levels and metabolic characteristics were analyzed.

Conclusion: This study revealed that GFAP and LCN2 may be good diagnostic markers for anxiety or depression in patients with BC and that plasma lactate levels are also a good diagnostic marker for anxiety. In addition, specific changes in metabolism in patients with BC were preliminarily explored.

Keywords: Breast cancer; Diagnosis; Metabolism; Mood; Patients.


Conflict of interest statement

The authors declare no competing interests.

Figures

Fig. 1
Fig. 1
The plasma level of glial fibrillary acidic protein (GFAP), lipocalin-2 (LCN2) and lactic acid in control (CTR) and breast cancer (BC) patients.(a-c) Changes of plasma GFAP, LCN2 and lactic acid in CTR (n = 36) and BC patients (n = 38). (d-f) Changes of plasma GFAP, LCN2 and lactic acid between BC patients with or without depressive symptom (non-depression: n = 21; depression: n = 17). (g-i) Changes of plasma GFAP, LCN2 and lactic acid between BC patients with or without anxiety symptom (non-anxiety: n = 25; anxiety: n = 13). (j-l) Changes of plasma GFAP, LCN2 and lactic acid among CTR (n = 36) and BC patients with depressive symptom (BC-DEP) or without depressive symptom (BC-NDEP) (non-depression: n = 21; depression: n = 17). Not significant (ns), p ≥ 0.05, *p < 0.05, **p < 0.01, and ***p < 0.001, ****p < 0.0001
Fig. 2
Fig. 2
Associations between depressive and anxiety symptoms and plasma GFAP, LCN2 and lactic acid levels. (a-c) Association between 17-item Hamilton Depression Scale (HAMD-17) scores and plasma GFAP, LCN2 and lactic acid levels. (d-f) Association between Hamilton Anxiety Scale (HAMA) scores and plasma GFAP, LCN2 and lactic acid levels. (g-h) ROC analysis revealed an optimal diagnostic value for plasma GFAP, LCN2 and GFAP + LCN2 levels in BC patients with depressive or anxiety symptoms. (i) ROC analysis revealed an optimal diagnostic value for the plasma lactic acid level in BC patients with anxiety symptoms
Fig. 3
Fig. 3
Plasma metabolomics analysis between the BCD group and CTR group. (a) Volcano map reflecting the differentially abundant metabolites between the BCD group and CTR group. (b) Heatmap of the relative abundance of differentially abundant metabolites. (c) Differentially abundant metabolite correlation analysis. The color represents the correlation: red represents a positive correlation, blue represents a negative correlation, and the darker the color is, the greater the correlation. (d) KEGG pathway enrichment analysis of differentially abundant metabolites. (e) Metabolite and metabolic pathway network diagram. Red indicates that the difference is greater, and blue indicates that the difference is lower
Fig. 4
Fig. 4
Plasma metabolomics analysis between the BCND group and CTR group. (a) Volcano map reflecting the differentially abundant metabolites between the BCND group and CTR group. (b) Heatmap of the relative abundance of differentially abundant metabolites. (c) Differentially abundant metabolite correlation analysis. The color represents the correlation: red represents a positive correlation, blue represents a negative correlation, and the darker the color is, the greater the correlation. (d) KEGG pathway enrichment analysis of differentially abundant metabolites. (e) Metabolite and metabolic pathway network diagram. Red indicates that the difference is greater, and blue indicates that the difference is lower
Fig. 5
Fig. 5
Plasma metabolomics analysis between the BCD group and the BCND group. (a) Volcano map reflecting the differentially abundant metabolites between the BCND group and BCD group. (b) Heatmap of the relative abundance of differentially abundant metabolites. (c) Differentially abundant metabolite correlation analysis. The color represents the correlation: red represents a positive correlation, blue represents a negative correlation, and the darker the color is, the greater the correlation. (d) KEGG pathway enrichment analysis of differentially abundant metabolites. (e) Metabolite and metabolic pathway network diagram. Red indicates that the difference is greater, and blue indicates that the difference is lower
Fig. 6
Fig. 6
Plasma metabolomics analysis among the CTR group, the BCD group and BCND groups.(a-b) Orthogonal partial least squares discriminant analysis (OPLS-DA) in positive ion mode and negative ion mode for three groups. (c) Z-score map of secondary differential metabolites. (d) KEGG path map. (e-i) Violin diagram of differential metabolites. Not significant (ns), p ≥ 0.05, *p < 0.05, **p < 0.01, and ***p < 0.001, ****p < 0.0001

Similar articles

Cited by

References

    1. Qu F, Wang G, Wen P, Liu X, Zeng X. Knowledge mapping of immunotherapy for breast cancer: a bibliometric analysis from 2013 to 2022. Hum Vaccin Immunother. 2024;20(1): 2335728. - PMC - PubMed
    1. Sung H, Ferlay J, Siegel RL, Laversanne M, Soerjomataram I, Jemal A, Bray F. Global cancer statistics 2020: GLOBOCAN estimates of incidence and mortality worldwide for 36 cancers in 185 countries. CA Cancer J Clin. 2021;71(3):209–49. - PubMed
    1. Wang YH, Li JQ, Shi JF, Que JY, Liu JJ, Lappin JM, Leung J, Ravindran AV, Chen WQ, Qiao YL, et al. Depression and anxiety in relation to cancer incidence and mortality: a systematic review and meta-analysis of cohort studies. Mol Psychiatry. 2020;25(7):1487–99. - PubMed
    1. Mitchell AJ, Chan M, Bhatti H, Halton M, Grassi L, Johansen C, Meader N. Prevalence of depression, anxiety, and adjustment disorder in oncological, haematological, and palliative-care settings: a meta-analysis of 94 interview-based studies. Lancet Oncol. 2011;12(2):160–74. - PubMed
    1. Ding X, Wu M, Zhang Y, Liu Y, Han Y, Wang G, Xiao G, Teng F, Wang J, Chen J, et al. The prevalence of depression and suicidal ideation among cancer patients in mainland China and its provinces, 1994–2021: a systematic review and meta-analysis of 201 cross-sectional studies. J Affect Disord. 2023;323:482–9. - PubMed

Publication types