. 2024 Oct 11;22(1):927.
doi: 10.1186/s12967-024-05739-x.

Cancer cell-selective induction of mitochondrial stress and immunogenic cell death by PT-112 in human prostate cell lines

Affiliations

Cancer cell-selective induction of mitochondrial stress and immunogenic cell death by PT-112 in human prostate cell lines

R Soler-Agesta et al. J Transl Med. .

Abstract

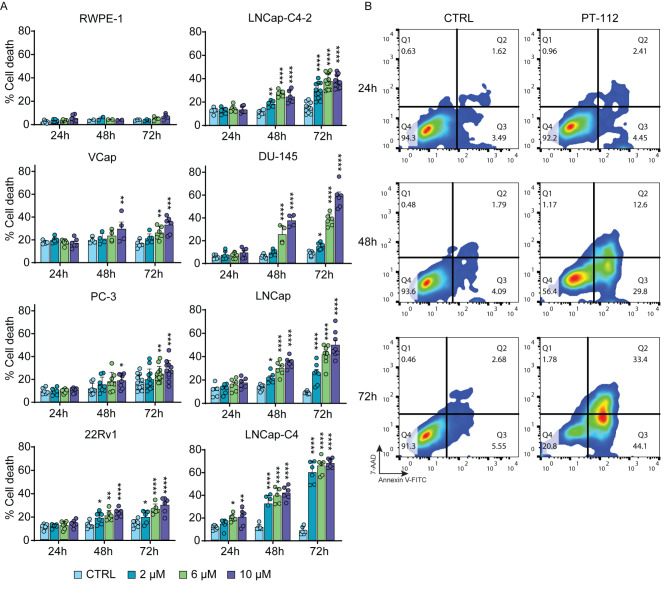
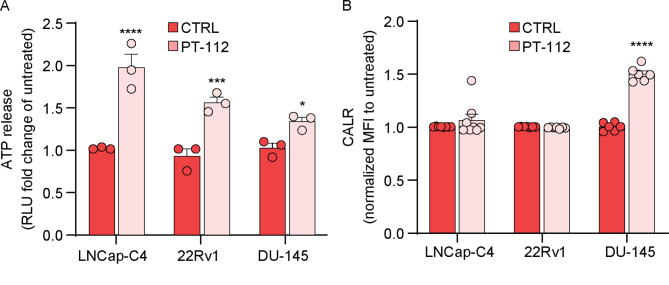
PT-112 is a novel immunogenic cell death (ICD)-inducing small molecule currently under Phase 2 clinical development, including in metastatic castration-resistant prostate cancer (mCRPC), an immunologically cold and heterogeneous disease state in need of novel therapeutic approaches. PT-112 has been shown to cause ribosome biogenesis inhibition and organelle stress followed by ICD in cancer cells, culminating in anticancer immunity. In addition, clinical evidence of PT-112-driven immune effects has been observed in patient immunoprofiling. Given the unmet need for immune-based therapies in prostate cancer, along with a Phase I study (NCT#02266745) showing PT-112 activity in mCRPC patients, we investigated PT-112 effects in a panel of human prostate cancer cell lines. PT-112 demonstrated cancer cell selectivity, inhibiting cell growth and leading to cell death in prostate cancer cells without affecting the non-tumorigenic epithelial prostate cell line RWPE-1 at the concentrations tested. PT-112 also caused caspase-3 activation, as well as stress features in mitochondria including ROS generation, compromised membrane integrity, altered respiration, and morphological changes. Moreover, PT-112 induced damage-associated molecular pattern (DAMP) release, the first demonstration of ICD in human cancer cell lines, in addition to autophagy initiation across the panel. Taken together, PT-112 caused selective stress, growth inhibition and death in human prostate cancer cell lines. Our data provide additional insight into mitochondrial stress and ICD in response to PT-112. PT-112 anticancer immunogenicity could have clinical applications and is currently under investigation in a Phase 2 mCRPC study.

Keywords: Autophagy; Immunogenic cell death; Mitochondrial stress; PT-112; Prostate cancer.


Conflict of interest statement

C.Y. Yim, M. Congenie, T.D. Ames, M.R. Price and J. Jimeno are or have been employees of Promontory Therapeutics Inc.

Figures

Fig. 1
Fig. 1
Relative cell growth (%) upon PT-112 treatment compared to untreated control (CTRL) cells. Cell lines were incubated with increasing concentrations of PT-112 (2, 6, and 10 µM) for 24–72 h. Cell growth was measured by the MTT assay. Results are shown as a mean ± SEM of at least 3 independent experiments performed in duplicate. * p ≤ 0.05, ** p ≤ 0.01, *** p ≤ 0.001, **** p ≤ 0.0001
Fig. 2
Fig. 2
Relative cell death (%) upon PT-112 treatment compared to untreated control (CTRL) cells. (A) Cells were incubated with increasing concentrations of PT-112 (2, 6, and 10 µM) for 24–72 h. Cells were then simultaneously stained with annexin-V-FITC and 7-AAD and analyzed by flow cytometry. Results are shown as mean ± SEM of at least 3 independent experiments performed in duplicate. * p ≤ 0.05, ** p ≤ 0.01, *** p ≤ 0.001, **** p ≤ 0.0001. (B) Cell death over 72 h PT-112 treatment in DU-145 cells. Representative dot-plots showing the 7-AAD and annexin-V-FITC staining evolution with time of DU-145 cells treated with 10 µM PT-112 for 24–72 h compared to untreated control (CTRL) cells
Fig. 3
Fig. 3
Characterization of cell death induced by PT-112 in human prostate cancer cells (A) Levels of caspase-3 activation upon PT-112 treatment in DU-145 and LNCap-C4. Cells were treated with 10 µM of PT-112 for 24–72 h, incubated with anti-cleaved caspase-3 labeled with FITC dye, and analyzed by flow cytometry. The numbers in each box represent the percentage of cleaved caspase-3 compared to untreated control (CTRL) cells. (B) Quantification of levels of caspase-3 activation. Results are shown as mean ± SEM of 3 independent experiments performed in duplicate. ** p ≤ 0.01, *** p ≤ 0.001, **** p ≤ 0.0001. (C) Representative images of cells treated with 10 µM PT-112 for 72 h were taken using an inverted microscope. (D) Effects of Z-VAD-fmk and/or necrostatin-1 (Nec-1) inhibitors on PT-112-induced-cell death. Cells were pretreated for 1 h with or without pan-caspase and/or necroptosis inhibitors and incubated with 10 µM of PT-112 for 48 h. Flow cytometry analysis was performed using annexin-V-FITC and 7-AAD staining. Results are shown as mean ± SEM of at least 2 independent experiments performed in duplicate. Statistical significance compared to cells treated with PT-112 only is depicted in the graphics. ** p ≤ 0.01, *** p ≤ 0.001
Fig. 4
Fig. 4
Effects of PT-112 on mtROS production and mitochondrial mass in human prostate cancer cell lines. (A) mtROS levels in cells treated with 10 µM PT-112 for 24–72 h were analyzed by flow cytometry using MitoSOX™ labeling. Graph bars correspond to mean fluorescence intensity (MFI) normalized to untreated control (CTRL) cells. Results are shown as mean ± SEM from 3 independent experiments. * p ≤ 0.05 ** p ≤ 0.01.*** p ≤ 0.001, **** p ≤ 0.0001. (B) Representative histograms showing mtROS production in DU-145 and LNCap-C4. Dotted histograms correspond to the fluorescence of untreated control (CTRL) cells, and gray-colored histograms correspond to the fluorescence values of treated cells. (C) Mitochondrial mass (mitoMass) was measured by flow cytometry using MitoTracker™ Green in DU-145 upon 10 µM PT-112 incubation for 24, 48, and 72 h. Graph bars correspond to mean fluorescence intensity (MFI) normalized to CTRL. Results are shown as mean ± SEM from 3 independent experiments. ** p ≤ 0.01
Fig. 5
Fig. 5
Effects of PT-112 on mitochondrial membrane potential (Δψm) in human prostate cancer cell lines. (A) Mitochondrial membrane potential was monitored by flow cytometry using simultaneous TMRE and annexin-V-DYE-634 staining in DU-145 and LNCaP-C4 treated with 10 µM PT-112 for 48 h and 72 h. The series of dot plots show the staining evolution of the treated cell population compared to the control (CTRL). (B) Confocal fluorescence microscopy images correspond to mitochondrial staining of LNCap and DU-145 cell lines with TMRE or JC-1, with or without 25 µM PT-112 treatment for 72 h. Nuclei were stained using Hoechst dye
Fig. 6
Fig. 6
Effects of PT-112 on mitochondrial respiration and activity of respiratory complexes and supercomplexes in the ETC. (A) OCR and ECAR were measured in LNCap-C4 cells treated with vehicle (CTRL) or 10 µM PT-112 for 24 h. Dotted vertical lines indicate administration of injections of the specified cellular respiration modulators at different time points, such that basal respiration (i.e., OCR prior to oligomycin injection), ATP-linked oxygen consumption (the difference between basal OCR and oligomycin-inhibited OCR) and spare respiratory capacity (the difference between FCCP-induced maximal OCR and basal OCR) were investigated. Results are expressed as mean ± SEM at each time point. (B) Graph bars quantifying basal respiration measured in Fig. 6A. Results are expressed as mean ± SEM from multiple experiments. *** p ≤ 0.001. (C) Energy map plotting OCR (indicative of OXPHOS) vs. ECAR (indicative of glycolysis) for cells treated with vehicle (CTRL) or 10 µM PT-112 for 24 h. Four relative bioenergetic phenotypes (aerobic vs. glycolytic and energetic vs. quiescent) are labeled. Note that the axes for OCR in (A) and (C) utilize arbitrary units (a.u.), and thus are not comparable. (D) Bar graphs show the activity of respiratory complexes and supercomplexes in DU-145 cells treated with 10 µM PT-112 for 24 h. Results are expressed as mean ± SEM from at least 4 independent experiments. * p ≤ 0.05, *** p ≤ 0.001
Fig. 7
Fig. 7
Effects of PT-112 on cell and organelle morphology in DU-145 cells treated with vehicle (CTRL) or 10 µM PT-112 for 1, 6, 24 and 48 h. Representative TEM images at the indicated resolution are shown. Letters and symbols indicate the following. Red arrows: mitochondria cristae, blue arrows: accumulation of degraded membranes inside the mitochondrial matrix, PR: Polyribosome, C: Cytoplasm, M: Mitochondria, N: Nucleus, AB: Apoptotic Body, EDV: Early Degradation Vesicle (secondary lysosome), LDV: Late Degradation Vesicle (late lysosome), ER: Endoplasmic Reticulum, V: low electron density vacuole. Red numbers in the right bottom image (48 h time) illustrate sequential stages of a possible mitophagy process
Fig. 8
Fig. 8
DAMP emission induced by PT-112 in human prostate cancer cell lines. (A) ATP release and (B) calreticulin exposure upon 10 µM PT-112 treatment for 48 h. Bar graphs show relative measurements for each parameter normalized to untreated control (CTRL) samples. Results are expressed as mean ± SEM from 3 independent experiments. RLU: relative light units. * p ≤ 0.05, *** p ≤ 0.001, **** p ≤ 0.0001
Fig. 9
Fig. 9
Autophagy induction by PT-112. Analysis of autophagosome formation. Cells were incubated with 10 µM of PT-112 for 24–72 h. The autophagosome formation was analyzed by flow cytometry using the Cyto-ID® method. Bars represent the mean fluorescence intensity (MFI) of treated cells compared to untreated control cells (CTRL). Results are expressed as mean ± SEM from 3 independent experiments with technical duplicates for all cell lines except in PC-3 cells, where the mean ± SEM is calculated from 2 independent experiments. * p ≤ 0.05, ** p ≤ 0.01, **** p ≤ 0.0001

References

    1. Siegel R, Miller K, Wagle N, Jemal A. Cancer statistics, 2023. CA Cancer J Clin. 2023;73:17–48. - PubMed
    1. Sung H, Ferlay J, Siegel R, Laversanne M, Soerjomataram I, Jemal A, Bray F. Global Cancer statistics 2020: GLOBOCAN estimates of incidence and Mortality Worldwide for 36 cancers in 185 countries. CA Cancer J Clin. 2021;71:209–49. - PubMed
    1. Buck S, Koolen S, Mathijssen R, de Wit R, van Soest R. Cross-resistance and drug sequence in prostate cancer. Drug Resist Update. 2021;56:100761. - PubMed
    1. Galletti G, Leach B, Lam L, Tagawa S. Mechanisms of resistance to systemic therapy in metastatic castration-resistant prostate cancer. Cancer Treat Rev. 2017;57:16–27. - PubMed
    1. Hwang C. Overcoming docetaxel resistance in prostate cancer: a perspective review. Ther Adv Med Oncol. 2012;4:329–40. - PMC - PubMed