. 2024 Dec;11(12):3081-3094.
doi: 10.1002/acn3.52215. Epub 2024 Oct 11.

Prediction of stroke severity: systematic evaluation of lesion representations

Affiliations

Prediction of stroke severity: systematic evaluation of lesion representations

Anna K Bonkhoff et al. Ann Clin Transl Neurol. 2024 Dec.

Abstract

Objective: To systematically evaluate which lesion-based imaging features and methods allow for the best statistical prediction of poststroke deficits across independent datasets.

Methods: We utilized imaging and clinical data from three independent datasets of patients experiencing acute stroke (N1 = 109, N2 = 638, N3 = 794) to statistically predict acute stroke severity (NIHSS) based on lesion volume, lesion location, and structural and functional disconnection with the lesion location using normative connectomes.

Results: We found that prediction models trained on small single-center datasets could perform well using within-dataset cross-validation, but results did not generalize to independent datasets (median R2 N1 = 0.2%). Performance across independent datasets improved using large single-center training data (R2 N2 = 15.8%) and improved further using multicenter training data (R2 N3 = 24.4%). These results were consistent across lesion attributes and prediction models. Including either structural or functional disconnection in the models outperformed prediction based on volume or location alone (P < 0.001, FDR-corrected).

Interpretation: We conclude that (1) prediction performance in independent datasets of patients with acute stroke cannot be inferred from cross-validated results within a dataset, as performance results obtained via these two methods differed consistently, (2) prediction performance can be improved by training on large and, importantly, multicenter datasets, and (3) structural and functional disconnection allow for improved prediction of acute stroke severity.


Conflict of interest statement

R.W.R. has served on a DSMB for a trial sponsored by Rapid Medical and has served as site PI for studies sponsored by Penumbra and Microvention. N.S.R. has received compensation as scientific advisory consultant from Omniox, Sanofi Genzyme, and AbbVie Inc. Further authors do not have anything to disclose.

Figures

Figure 1
Figure 1
Prediction of stroke severity. Lesion information was captured by total lesion volume, voxel‐wise structural lesion segmentations, and structural and functional lesion connectivity. For preprocessing, the voxel‐wise features were each initially dimensionality reduced via principal component analysis. We kept as many components as were necessary to explain 95% of the variance in the original data. We then trained either linear ridge regression or kernel support vector regression models in a five‐fold nested cross‐validation to predict individual NIHSS scores. Prediction performance was evaluated as explained variance (coefficient of determination, R 2). Training of prediction models was repeated for each of the three cohorts considered in this study: The WashU cohort with 109 patients, an MGH‐based cohort comprising 638 patients, and the multicenter cohort of 794 MRI‐GENIE patients. For each of these cohorts, we trained prediction models considering each of the lesion information features, in isolation and in combination with lesion volume. External test data were made up of the two cohorts not involved in the training process. The nested cross‐validation scheme figure is adapted from Ref. [45].
Figure 2
Figure 2
Lesion overlays of included cohorts. The maximum lesion overlap was found subcortically in the white matter in proximity to the lateral ventricles, picturing the predominance of middle cerebral artery (MCA) strokes, for all three cohorts. Lesions in MGH and MRI‐GENIE additionally covered posterior circulation territories. Stroke lesions affecting the anterior cerebral artery territory were generally rare.
Figure 3
Figure 3
Low‐dimensional lesion features, exemplarily illustrated for the MRI‐GENIE cohort. To retain 95% of the variance of the original WashU cohort dataset, we needed 57 components for lesion location, 29 for SDC, and 11 for FDC data. For the MGH cohort, we needed 251 components for lesion location, 65 for SDC, and 13 for FDC. For the MRI‐GENIE cohort, we needed 285 components for lesion location, 66 for SDC, and 14 for FDC. Going from the smallest to the largest dataset, the number of components needed to explain 95% of the variance increased substantially for lesion location (from 57 to 285), approximately doubled for SDC data (from 29 to 66 components), and changed very little for FDC data (from 12 to 14). For each of the three different sources of lesion information – lesion location, structural disconnection, and functional disconnection – we here present all the components that individually explained more than 10% of the variance in the original dataset. With respect to functional disconnection (C), the components qualitatively resembled gradients obtained via diffusion embedding; for example, with the first components ranging from transmodal to primary sensorimotor regions.
Figure 4
Figure 4
(A) Prediction performances across training cohorts and lesion features. While the average prediction performance decreased from cross‐validated estimates to estimates in external data for both small and larger single‐center data, there was no such decrease observable for larger, multicenter data. The prediction performance was the highest in case of training on large and multicenter data, making it the most amenable scenario to evaluate the performance of individual lesion features. Each dot represents the average explained variance of one particular lesion feature, such as lesion location, SDC, or FDC. Explained variance was measured as the coefficient of determination. (B) Illustration of changes in explained variance from the cross‐validated estimates in the training cohort to the estimates in external data. Each line represents a separate lesion feature, that is, lesion location, SDC, and FDC, each in isolation and combination with lesion volume.
Figure 5
Figure 5
Prediction results of stroke severity in external data when training relied on the larger, multi‐site MRI‐GENIE training dataset. For both ridge regression (A) and support vector regression (B), there was a clear benefit from integrating information from indirect connectivity techniques, in case of FDC once combined with lesion volume information. The significantly highest performance was achieved by SDC in case of ridge regression and FDC with lesion volume information for support vector regression (pair‐wise t‐tests, level of significance P < 0.05, FWE‐corrected for multiple comparisons). For the ease of interpretation of the bar graphs, the winning model is marked with a small, exemplary brain rendering representing the respective lesion representation.
Figure 6
Figure 6
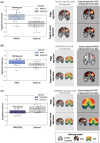
Prediction results when training relied on the WashU cohort (A) or downsampled sets of the MGH and MRI‐GENIE cohorts (B, C). On the left, prediction performance across lesion features is summarized in box plots: The prediction performance obtained via cross‐validation in the training datasets depended on the actual training cohort and was on average higher for the single‐center cohorts, that is, WashU and MGH compared to the multicenter MRI‐GENIE cohort. These differences could conceivably originate from cohort‐specific patient characteristics and inclusion/exclusion criteria (given that the sample size itself was the same in all three scenarios). Of note, the overall prediction performance in external data was generally low across all three samples (on average <~9%). On the right, graphics visualize the winning lesion feature in each individual scenario: While SDC led to the significantly highest prediction performance for all prediction model and cross‐validation vs. external data combinations in the WashU cohort, the situation became more complex for the further two cohorts: Here, all three lesion features, that is, lesion location, structural disconnection, and functional disconnection excelled in different scenarios. As is also the case in Figures 5 and 7, the winning representation is visually highlighted by brain renderings. The renderings themselves present examples of the respective lesion representation but cannot be interpreted with respect to voxel‐wise importances.
Figure 7
Figure 7
Prediction results when training relied on the MGH cohort (A) or MRI‐GENIE cohort (B). The left columns present cross‐validated estimates in the training datasets, while the right columns represent estimates for the external test data. The upper row presents ridge regression and the lower row supper vector regression results.

References

    1. Carrera E, Tononi G. Diaschisis: past, present, future. Brain. 2014;137(9):2408‐2422. doi:10.1093/brain/awu101 - DOI - PubMed
    1. Salvalaggio A, De Filippo De Grazia M, Zorzi M, Thiebaut de Schotten M, Corbetta M. Post‐stroke deficit prediction from lesion and indirect structural and functional disconnection. Brain. 2020;143(7):2173‐2188. doi:10.1093/brain/awaa156 - DOI - PMC - PubMed
    1. Cohen AL, Ferguson MA, Fox MD. Lesion network mapping predicts post‐stroke behavioural deficits and improves localization. Brain. 2021;144(4):e35. - PMC - PubMed
    1. Salvalaggio A, De Filippo De Grazia M, Pini L, Thiebaut De Schotten M, Zorzi M, Corbetta M. Reply: lesion network mapping predicts post‐stroke behavioural deficits and improves localization. Brain. 2021;144(4):e36. - PMC - PubMed
    1. Bowren M Jr, Bruss J, Manzel K, et al. Post‐stroke outcomes predicted from multivariate lesion‐behaviour and lesion network mapping. Brain. 2022;145(4):1338‐1353. doi:10.1093/brain/awac010 - DOI - PMC - PubMed

LinkOut - more resources