. 2025 Mar 7;27(3):795-810.
doi: 10.1093/neuonc/noae215.

Targeted delivery of napabucasin with radiotherapy improves outcomes in diffuse midline glioma

Affiliations

Targeted delivery of napabucasin with radiotherapy improves outcomes in diffuse midline glioma

Matthew Gallitto et al. Neuro Oncol. .

Abstract

Background: Diffuse midline glioma (DMG) is the most aggressive primary brain tumor in children. All previous studies examining the role of systemic agents have failed to demonstrate a survival benefit; the only standard of care is radiation therapy (RT). Successful implementation of radiosensitization strategies in DMG remains an essential and promising avenue of investigation. We explore the use of Napabucasin, an NAD(P)H quinone dehydrogenase 1 (NQO1)-bioactivatable reactive oxygen species (ROS)-inducer, as a potential therapeutic radiosensitizer in DMG.

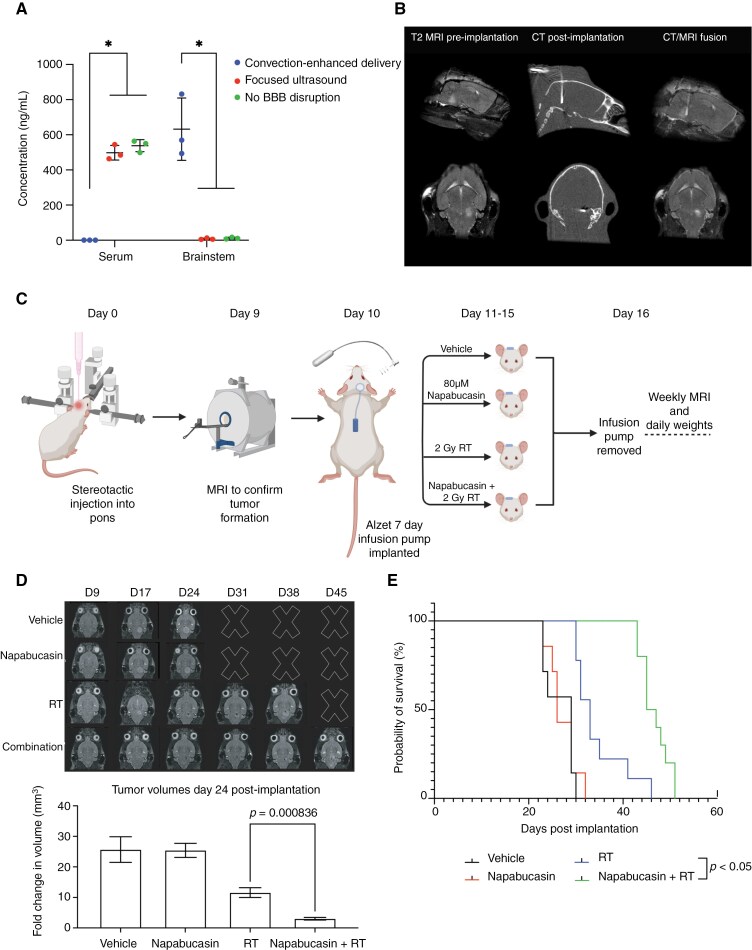
Methods: In this study, we conduct in vitro and in vivo assays using patient-derived DMG cultures to elucidate the mechanism of action of Napabucasin and its radiosensitizing properties. As penetration of systemic therapy through the blood-brain barrier (BBB) is a significant limitation to the success of DMG therapies, we explore focused ultrasound (FUS) and convection-enhanced delivery (CED) to overcome the BBB and maximize therapeutic efficacy.

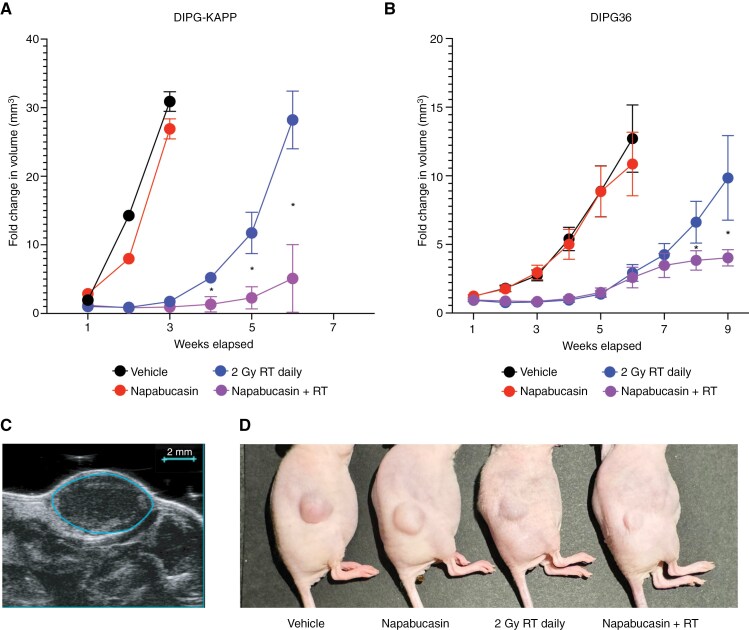
Results: Napabucasin is a potent ROS-inducer and radiosensitizer in DMG, and treatment-mediated ROS production and cytotoxicity are dependent on NQO1. In subcutaneous xenograft models, combination therapy with RT improves local control. After optimizing targeted drug delivery using CED in an orthotopic mouse model, we establish the novel feasibility and survival benefit of CED of Napabucasin concurrent with RT.

Conclusions: As nearly all DMG patients will receive RT as part of their treatment course, our validation of the efficacy of radiosensitizing therapy using CED to prolong survival in DMG opens the door for exciting novel studies of alternative radiosensitization strategies in this devastating disease while overcoming limitations of the BBB.

Keywords: blood-brain barrier; convection-enhanced drug delivery; diffuse midline glioma; focused ultrasound; radiosensitization.


Conflict of interest statement

Dr. Califano is founder, equity holder, and consultant of DarwinHealth Inc., a company that has licensed some of the algorithms used in this manuscript from Columbia University. Columbia University is also an equity holder in DarwinHealth Inc. US patent number 10,790,040 has been awarded related to this work, and has been assigned to Columbia University with Dr. Califano as an inventor. Lorenzo Tomassoni is an employee of DarwinHealth Inc.

Figures

Figure 1.
Figure 1.
NQO1 is expressed in DMG patient tissue and tumor-derived cell cultures. (A) Box and Whisker plot of bulk RNA-sequencing data from 76 DMG patient tissue samples showing NQO1 expression in log10 (transcripts per million [TPM]) compared to normal brain tissue from 246 normal caudate tissue samples from GTEx (1.40 and 1.15 in DMG and normal brain tissue, respectively, ***= P < .001). (B) Violin plot with single cell normalized expression of NQO1 generated using Seurat SCTransform from single cell RNA-sequencing data from two syngeneic DMG mouse model tumors (combined) as compared to normal mouse brainstem (***= P < .001). (C) Western blot analysis of NQO1 and α-Tubulin in several tumor-derived cell cultures, mouse brain tissue lysate, and human embryonic kidney (293T cells). Error bars represent median +/− IQR. P value for A was calculated using a Wilcoxon test, comparing log10TPM after removing batch effects. The P value for B was calculated using a Wilcoxon test comparing normalized gene expression between DMG tumor versus normal mouse brainstem in Seurat with P-values corrected by the Bonferroni method to adjust for multiple comparisons across all genes.
Figure 2.
Figure 2.
Napabucasin is a potent ROS-inducer in DMG. (A) Dose–response curves for cell viability of DMG cell cultures, as measured by MTT ([3-(4,5-Dimethylthiazol-2-yl)-2,5-Diphenyltetrazolium Bromide]) using CellTiter-Blue after 72-hour exposure to Napabucasin (N = 3 for each cell line). (B) GO analysis of the top 200 upregulated genes after 24 hours of Napabucasin treatment in DIPG6 in vitro (top 10 pathways shown based on adjusted P-value). (C) Pathway enrichment analysis using VIPER-inferred protein activity (top 10 pathways shown based on adjusted P-value). (D) Graph of DCFDA assay showing relative ROS levels (compared to vehicle) after treatment with 1 or 2 µM Napabucasin for 6 hours (N = 3 per group, *= P < .05) in DIPG-KAPP and DIPG36. Error bars represent mean +/− SD, P values for (D) were calculated using a two-tailed Student’s t-test.
Figure 3.
Figure 3.
Napabucasin is a radiosensitizer in vitro. (A) Effects of RT on NQO1 expression detected by RT-qPCR 24 hours post-RT (N = 3 per group, *= P < .05). (B) Western blot analysis of NQO1 and quantification of band intensities (relative to control α-Tubulin) from cell lysate 24 hours post-RT (*= P < .05). (C). Clonogenic survival assay using colony formation in DIPG-KAPP and DIPG36 cells. Representative 6 well plates after treatment of DIPG36 with 4 Gy of RT in the presence and absence of 0.2 µM Napabucasin (left). On right, plots show surviving fraction at 14 days after increasing doses of RT in the presence and absence of 0.2 µM Napabucasin for DIPG-KAPP and DIPG36 cells. (D) Bar graph showing normalized ROS levels detected by DCFDA assay in DIPG36 (left) and DIPG-KAPP (right) after treatment with 1 µM Napabucasin for 24 hours, a single dose of 4 Gy RT, combination treatment, or no treatment (control; N = 3 per group). Error bars represent mean +/− SD. P values for A, B, and D were calculated using a two-tailed Student’s t-test comparing mean values between each treatment group. For C, P values were calculated comparing differences in fit using nonlinear regression with the linear quadratic cell death function.
Figure 4.
Figure 4.
The effects of Napabucasin are dependent on NQO1. (A) Western blot analysis of NQO1 and control α-Tubulin after Cas9-expressing DIPG36 cells were infected with lentivirus expressing sgNQO1-1, sgNQO1-2, and sgRNA targeting the ROSA26 locus control (sgNeg). (B) Dose–response curves for cell viability as measured by MTT ([3-(4,5-Dimethylthiazol-2-yl)-2,5-Diphenyltetrazolium Bromide]) using CellTiter-Blue after 72-hour exposure to Napabucasin (N = 3 for each cell line). IC50 values increase by more than 2-fold with NQO1 depletion. (C) Effects of Napabucasin on gene expression of 3 downstream oxidative response genes; NQO1 KO and WT DIPG36 treated with 1 µM Napabucasin or vehicle control for 6 hours followed by RT-qPCR. The bar graph shows the relative change in gene expression, normalized to Actin and vehicle (N = 3 per group, *= P < .05). (D) Bar graph showing normalized ROS levels detected by DCFDA assay after treatment of NQO1-depleted DIPG36 cells with 1 µM Napabucasin for 24 hours, a single dose of 4 Gy RT, or combination treatment (top). Bar graph showing comparison in normalized ROS levels detected by DCFDA assay between WT and NQO1-depleted cells (bottom; N = 3 per group, * = P < .05). (E) Clonogenic survival assay using colony formation in NQO1 KO and WT DIPG36 cells. Plots show surviving fraction at 14 days after increasing doses of RT in the presence and absence of 0.2 µM Napabucasin for each cell line. Error bars represent mean +/− SD. P values for C and D were calculated using a two-tailed Student’s t-test comparing mean values between each treatment group. For E, P values were calculated comparing differences in fit using nonlinear regression with the linear quadratic cell death function.
Figure 5.
Figure 5.
Napabucasin has a radiosensitizing effect in subcutaneous xenograft models. After flank injection with DMG cells, treatment was initiated when tumors reached 50 mm3. Mice received either vehicle, Napabucasin monotherapy (10 mg/kg i.p. injection daily for 5 days), 2 Gy RT daily for 5 days, or combination therapy. Plots showing fold-change in tumor volume weekly starting from week 1 (2 days following completion of a treatment regimen) in DIPG-KAPP (A) and DIPG36 (B) (N = 6 mice per condition). Error bars represent mean +/− SD, * = P < .05 when comparing RT monotherapy to combination therapy at specified timepoint. (C) Representative ultrasound image of flank tumor showing contoured gross tumor volume. (D) Representative image of nude mice with DIPG36 flank tumors at week 8. P values for A and B were calculated using a two-tailed Student’s t-test comparing mean values between RT monotherapy and combination therapy groups.
Figure 6.
Figure 6.
Targeted delivery of Napabucasin using CED in combination with RT is feasible in orthotopic DMG mouse models and prolongs overall survival. (A) Bar graph showing mean brainstem concentration of Napabucasin’s most common in vivo metabolite (dihydro‐napabucasin [M1]) after a single 2-minute FUS session with microbubbles or a 4-day osmotic pump infusion of 80 µM Napabucasin directly into the brainstem (CED; N = 3 matched serum and brainstem samples per group). Napabucasin concentration in the brainstem was 625, 7.7, and 12.1 ng/mL after CED, FUS, and no BBB disruption/bypass, respectively. * = P < .05. (B) Representative T2-weighted MRI images at day 9 post-implantation confirming T2 edema (left). After pump implantation, CT images were obtained (middle) and overlayed with the T2-weighted MRI images taken prior to implant to confirm correct pump placement. (C) Schematic overview of steps and timing for stereotactic implantation of DIPG-KAPP cells and subsequent CED pump placement (created with BioRender). (D) Representative T2-weighted MRI images over time in each experimental group (D = days post-tumor implantation; top). The bar graph below shows the mean change in tumor volume at day 24 post-implantation (N = 6 mice per group). (E) Kaplan–Meier curve showing overall survival of DMG orthotopic model with targeted drug delivery using CED pumps. Combination treatment with Napabucasin and RT had the longest survival benefit, with median survival 46 versus 33 days (P < .05), 26 days (P < .05), and 29 days (P < .05) in RT only, Napabucasin only, and vehicle groups, respectively (N = 9 mice per group). Error bars represent mean +/− SD, P values for A and D derived using 2-tailed Student’s t-test and P values in E derived by log-rank test (Mantel-Cox test),

References

    1. Hashizume R. Epigenetic targeted therapy for diffuse intrinsic pontine glioma. Neurol Med Chir (Tokyo). 2017;57(7):331–342. - PMC - PubMed
    1. Louis DN, Perry A, Wesseling P, et al. The 2021 WHO classification of tumors of the central nervous system: A summary. Neuro Oncol. 2021;23(8):1231–1251. - PMC - PubMed
    1. Hankinson TC, Campagna EJ, Foreman NK, Handler MH.. Interpretation of magnetic resonance images in diffuse intrinsic pontine glioma: A survey of pediatric neurosurgeons. J Neurosurg Pediatr. 2011;8(1):97–102. - PubMed
    1. Warren KE. Diffuse intrinsic pontine glioma: Poised for progress. Front Oncol. 2012;2:205. - PMC - PubMed
    1. Martinez PJ, Green AL, Borden MA.. Targeting diffuse midline gliomas: The promise of focused ultrasound-mediated blood-brain barrier opening. J Control Release. 2023;365:412–421. - PMC - PubMed

MeSH terms