. 2024 Nov;9(11):103930.
doi: 10.1016/j.esmoop.2024.103930. Epub 2024 Oct 11.

Immune microenvironment modulation following neoadjuvant therapy for oesophageal adenocarcinoma: a translational analysis of the DEBIOC clinical trial

Affiliations

Immune microenvironment modulation following neoadjuvant therapy for oesophageal adenocarcinoma: a translational analysis of the DEBIOC clinical trial

E Scanlon et al. ESMO Open. 2024 Nov.

Abstract

Background: The Dual Erb B Inhibition in Oesophago-gastric Cancer (DEBIOC) trial reported an acceptable safety profile for neoadjuvant oxaliplatin and capecitabine (Xelox) ± AZD8931 in oesophageal adenocarcinoma (OAC) but limited efficacy. We evaluated the impact of neoadjuvant Xelox ± AZD8931, a novel small-molecule inhibitor with equipotent activity against epidermal growth factor receptor (EGFR), human epidermal growth factor receptor (HER)2 and HER3, on biological pathways using a unique software-driven solution.

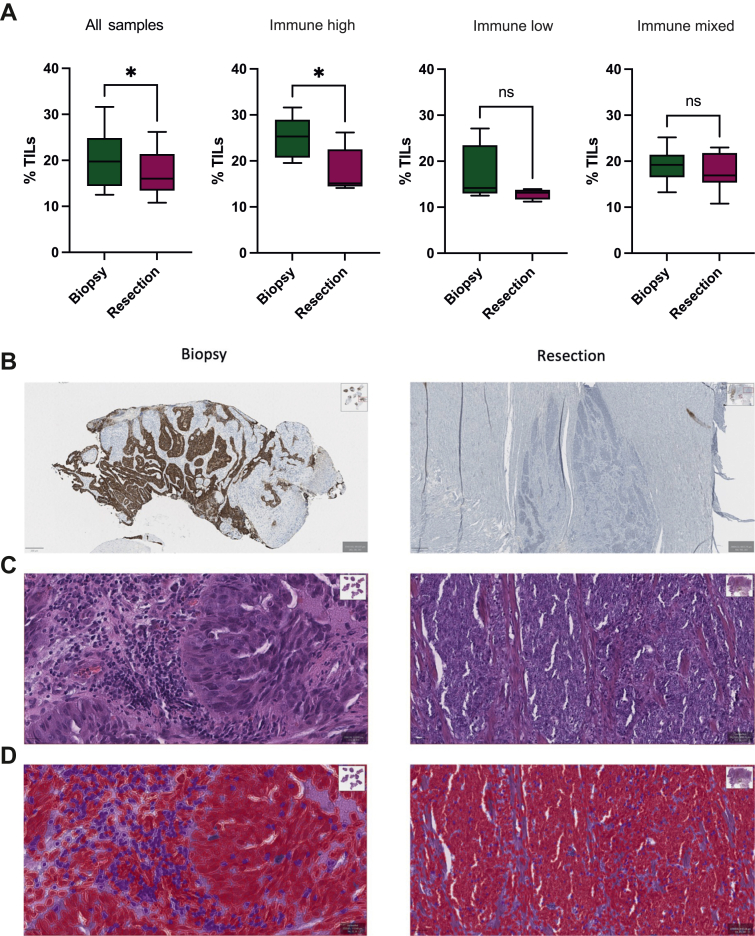
Patients and methods: Transcriptomic profiles from 25 pre-treatment formalin-fixed paraffin-embedded OAC biopsies and 18 matched resection specimens, treated with Xelox + AZD8931 (n = 16) and Xelox alone (n = 9), were analysed using the Almac claraT total mRNA report analysing 92 gene signatures, 100 unique single-gene drug targets and 7337 single genes across 10 hallmarks of cancer. Gene-set enrichment analysis (GSEA) was utilised to investigate pathways governing pathological response. Tumour-infiltrating lymphocytes (TILs) were assessed digitally using the QuPath software.

Results: Hierarchical clustering identified three molecular subgroups classified by activation of innate immune signalling. The immune-high subgroup was associated with HER2 positivity, increased pathological response and a marked reduction in immune signalling and TILs following neoadjuvant therapy. The immune-low cluster was predominantly HER2/EGFR-negative, and EGFR positivity was associated with the immune-mixed subgroup. Treatment with neoadjuvant therapy induced common resistance mechanisms, such as angiogenesis and epithelial-mesenchymal transition signalling, and a reduction in DNA repair signatures. Addition of AZD8931 was associated with reduction of expression of EGFR, HER2 and AKT pathways and also promoted an immunosuppressive microenvironment. GSEA showed that patients with a pathological response to treatment had increased immune signalling, whereas non-responders to neoadjuvant therapy were enriched for nucleotide repair and cellular growth through the action of E2F transcription factors.

Conclusion: OAC may be subdivided into three immune-related subgroups which undergo modulation in response to neoadjuvant therapy with marked suppression of the immune microenvironment in HER2-positive/immune-high tumours.

Keywords: AZD8931; adenocarcinoma; gene expression signature; oesophageal cancer.


Figures

Figure 1
Figure 1
Immune signalling, angiogenesis and EMT in biopsy and resection specimens in the DEBIOC study. Semi-supervised clustering of (A) pre-treatment biopsies (n = 25) and cluster comparison where possible of their respective (B) paired resection specimens (n = 17). claraT signatures are grouped into gene signatures predicting acquired immunity (panel 1), innate immunity (panel 2), interferon signalling (panel 3), expression of immune checkpoint genes (panel 4), gene signatures reported to predict response to ICB (panel 5), gene signatures reported to predict resistance to ICB (panel 6), gene signatures associated with increased angiogenic signalling or response to anti-angiogenic agents (panel 7) and gene signatures associated with increased EMT signalling (panel 8). DDIR, HER2 immunohistochemistry and EGFR FISH status were shown to differ significantly between biopsy clusters (Fisher’s exact testing; P = 0.001, P = 0.032 and P = 0.027, respectively) and are indicated on the x-axis as well as treatment with either Xelox alone or Xelox + AZD8931. Pathological response, progression and death events are also highlighted. ∗P < 0.05; ∗∗P < 0.01; ∗∗∗P < 0.001, Kruskal–Wallis testing amongst clusters. + Indicates a signature previously identified as having an AUC score >0.65 from ROC-AUC analysis, indicating that signature is predictive of PFS outcomes at 24 months. – Indicates a biopsy specimen where no paired resection specimen is available for comparison post-treatment, all other matched samples are in the same order across biopsy and resection clusters for ease of comparison pre- and post-treatment. X indicates the HER2+ paired samples used in the digital pathology analysis. AUC, area under the ROC curve; DDIR, DNA damage immune response; EGFR, epidermal growth factor receptor; EMT, epithelial–mesenchymal transition; HER2, human epidermal growth factor receptor 2; ICB, immune checkpoint blockade; PFS, progression-free survival; ROC, receiver operating characteristic.
Figure 2
Figure 2
Neoadjuvant therapy alters immune, angiogenesis and EMT signalling pathways. Boxplots comparing signature scores (percentile ranks) using Wilcoxon signed rank testing between paired biopsies (n = 17) and resection specimens demonstrated that neoadjuvant therapy induced significant changes in signatures related to (A) DDIR score (annotated as Almac IO assay, P < 0.001), (B) mast cells (P = 0.001), (C) angiogenesis (P < 0.001), (D and E) EMT (P = 0.001 and P < 0.001 respectively), (F) genomic instability (P < 0.001), (G) senescence (P = 0.001), (H) TGF-β signalling (P < 0.001), (I and J) metabolism (both P < 0.001) and (K) myogenesis (P < 0.001). (L and M) Plots displaying significant results only from Spearman’s rank correlation testing (P < 0.05) of gene signatures relating to response/resistance to ICB, angiogenic or EMT signalling in biopsy (n = 25) (L) and resection (n = 17) (M) specimens. Increasing significance and strength of correlations are indicated by an increase in size and colour intensity of circles on the heatmap where red indicates positive correlation and blue indicates negative correlation. DDIR, DNA damage immune response; EMT, epithelial–mesenchymal transition; ICB, immune checkpoint blockade; TGF, transforming growth factor.
Figure 2
Figure 2
Neoadjuvant therapy alters immune, angiogenesis and EMT signalling pathways. Boxplots comparing signature scores (percentile ranks) using Wilcoxon signed rank testing between paired biopsies (n = 17) and resection specimens demonstrated that neoadjuvant therapy induced significant changes in signatures related to (A) DDIR score (annotated as Almac IO assay, P < 0.001), (B) mast cells (P = 0.001), (C) angiogenesis (P < 0.001), (D and E) EMT (P = 0.001 and P < 0.001 respectively), (F) genomic instability (P < 0.001), (G) senescence (P = 0.001), (H) TGF-β signalling (P < 0.001), (I and J) metabolism (both P < 0.001) and (K) myogenesis (P < 0.001). (L and M) Plots displaying significant results only from Spearman’s rank correlation testing (P < 0.05) of gene signatures relating to response/resistance to ICB, angiogenic or EMT signalling in biopsy (n = 25) (L) and resection (n = 17) (M) specimens. Increasing significance and strength of correlations are indicated by an increase in size and colour intensity of circles on the heatmap where red indicates positive correlation and blue indicates negative correlation. DDIR, DNA damage immune response; EMT, epithelial–mesenchymal transition; ICB, immune checkpoint blockade; TGF, transforming growth factor.
Figure 3
Figure 3
Neoadjuvant therapy with Xelox + AZD8931 compared to Xelox alone alters EGFR/HER2 and immune signalling pathways. (A) Heatmap highlighting gene signatures from their respective hallmarks which underwent a significant change from pre- to post-treatment using paired patient samples (n = 17) of which n = 11 received Xelox + AZD8931 and n = 6 received Xelox alone using Wilcoxon signed rank testing with false discovery rate (P-value <0.2). Unique signature changes are highlighted per treatment type as well as changes which were common across both treatment types, where red indicates a significant increase and blue indicates a significant decrease in signature scores from pre- to post-treatment. (B) Plots displaying significant results only from Spearman’s rank correlation testing (P < 0.05) of gene signatures relating to response/resistance to ICB, angiogenic or EMT signalling in resection samples treated with Xelox only (n = 6) and resection samples treated with Xelox + AZD8931 (n = 11), respectively. Increasing significance and strength of correlations are indicated by an increase in size and colour intensity of circles on the heatmap, where red indicates positive correlation and blue indicates negative correlation. EGFR, epidermal growth factor receptor; EMT, epithelial–mesenchymal transition; HER2, human epidermal growth factor receptor 2; ICB, immune checkpoint blockade.
Figure 4
Figure 4
Biological pathways mediating pathological responders to neoadjuvant therapy. (A-C) Boxplots showing gene signature scores representing pathways significantly dysregulated between pathological responders (n = 3) and non-responders (n = 22) to neoadjuvant treatment at biopsy determined by Wilcoxon/Mann–Whitney U testing. (D) KEGG and Reactome pathways were significantly enriched, ranked by the normalised enrichment score and FDR q-value, when comparing pre-treatment biopsies of responders versus non-responders to neoadjuvant chemotherapy from GSEA, with pathways significantly associated with responders (n = 3) to neoadjuvant chemotherapy highlighted in red, and pathways significantly associated with non-responders (n = 22) to neoadjuvant chemotherapy highlighted in blue. (E) Volcano plot highlighting genes differentially expressed between responders (n = 3) and non-responders (n = 22) to neoadjuvant chemotherapy from significance analysis of microarrays analysis of respective patient biopsy samples (FDR q-value <0.2/−log10 q-value >0.6), where blue indicates genes significantly up-regulated in non-responders and red indicates genes significantly up-regulated in responders to neoadjuvant treatment. FDR, false discovery rate; GSEA, gene-set enrichment analysis.
Figure 5
Figure 5
Tumour-infiltrating lymphocytes and immune clusters. (A) Alterations in TIL percentage following neoadjuvant therapy in the cohort as a whole and according to immune cluster designation (unpaired t-test; ∗ P < 0.05). Exemplar immune-high cluster case showing (B) positive HER2 expression [immunohistochemistry (IHC) 3+] in the biopsy specimen but loss of HER2 expression in the matched resection specimen. This was associated with a reduction in immune cell infiltration in the (C) unmodified and (D) enhanced haematoxylin and eosin–stained biopsy and resection specimens with TIL classification masks where TILs are identified using purple masks and all other cells, red. HER2, human epidermal growth factor receptor 2; TIL, tumour-infiltrating lymphocyte.

References

    1. Weaver J.M.J., Ross-Innes C.S., Shannon N., et al. Ordering of mutations in preinvasive disease stages of esophageal carcinogenesis. Nat Genet. 2014;46(8):837–843. - PMC - PubMed
    1. Secrier M., Li X., de Silva N., et al. Mutational signatures in esophageal adenocarcinoma define etiologically distinct subgroups with therapeutic relevance. Nat Genet. 2016;48(10):1131–1341. - PMC - PubMed
    1. Frankell A.M., Jammula S., Li X., et al. The landscape of selection in 551 esophageal adenocarcinomas defines genomic biomarkers for the clinic. Nat Genet. 2019;51(3):506–516. - PMC - PubMed
    1. Kim J., Bowlby R., Mungall A.J., et al. Integrated genomic characterization of oesophageal carcinoma. Nature. 2017;541(7636):169–175. - PMC - PubMed
    1. Morgan E., Soerjomataram I., Gavin A.T., et al. International trends in oesophageal cancer survival by histological subtype between 1995 and 2014. Gut. 2020 gutjnl-2020-321089. - PubMed

MeSH terms

Supplementary concepts