. 2024 Nov 12;57(11):2669-2687.e6.
doi: 10.1016/j.immuni.2024.09.007. Epub 2024 Oct 11.

Microglia and monocyte-derived macrophages drive progression of pediatric high-grade gliomas and are transcriptionally shaped by histone mutations

Affiliations

Microglia and monocyte-derived macrophages drive progression of pediatric high-grade gliomas and are transcriptionally shaped by histone mutations

James L Ross et al. Immunity. .

Abstract

Pediatric high-grade gliomas (pHGGs), including hemispheric pHGGs and diffuse midline gliomas (DMGs), harbor mutually exclusive tumor location-specific histone mutations. Using immunocompetent de novo mouse models of pHGGs, we demonstrated that myeloid cells were the predominant infiltrating non-neoplastic cell population. Single-cell RNA sequencing (scRNA-seq), flow cytometry, and immunohistochemistry illustrated the presence of heterogeneous myeloid cell populations shaped by histone mutations and tumor location. Disease-associated myeloid (DAM) cell phenotypes demonstrating immune permissive characteristics were identified in murine and human pHGG samples. H3.3K27M DMGs, the most aggressive DMG, demonstrated enrichment of DAMs. Genetic ablation of chemokines Ccl8 and Ccl12 resulted in a reduction of DAMs and an increase in lymphocyte infiltration, leading to increased survival of tumor-bearing mice. Pharmacologic inhibition of chemokine receptors CCR1 and CCR5 resulted in extended survival and decreased myeloid cell infiltration. This work establishes the tumor-promoting role of myeloid cells in DMG and the potential therapeutic opportunities for targeting them.

Keywords: CCR1; CCR5; TAM; diffuse midline glioma; disease-associated macrophage; high-grade glioma; macrophage; microglia; monocyte; pediatric glioma.


Conflict of interest statement

Declaration of interests The authors declare no competing interests.

Figures

Figure 1.
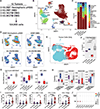
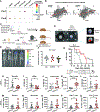
Figure 1.. Tumor location and driver mutation shape tumor expression profiles, immune infiltrates, and survival.
(A-B) Schematic outlining where and what molecular subtype of tumors were generated in the mouse brain for NanoString analysis. (C) Principal component analysis of each tumor subtype (n=4–5 per group) based on their expression of all genes detected in the NanoString panel. (D) Unsupervised hierarchical clustering of all samples and genes. (E) CD45, Macrophage, and Neutrophil cell scores for murine NanoString samples. (F) Cell scores for human tumors grouped by tumor location. (G) Schematic demonstrating experimental setup. (H) Kaplan-Meier survival curves for cortical and (I) midline tumors induced in either N-tva;Trp53-fl/fl mice for H3.3WT tumors driven by RCAS-Cre, RCAS-PDGFB, and RCAS-H3WT, or N-tva;Trp53fl/fl;Atrxfl/fl mice for H3G34R tumors driven by RCAS-Cre, RCAS-PDGFB, and RCAS-G34R. (J) Kaplan-Meier survival curves for cortical and (K) midline tumors induced in N-tva mice driven by RCAS-PDGFB, RCAS-shp53, RCAS-H3.3WT, and RCAS-ACVR1 WT for wild type tumors. RCAS-PDGFB, RCAS-shp53, RCAS-H3.1K27M, and RCAS-ACVR1 R206H for H3.1K27M tumors. RCAS-PDGFB, RCAS-shp53, RCAS-H3.3K27M, and RCAS-ACVR1 R206H for H3.3K27M tumors. n.s. = no significance, *p<0.05, **p<0.01 by one-way ANOVA with Tukey’s multiple comparison test in (E), Student’s t test in (F), and log-rank (Mantel-Cox) test in (H-K). See also Figures S1–S3.
Figure 2.
Figure 2.. ScRNA-seq reveals tumor driver mutations shape cell composition and immune cell infiltrates.
(A) 12 tumors composed of 3 biological replicates each of 4 pediatric tumor models (H3.3WT cortical pHGG, H3.3WT DMG, H3.1K27M DMG, and H3.3K27M DMG) were single-cell sequenced. (B) UMAP dimensionality reduction of the entire scRNA-seq dataset showing cells colored by annotated cell types. (C) Proportions of each annotated cell type. (D) UMAP cell density plots for each tumor subtype depicting cell populations shown in (B). (E) UMAP of neoplastic tumor cells only, colored by cycling (red) or non-cycling (blue) cells. (F) Quantification of the proportion of cycling tumor cells for each tumor subtype. (G) Box plots of average module scores for indicated neoplastic cell gene expression programs discovered using hdWGCNA. (H) Box plots of sample cell type proportion as a fraction of the cell types listed. (I) Quantification of flow cytometry on H3.1K27M (n=19), H3.3K27M (n=20), and H3.3WT DMGs (n=19). (J) Gene expression dot plot of T-cell recruiting chemokines. *p<0.05, **p<0.01, ***p<0.001, and ****p<0.0001 by one-way ANOVA with Tukey’s multiple comparison test in (I) and by Welch’s two-sample t test in (F). See also Figure S4.
Figure 3.
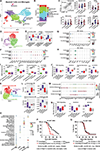
Figure 3.. Disease-associated myeloid cells and microglia are enriched in DMGs and have reduced interferon signaling.
(A) UMAP dimensionality reduction of myeloid cell scRNA-seq data for all samples. (B) Proportions of myeloid cell subsets for each tumor subtype. (C) Flow cytometry quantification of myeloid cell populations in H3.1K27M (n=19), H3.3K27M (n=20), and H3.3WT DMGs (n=19). (D) UMAP of all MDM cells annotated into 3 clusters: pro-inflammatory MDM (green), disease-associated MDM (red), and proliferating MDM (purple). (E) Quantifications of the proportion of MDM subsets, relative to all MDMs. (F) Dot plot heat map of the top 5 DEGs for each MDM subset. (G-H) Dot plot of “M1” (G) “M2” (H) gene expression across MDM subsets. (I-J) Box plots of average module scores for the indicated hdWGCNA MDM gene modules grouping cells by subset (I) or tumor subtype (J). (K) UMAP of all microglial cells annotated into 4 subsets: homeostatic MG (green), disease-associated MG (DAMG)(red), interferon responsive MG (cyan), and proliferating MG (purple). (L) Box plot quantifications of the proportion of each indicated microglial population, relative to all microglia. (M) Dot plot heat map showing top 5 DEGs for each microglial subset. (N) Box plots of average module scores for the indicated hdWGCNA microglia gene modules separated by tumor subtype. (O) GSEA for the DEGs of each microglial population. (P) Survival curves for N-tva;Ifngr1wt/wt (black) or N-tva;Ifngr1fl/fl;Cx3cr1-Cre (red) tumor-bearing mice. (Q) Survival curves for N-tva;Trp53fl/fl (black) or N-tva;Ifngr1fl/fl;Trp53fl/fl (red) tumor-bearing mice. *p<0.05, **p<0.01, ***p<0.001, and ****p<0.0001 by one-way ANOVA with Tukey’s multiple comparison test in (C), Welch’s two-sample t test in (E and L), Mann-Whitney-Wilcoxon test in (I), and log-rank (Mantel-Cox) test in (P-Q). See also Figures S4–S5.
Figure 4.
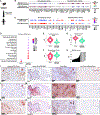
Figure 4.. Disease-associated myeloid cells share a common gene signature and are found in human patient samples.
(A-B) The top DEGs from murine disease-associated MDM and microglia compared to murine non-diseased MDM and microglia was used to annotate (C) CD14 monocytes, CD16 monocytes, and microglia from human pHGG scRNA-sequencing data. (D) GSEA pathway analysis of human CD14 monocytes compared to CD16 monocytes and microglia. (E-F) Enrichment scores for the non-disease and for the disease-associated gene signatures, respectively in human cell types. (G) WGCNA pathway analysis of human CD14 monocytes compared to CD16 monocytes and microglia, demonstrating module micro11, whose genes are displayed in (H). (I) Immunohistochemistry of matched human pHGG samples for IBA1 (top), (J) HMOX1 (middle), (K) and Galectin 3 (bottom). (L) Immunohistochemistry of matched murine H3.1K27M DMG tissue for IBA1, (M) HMOX1, and (N) Galectin 3 in the tumor bulk and adjacent non-tumor brain from the same samples. Scale bar=200um. ****p<0.0001 by Student’s t test in (E-G). See also Figure S6.
Figure 5.
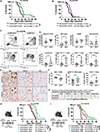
Figure 5.. Ccl8/12 knockout confers survival advantage in DMGs.
(A-B) Kaplan-Meier survival curves of H3.1K27M and H3.3K27M DMGs in N-tva;Ccl8/12+/+ or N-tva;Ccl8/12−/− mice. (C) Flow cytometry plots demonstrating gating scheme for the indicated cell types. (D) Flow cytometry quantification of the indicated cell populations in H3.1K27M DMGs in N-tva;Ccl8/12+/+ (n=8) or N-tva;Ccl8/12−/− (n=7) mice. (E) Representative images of immunohistochemical staining for the indicated markers in H3.1K27M DMGs in N-tva;Ccl8/12+/+ or N-tva;Ccl8/12−/− mice. (F) Quantification of immunohistochemical staining. (G) Summary of significant changes detected by immunohistochemical staining in Ntva;Ccl8/12−/− mice compared to N-tva;Ccl8/12+/+ for H3.1K27M and H3.3K27M DMGs. (H) Kaplan-Meier survival curves for H3.1K27M DMGs in N-tva;Ccl8/12+/+ or N-tva;Ccl8/12−/− mice treated with saline or anti-PD-1. (I) Kaplan-Meier survival curves for H3.1K27M DMGs in N-tva;Ccl8/12+/+ or N-tva;Ccl8/12−/− mice treated with IgG2b or anti-CD4. *p<0.05, **p<0.01, ***p<0.001, and ****p<0.0001 by log-rank (Mantel-Cox) test in (A,B, and H-I) and Student’s t test in (D and F-G). See also Figure S7.
Figure 6.
Figure 6.. Ccl8/12 loss confers transcriptional modulation of microglia towards homeostatic phenotypes.
(A) scRNA density plots from neoplastic tumor cells only, separated into cycling and non-cycling tumor cells in H3.1K27M N-tva;Ccl8/12+/+ (WT)(n=3) or N-tva;Ccl8/12−/− (DKO)(n=3) DMGs. (B) Box plot quantification of the proportion of cycling tumor cells, relative to tumor cells only in WT and DKO samples. (C) Immunohistochemistry of PH3 in WT or DKO tumors. (D) Quantification of PH3 staining. (E) UMAP density plots of WT and DKO MDM subsets. (F-H) Box plot quantification of the proportion of MDM subsets in WT and DKO tumors. (I) UMAP density plots of WT and DKO microglia subsets. (J-M) Box plot quantification of the proportion of microglia subsets in WT and DKO tumors. (N) Heat map of the top DEGs when comparing microglia from WT and DKO tumors. (O) Dot plot of H2-Ab1, H2-Aa, and H2-Eb1 expression in microglia subsets between WT and DKO samples. (P) GSEA DEGs when comparing microglia from WT and DKO tumors. (Q) Schematic of proposed mechanism of enhanced survival in DKO tumors. *p<0.05 by Student’s t test in (D) and by Welch’s two-sample t test in (B and K). See also Figure S7.
Figure 7.
Figure 7.. CCR1 and CCR5 inhibition increases survival in DMG.
(A) Dot plot of Ccr1 and Ccr5 expression in myeloid cells and tumor cells using our scRNA-seq database. (B) Correlation of P2RY12 with CCR1 and CCR5 in human pHGG samples using the PedcBioPortal ICR London Dataset. (C) Schematic of tumor generation for pharmacologic experiments. (D) Example of bioluminescent imaging (BLI) of luciferase expressing DMG. (E) BLI done on Day 21 post injection (p.i.). (F) BLI was performed to equally distribute tumors across treatment groups before starting treatment. (G) Kaplan-Meier survival curves of vehicle treated, iCCR1 + iCCR5 treated, and radiation therapy (RT) treated mice. (H-L) Flow cytometry quantification of the indicated populations in tumors and (M-Q) blood of vehicle treated (n=10) and iCCR1 + iCCR5 treated (n=10) mice. *p<0.05, **p<0.01, ***p<0.001 by log-rank (Mantel-Cox) test in (G) and Student’s t test in (H-Q).

Comment in

References

    1. Mackay A, Burford A, Carvalho D, Izquierdo E, Fazal-Salom J, Taylor KR, Bjerke L, Clarke M, Vinci M, Nandhabalan M, et al. (2017). Integrated Molecular Meta-Analysis of 1,000 Pediatric High-Grade and Diffuse Intrinsic Pontine Glioma. Cancer Cell 32, 520–537 e525. 10.1016/j.ccell.2017.08.017. - DOI - PMC - PubMed
    1. Juratli TA, Qin N, Cahill DP, and Filbin MG (2018). Molecular pathogenesis and therapeutic implications in pediatric high-grade gliomas. Pharmacol Ther 182, 70–79. 10.1016/j.pharmthera.2017.08.006. - DOI - PubMed
    1. Siddaway R, Canty L, Pajovic S, Milos S, Coyaud E, Sbergio SG, Vadivel Anguraj AK, Lubanszky E, Yun HY, Portante A, et al. (2022). Oncohistone interactome profiling uncovers contrasting oncogenic mechanisms and identifies potential therapeutic targets in high grade glioma. Acta Neuropathol 144, 1027–1048. 10.1007/s00401-022-02489-2. - DOI - PMC - PubMed
    1. Wu G, Broniscer A, McEachron TA, Lu C, Paugh BS, Becksfort J, Qu C, Ding L, Huether R, Parker M, et al. (2012). Somatic histone H3 alterations in pediatric diffuse intrinsic pontine gliomas and non-brainstem glioblastomas. Nat Genet 44, 251–253. 10.1038/ng.1102. - DOI - PMC - PubMed
    1. Schwartzentruber J, Korshunov A, Liu XY, Jones DT, Pfaff E, Jacob K, Sturm D, Fontebasso AM, Quang DA, Tonjes M, et al. (2012). Driver mutations in histone H3.3 and chromatin remodelling genes in paediatric glioblastoma. Nature 482, 226–231. 10.1038/nature10833. - DOI - PubMed

Publication types

MeSH terms

LinkOut - more resources