. 2024 Nov;65(11):100669.
doi: 10.1016/j.jlr.2024.100669. Epub 2024 Oct 10.

GCKIII kinases control hepatocellular lipid homeostasis via shared mode of action

Affiliations

GCKIII kinases control hepatocellular lipid homeostasis via shared mode of action

Emmelie Cansby et al. J Lipid Res. 2024 Nov.

Abstract

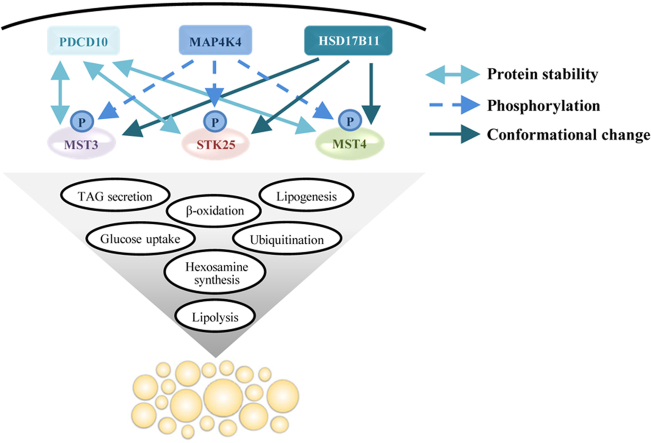
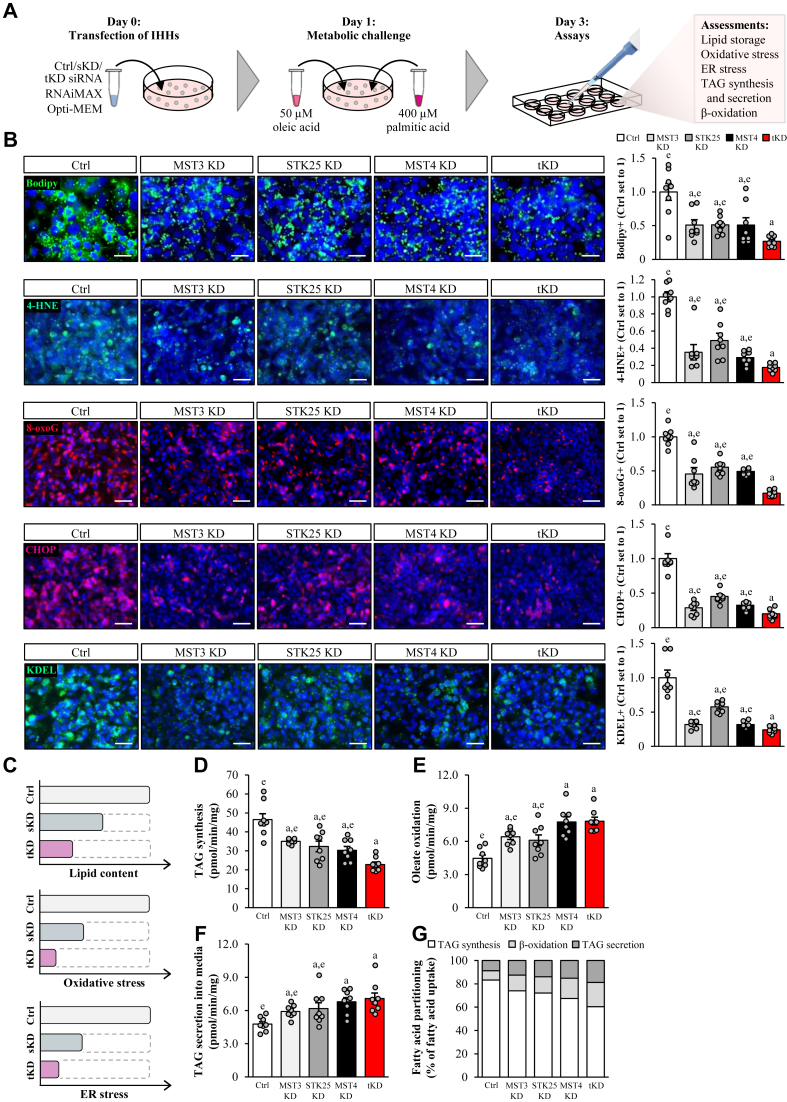
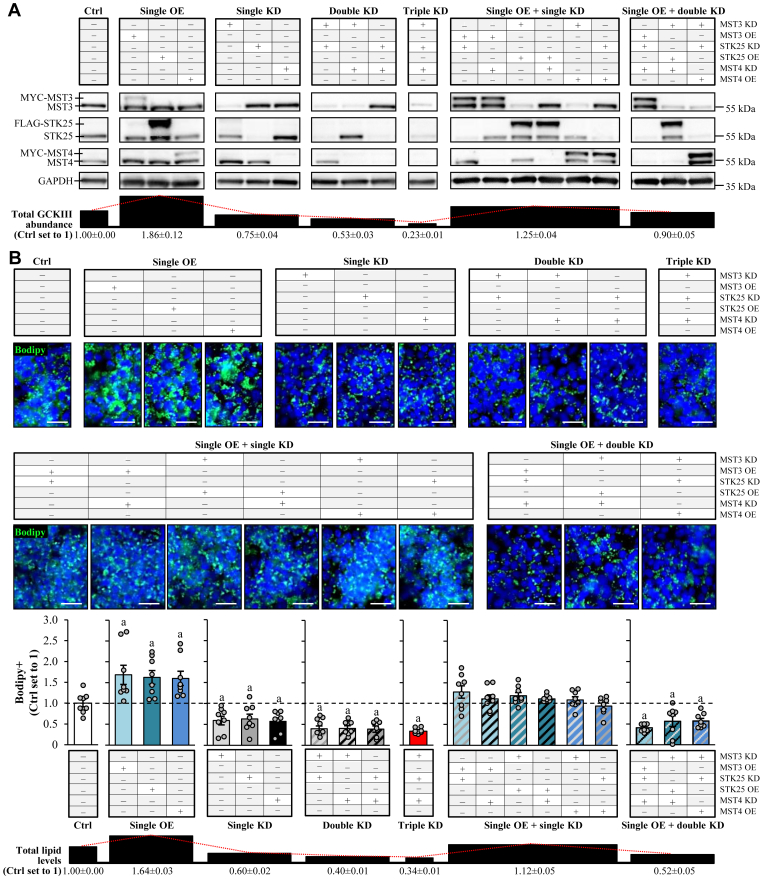
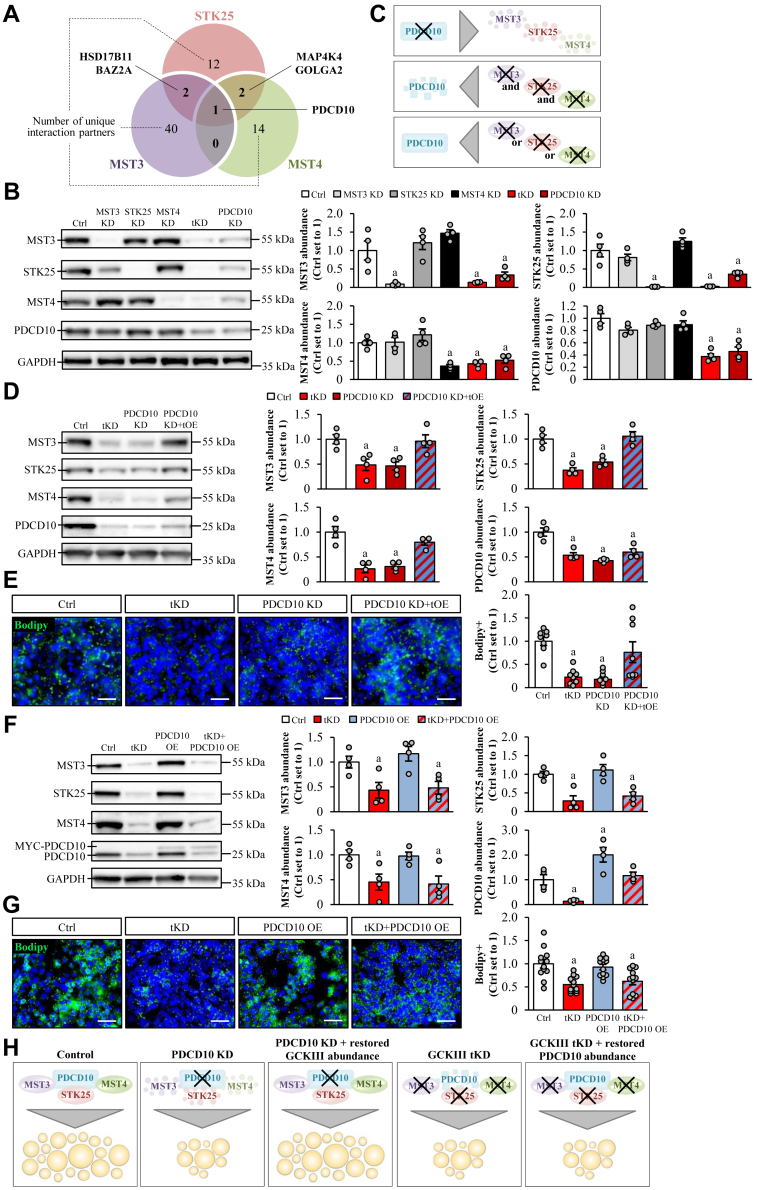
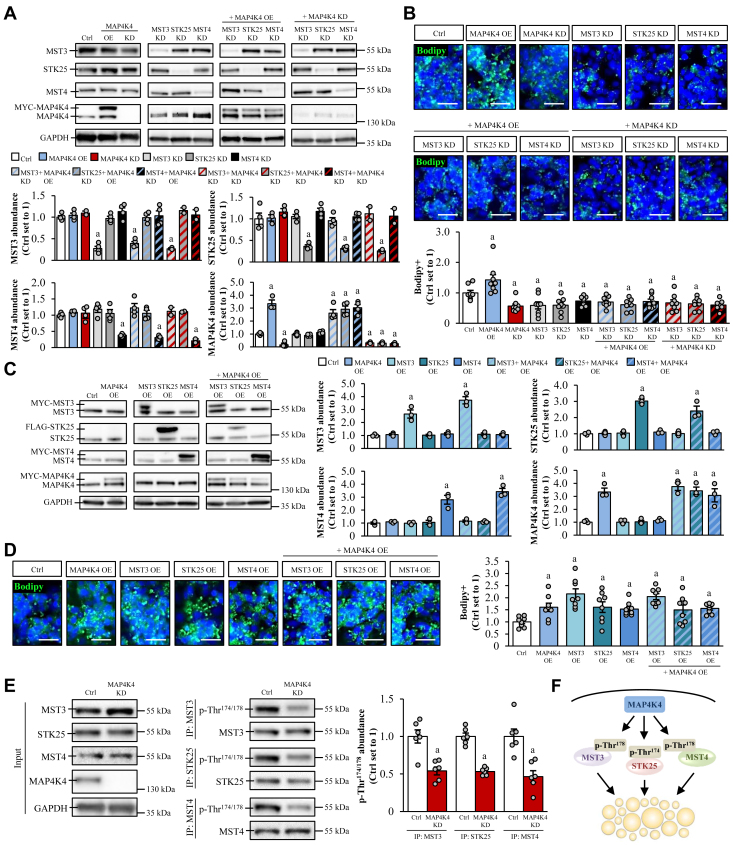
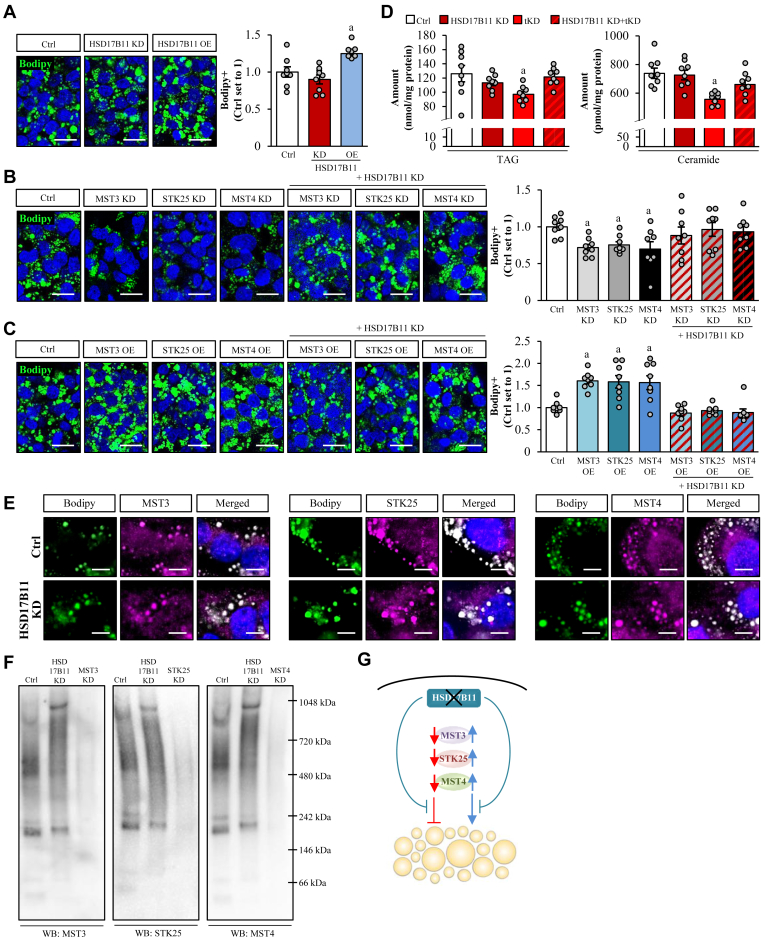
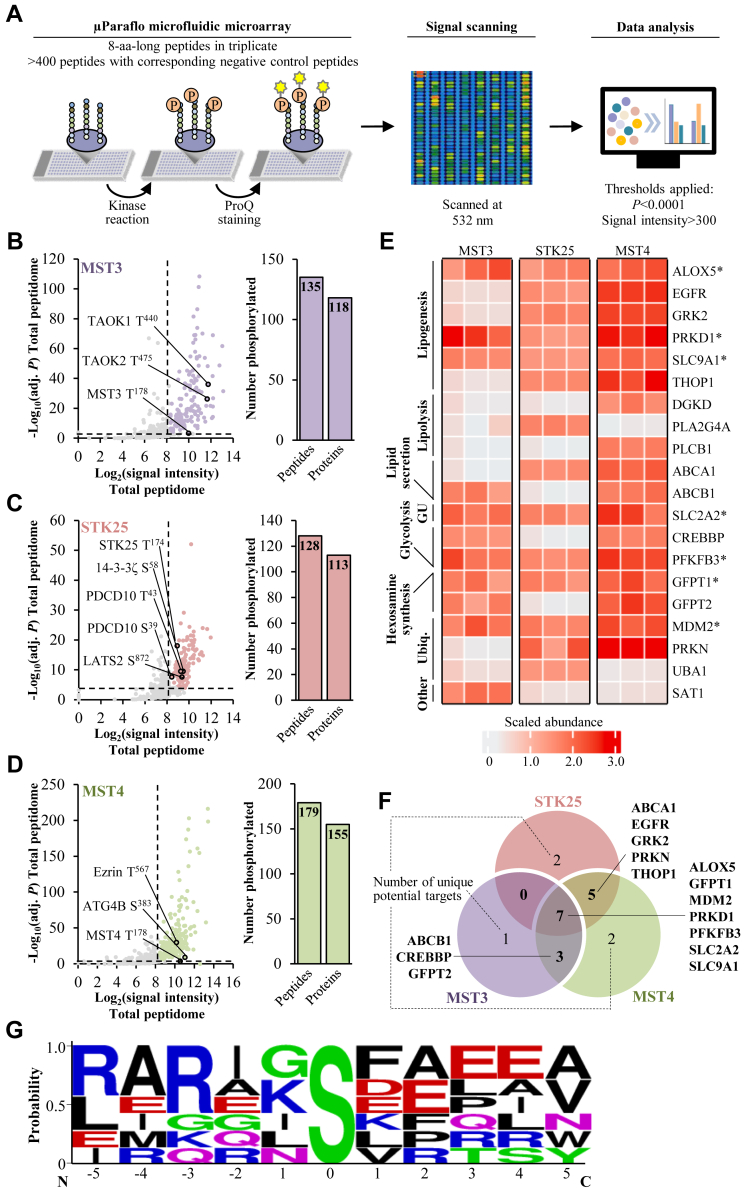
Metabolic dysfunction-associated steatotic liver disease has emerged as a leading global cause of chronic liver disease. Our recent translational investigations have shown that the STE20-type kinases comprising the GCKIII subfamily-MST3, STK25, and MST4-associate with hepatic lipid droplets and regulate ectopic fat storage in the liver; however, the mode of action of these proteins remains to be resolved. By comparing different combinations of the silencing of MST3, STK25, and/or MST4 in immortalized human hepatocytes, we found that their single knockdown results in a similar reduction in hepatocellular lipid content and metabolic stress, without any additive or synergistic effects observed when all three kinases are simultaneously depleted. A genome-wide yeast two-hybrid screen of the human hepatocyte library identified several interaction partners contributing to the GCKIII-mediated regulation of liver lipid homeostasis, that is, PDCD10 that protects MST3, STK25, and MST4 from degradation, MAP4K4 that regulates their activity via phosphorylation, and HSD17B11 that controls their action via a conformational change. Finally, using in vitro kinase assays on microfluidic microarrays, we pinpointed various downstream targets that are phosphorylated by the GCKIII kinases, with known functions in lipogenesis, lipolysis, and lipid secretion, as well as glucose uptake, glycolysis, hexosamine synthesis, and ubiquitination. Together, this study demonstrates that the members of the GCKIII kinase subfamily regulate hepatocyte lipid metabolism via common pathways. The results shed new light on the role of MST3, STK25, and MST4, as well as their interactions with PDCD10, MAP4K4, and HSD17B11, in the control of liver lipid homeostasis and metabolic dysfunction-associated steatotic liver disease susceptibility.

Keywords: MASH; MASLD; lipid droplets; lipidomics; lipotoxicity; liver; triacylglycerol.


Conflict of interest statement

Conflicts of interest The authors declare that they have no conflicts of interest with the contents of this article.

Figures

None
Graphical abstract
Fig. 1
Fig. 1
Single knockdown of MST3, STK25, or MST4 suppresses fatty acid–induced lipotoxicity in human hepatocytes to a similar degree, with the decrease in ectopic lipid accumulation and metabolic stress being slightly more pronounced in triple-deficient hepatocytes. IHHs were transfected with MST3, STK25, MST4, and/or NTC siRNA, and incubated with oleic and palmitic acid for 48 h posttransfection. A: Schematic illustration of the study design. B: Representative images of cells stained with Bodipy (green) or processed for immunofluorescence with anti-4-HNE (green), anti-8-oxoG (red), anti-CHOP (red), or anti-KDEL (green) antibodies; nuclei stained with DAPI (blue). Quantification of the staining. Scale bar: 50 μm. C: Schematic illustration of the impact of single versus triple knockdown of the GCKIII kinases on hepatocellular lipotoxicity. D: TAG synthesis from [14C]-labeled oleic acid. E: Oxidation of [14C]-labeled oleic acid. F: Secretion of [14C]-labeled TAG into the medium. G: Relative fatty acid partitioning based on the results shown in (D–F). Data are mean ± SEM from 8 cell culture wells per group. For (B and D–G), representative results from 2 to 3 independent experiments are shown.aP < 0.05 versus control; eP < 0.05 versus tKD. 4-HNE, 4-hydroxynonenal; 8-oxoG, 8-oxoguanine; CHOP, C/EBP-homologous protein; Ctrl, control; KD, knockdown; DAPI, 4',6-diamidino-2-phenylindole; NTC, nontargeting control; IHH, immortalized human hepatocyte; sKD, single knockdown; TAG, triacylglycerol; tKD, triple knockdown; Y2H, yeast two-hybrid.
Fig. 2
Fig. 2
Total abundance of the GCKIII kinases is positively correlated with the hepatocellular lipid content. IHHs were transfected with different combinations of MST3, STK25, MST4 siRNA, and/or with MYC-MST3, FLAG-STK25, MYC-MST4 expression plasmids as indicated. Control cells were transfected with NTC siRNA and/or empty control plasmids. All cells were incubated with oleic and palmitic acid for 48 h posttransfection. A: Cell lysates were analyzed by Western blot using antibodies specific for MST3, STK25, or MST4. Protein levels were quantified by densitometry; representative Western blots are shown with GAPDH used as a loading control (quantifications are presented in supplemental Fig. S5). The average total GCKIII abundance for each set of the transfection combination is demonstrated at the bottom. B: Representative images of cells stained with Bodipy (green); nuclei stained with DAPI (blue). Quantification of the staining. The average lipid levels for each set of the transfection combination are demonstrated at the bottom. Scale bar: 50 μm. Data are mean ± SEM from 3 (A) or 8 (B) cell culture wells per group. aP < 0.05 versus control. IHH, immortalized human hepatocyte; Ctrl, control; KD, knockdown; OE, overexpression; NTC, nontargeting control; tKD, triple knockdown; NTC, nontargeting control; DAPI, 4',6-diamidino-2-phenylindole.
Fig. 3
Fig. 3
MST3, STK25, and MST4 interact with PDCD10, which regulates the hepatocellular lipid storage by controlling the stability of the GCKIII kinases. A: Venn diagram showing the number of shared and unique interaction partners of the GCKIII kinases detected by ULTImate Y2H screen of a primary human hepatocyte cDNA library. For (B-H), IHHs were transfected with different combinations of MST3, STK25, MST4, PDCD10 siRNA, and/or with MYC-MST3, FLAG-STK25, MYC-MST4, and MYC-PDCD10 expression plasmids as indicated. Control cells were transfected with NTC siRNA and/or empty control plasmids. All cells were incubated with oleic and palmitic acid for 48 h posttransfection. (B, D, and F) Cell lysates were analyzed by Western blot using antibodies specific for MST3, STK25, MST4, or PDCD10. Protein levels were quantified by densitometry; representative Western blots are shown with GAPDH used as a loading control. C: Schematic illustration of the impact of PDCD10 or GCKIII knockdown on protein stability. (E and G) Representative images of cells stained with Bodipy (green); nuclei stained with DAPI (blue). Quantification of the staining. Scale bar: 50 μm. (H) Schematic illustration of the impact of modifying PDCD10 and/or GCKIII abundance on hepatocellular lipid accumulation. Data are mean ± SEM from 4 (B, D, and F) or 8–12 (E and G) cell culture wells per group. For (B and D–G), representative results from 2 to 3 independent experiments are shown. aP < 0.05 versus control. DAPI, 4',6-diamidino-2-phenylindole; Ctrl, control; IHH, immortalized human hepatocyte; KD, knockdown; OE, overexpression; NTC, nontargeting control; tKD, triple knockdown; tOE, triple overexpression; Y2H, yeast two-hybrid.
Fig. 4
Fig. 4
MAP4K4 controls hepatocellular lipid accumulation via activation of the GCKIII kinases. IHHs were transfected with different combinations of MST3, STK25, MST4, MAP4K4 siRNA, and/or with MYC-MST3, FLAG-STK25, MYC-MST4, and MYC-MAP4K4 expression plasmids as indicated. Control cells were transfected with NTC siRNA and/or empty control plasmids. All cells were incubated with oleic and palmitic acid for 48 h posttransfection. (A and C) Cell lysates were analyzed by Western blot using antibodies specific for MST3, STK25, MST4, or MAP4K4. Protein levels were quantified by densitometry; representative Western blots are shown with GAPDH used as a loading control. (B and D) Representative images of cells stained with Bodipy (green); nuclei stained with DAPI (blue). Quantification of the staining. Scale bar: 30 μm. E: Cell lysates were immunoprecipitated with Dynabeads Protein G magnetic beads and subjected to Western blot using antibodies specific for MST3, STK25, MST4, MAP4K4, or phospho-MST3/-STK25/-MST4 (Thr174/178). Protein levels were quantified by densitometry; representative Western blots are shown with GAPDH used as a loading control. F: Schematic illustration of the role of MAP4K4 in GCKIII-mediated lipid accumulation within hepatocytes. For (E), representative results from 2 independent experiments are shown. Data are mean ± SEM from 3-6 (A, C, and E) or 8 (B and D) cell culture wells per group. aP < 0.05 versus control. Ctrl, control; DAPI, 4',6-diamidino-2-phenylindole; IP, immunoprecipitation; IHH, immortalized human hepatocyte; KD, knockdown; OE, overexpression; NTC, nontargeting control.
Fig. 5
Fig. 5
HSD17B11 mediates the lipotoxicity-modifying activity of the GCKIII kinases via a conformational change. IHHs were transfected with different combinations of MST3, STK25, MST4, HSD17B11 siRNA, and/or with MYC-MST3, FLAG-STK25, MYC-MST4, MYC-HSD17B11 expression plasmids as indicated. Control cells were transfected with NTC siRNA and/or empty control plasmids. All cells were incubated with oleic and palmitic acid for 48 h posttransfection. A-C: Representative images of cells stained with Bodipy (green); nuclei stained with DAPI (blue). Quantification of the staining. Scale bar: 25 μm. D: Lipidomic analysis by ultrahigh performance LC-MS. The abundance of the individual molecular lipid species is presented in supplemental Table S6. E: Representative images of cells stained with Bodipy (green) and processed for immunofluorescence with anti-MST3, anti-STK25, or anti-MST4 antibodies (violet); merged image shows colocalization in white with nuclei stained with DAPI (blue). Scale bar: 10 μm. F: Cell lysates were analyzed by native gel electrophoresis followed by immunoblotting using antibodies specific for MST3, STK25, or MST4. G: Schematic illustration of the role of HSD17B11 in GCKIII-mediated lipotoxicity. Data are mean ± SEM from 8 cell culture wells per group. For (A-B, and F), representative results from 2 independent experiments are shown. aP < 0.05 versus control. Ctrl, control; DAPI, 4',6-diamidino-2-phenylindole; IHH, Immortalized human hepatocyte; KD, knockdown; OE, overexpression; NTC, nontargeting control; tKD, triple knockdown; WB, Western blot.
Fig. 6
Fig. 6
Substrate profiling of the GCKIII kinases identifies targets linked to MASLD susceptibility. A: Schematic illustration of the experimental design. B-D: Scatter plots of the log-transformed signal intensity and significance of differentially enriched phosphopeptides. Initial data were filtered using a signal intensity threshold of 300 (vertical dashed lines), and statistically significant phosphorylation events were identified using FDR correction with a 0.01 threshold (horizontal dashed lines). Previously known substrates for each kinase are indicated in the graphs. Bar graphs show the total number of differentially phosphorylated unique peptides and proteins. E: Heat map of the scaled abundance of significantly changed phosphoproteins integrated with genome-scale metabolic model Human1 (63). The known functions of the substrates are denoted on the left. Stars indicate substrates that were detected in the screens for all three kinases. F: Venn diagram showing the number of shared and unique targets of MST3, STK25, and MST4 in the subset of significantly changed phosphoproteins integrated with genome-scale metabolic model Human1. G: Consensus sequences of the subset of significantly changed phosphoproteins integrated with genome-scale metabolic model Human1 detected in the screens for all three kinases, using the WebLogo application (64). The residue position in relation to the phosphorylation site is shown on the x-axis and the information content is shown on the y-axis. Polar amino acids (G, S, T, Y, and C) are shown in green, neutral amino acids (Q and N) are shown in purple, basic amino acids (K, R, and H) are shown in blue, acidic amino acids (D and E) are shown in red, and hydrophobic amino acids (A, V, L, I, P, W, F, and M) are shown in black. aa, amino acids; FDR, false discovery rate; GU, glucose uptake; MASLD, metabolic dysfunction–associated steatotic liver disease; Ubiq., ubiquitination.

Similar articles

Cited by

References

    1. Rinella M.E., Lazarus J.V., Ratziu V., Francque S.M., Sanyal A.J., Kanwal F., et al. A multisociety Delphi consensus statement on new fatty liver disease nomenclature. J. Hepatol. 2023;79:1542–1556. - PubMed
    1. Younossi Z.M., Golabi P., Paik J.M., Henry A., Van Dongen C., Henry L. The global epidemiology of nonalcoholic fatty liver disease (NAFLD) and nonalcoholic steatohepatitis (NASH): a systematic review. Hepatology. 2023;77:1335–1347. - PMC - PubMed
    1. Sheka A.C., Adeyi O., Thompson J., Hameed B., Crawford P.A., Ikramuddin S. Nonalcoholic steatohepatitis: a review. JAMA. 2020;323:1175–1183. - PubMed
    1. Yahoo N., Dudek M., Knolle P., Heikenwalder M. Role of immune responses in the development of NAFLD-associated liver cancer and prospects for therapeutic modulation. J. Hepatol. 2023;79:538–551. - PubMed
    1. Wong V.W., Ekstedt M., Wong G.L., Hagstrom H. Changing epidemiology, global trends and implications for outcomes of NAFLD. J. Hepatol. 2023;79:842–852. - PubMed

MeSH terms

Substances

LinkOut - more resources