. 2024 Nov;300(11):107880.
doi: 10.1016/j.jbc.2024.107880. Epub 2024 Oct 11.

CDK-dependent phosphorylation regulates PNKP function in DNA replication

Affiliations

CDK-dependent phosphorylation regulates PNKP function in DNA replication

Fatemeh Mashayekhi et al. J Biol Chem. 2024 Nov.

Abstract

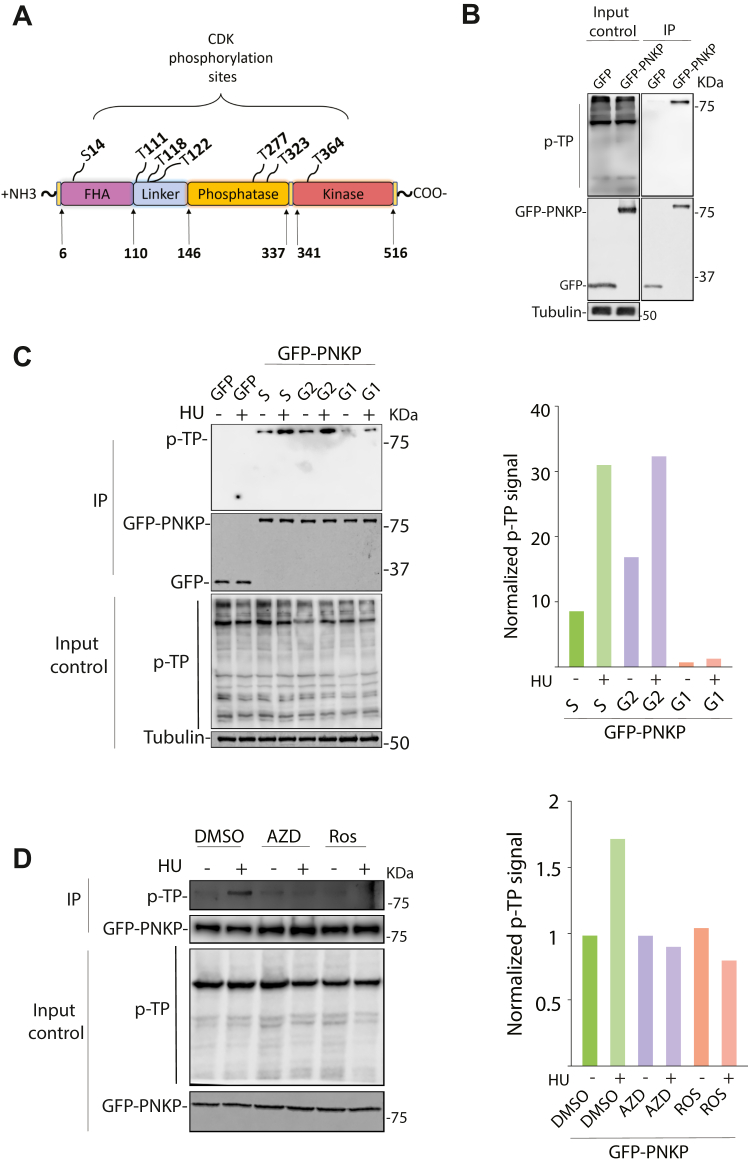
Okazaki fragment maturation (OFM) stands as a pivotal DNA metabolic process, crucial for genome integrity and cell viability. Dysregulation of OFM leads to DNA single-strand breaks-accumulation, which is linked to various human diseases such as cancer and neurodegenerative disorders. Recent studies have implicated LIG3-XRCC1 acting in an alternative OFM pathway to the canonical FEN1-LIG1 pathway. Here, we reveal that polynucleotide kinase-phosphatase (PNKP) is another key participant in DNA replication, akin to LIG3-XRCC1. Through functional experiments, we demonstrate PNKP's enrichment at DNA replication forks and its association with PCNA, indicating its involvement in DNA replication processes. Cellular depletion of PNKP mirrors defects observed in OFM-related proteins, highlighting its significance in replication fork dynamics. Additionally, we identify PNKP as a substrate for cyclin-dependent kinase 1 and 2 (CDK1/2), which phosphorylates PNKP at multiple residues. Mutation analysis of these phosphorylation sites underscores the importance of CDK-mediated PNKP phosphorylation in DNA replication. Our findings collectively indicate a novel role for PNKP in facilitating Okazaki fragments joining, thus shedding light on its contribution to genome stability maintenance.

Keywords: CDKs; DNA replication; FEN1; Okazaki fragments; PNKP; genome instability.


Conflict of interest statement

Conflict of interest The authors declare that they have no conflicts of interest with the contents of this article.

Figures

Figure 1
Figure 1
PNKP is at the RF and associates with newly synthesized DNA and PCNA.A, (Top) schematic of the iPOND labelling protocol. (Bottom) HEK293T cells were labelled with EdU for 10 min prior to performing the iPOND protocol. The EdU-containing medium was removed, and cells were washed once before incubating for 60 min in a medium containing 10 μM thymidine (chase) before performing iPOND. iPOND eluates were immunoblotted using PNKP, PCNA, tubulin and histone H2A antibodies. No-click control indicates that the sample was processed with no biotin-azide. B, localization of GFP-PNKP with PCNA. Representative images are shown (top), and quantifications of the percentage of GFP-PNKP foci colocalizing with PCNA are shown (bottom). More than 70 cells in each condition were analyzed. The graph represents the data from two independent replicates. Arrowheads mark PNKP foci colocalizing with PCNA in S phase cells. C, PLA assay with U2OS cells shows the interaction between PCNA and PNKP. U2OS cells were transfected with either GFP or GFP-PNKP plasmids 24 h before the experiment. Antibodies against GFP and PCNA were used. No antibody was used for the negative control (no Ab). Three independent experiments were performed, and more than 30 cells were analyzed in each experiment. The graph represents the data from three independent replicates. For quantifications, two-tailed, unpaired, non-parametric student’s t-tests were performed in Prism to determine statistical significance. The median values are marked on the graph. Asterisks depict statistically significant differences: ∗∗∗∗ (p < 0.0001). D, pull down experiment with purified His-PNKP and PCNA. Bovine serum albumin (BSA) was used as a negative control. n = 2 independent experiments were performed, and representative blots are shown. E, 1 μg purified proteins used in (D) were run on a 10% polyacrylamide gel and stained with Coomassie blue to confirm their purity. The scale bar is 10 μm.
Figure 2
Figure 2
Increased nascent DNA tract length in PNKP KO cells.A, DNA fiber experiments showing faster replication fork progression in HCT116 PNKP KO cells compared to wild-type (WT) (left) and in U2OS cells transfected with siRNA against PNKP (siPNKP) compared to control siRNA (siCTR) (right) under unperturbed conditions. The quantification of the CldU tract length is presented, with the median values marked on the graph. Between 100 to 300 fibers were measured per condition. The graph is representative of pulled data from at least three independent experiments. Asterisks indicate statistical significance (Mann–Whitney test, two-sided): ∗∗∗∗ (p < 0.0001). A schematic representation of the assay conditions is presented at the top of each graph. Immunoblot showing the expression levels of PNKP is shown below. Tubulin serves as a loading control. B, Schematic depiction of the GFP-tagged PNKP deletion mutants used in C. C, DNA fibre experiments using PNKP KO2 cells reconstituted with PNKP WT or PNKP deletion mutants shown in (B). The quantification of the ldU tract length is presented, with the median values marked on the graph. Between 140 to 400 fibres were measured per condition. The graph is representative of pulled data from three independent experiments. Asterisks indicate statistical significance (Mann–Whitney test, two-sided): ∗∗ (p < 0.01), ∗∗∗∗ (p < 0.0001). A schematic representation of the assay conditions is presented at the top of the graph. Immunoblot showing the expression levels of each PNKP expression construct is shown below. Tubulin serves as a loading control. D, PNKP kinase assay. A 3′- FAM-labelled 18-nt DNA substrate bearing a 5′-OH terminus was incubated with either immunoprecipitated PNKP WT or PNKP mutants depicted in (B), in the presence of 0.2 mM ATP followed by gel electrophoresis analysis. Cells transfected with GFP construct (GFP) were used as a negative control. E, PNKP phosphatase assay. A 5′-FAM-labeled 18-nt DNA substrate with a 3′ phosphate group was incubated with either PNKP WT or PNKP mutants depicted in (B) before analyzing by gel electrophoresis. Cells transfected with the GFP construct (GFP) were used as a negative control.
Figure 3
Figure 3
Loss of PNKP results in the accumulation of OF-like DNA structures with 5′-OH termini.A, DNA fiber experiments using PNKP KO2 cells reconstituted with PNKP WT or PNKP point mutants lacking either phosphatase (ΔP), kinase (ΔK), or phosphatase and kinase (DD) activities. The quantification of the ldU tract length is presented, with the median values marked on the graph. At least 180 fibers were measured per condition. The graph is representative of pulled data from two independent experiments. Asterisks indicate statistical significance (Mann–Whitney test, two-sided): ns (non-significant), ∗∗∗∗ (p < 0.0001). A schematic representation of the assay conditions is presented at the top of the graph. Immunoblot showing the expression levels of each PNKP expression construct is shown below. Tubulin serves as a loading control. B, immunofluorescence experiment showing increased PAR chain formation (indicative of defective OFM) in PNKP KO1 cells reconstituted with different truncation mutants as in B. Cells were treated with a PARG inhibitor (PARGi) 10 μM, for 20 min before fixation to block PAR chain removal. Representative images of cells are shown on the left. Quantification of the PAR signal in PCNA positive cells is shown on the right. At least 200 cells were analysed for each condition. Similar results were obtained from two independent experiments. The median values are marked on the graph. The immunoblot experiment showing the expression levels of each PNKP expression construct is shown below. Tubulin serves as a loading control. To determine statistical significance, unpaired Student’s t-tests were performed in Prism. Asterisks depict statistically significant differences: ns (non-significant), ∗∗∗∗ (p < 0.0001). C, schematic representing the protocol applied in D to isolate OF-like DNA fragments and radio-label them with purified human PNKP and 32P-ATP. Briefly, nuclei were extracted and embedded in agarose gel prior to the lysis of the nuclear membrane to avoid DNA sheering. After removing RNA, the gel plugs were run on an alkaline agarose gel. DNA fragments smaller than 200mer were isolated from the gel, labeled with PNKP and 32P-ATP, and run on a denaturing urea gel. D, unchallenged HCT116 cells were treated with either CDK7 inhibitor (CDK7i) or FEN1 inhibitor (FEN1i). DMSO treatment was used as a control. Nuclear DNA was run on an alkaline gel and ≤200 nt DNA fragments were isolated and labeled with 32P-ATP by exogenous PNKP. The panels representing radiolabeled DNA fragments after electrophoresis on an 8% urea gel. E, the graph represents three independent replicates. The signal intensity of the whole smear was measured for each sample. The background signal was deducted from the signals of the samples, and the resultant values were subsequently normalized to those of the wild-type DMSO. Two-way ANOVA with Tukey’s multiple comparisons was performed in Prism. Asterisks depict statistically significant differences: ns (not significant), ∗∗ (p<<0.01), ∗∗∗ (p < 0.001). F, cells were treated with CDK7 inhibitor (CDK7i), or DMSO, for 80 min. At the last 10 min of CDK7i incubation, BrdU was added to label replicating DNA. The graph represents three independent experiments. Asterisks indicate statistical significance (Mann–Whitney test, two-sided): ∗∗∗∗ (p < 0.0001). The scale bar is 10 μm.
Figure 4
Figure 4
PNKP interacts with LIG3 and plays a role in the alternative OFM pathway.A, Immunofluorescence experiment showing increased S-phase specific PAR chain formation (indicative of defective OFM) in response to FEN1 inhibitor (FEN1i) in U2OS cells that were treated with either control siRNA (siCTR) or siRNA against PNKP (siPNKP) 48 h before the experiment. (Top) shows the representative images. (Bottom) shows the quantifications of PCNA-positive cells. Cells were treated with a 10 μM PARG inhibitor (PARGi) for 20 min before fixation to block PAR chain removal. At least 100 cells were analyzed for each condition. Similar results were obtained from two independent experiments. The median values are marked on the graph. B, PLA assay with U2OS cells shows the interaction between PCNA and endogenous PNKP. Indicated cells were treated with a FEN1i, and all cells were pulse-labeled with EdU to identify those in the S-phase. Only EdU-positive cells representing cells in the S-phase were quantified. PNKP alone antibody was used for the negative control. (Left) shows representative images. (Right) shows the quantifications. Two independent experiments were performed, and more than 130 cells were analyzed for each condition in each experiment. The graph represents the data from two independent replicates. C, DNA fiber with S1 nuclease treatment was performed using HCT116 WT (PNKP+) and PNKP KO (PNKP-) cells. Indicated cells were treated with 10 μM FEN1i and 20 U/ml S1 nuclease for an indicated amount of time. The quantification of the ldU tract length is presented, with the median values marked on the graph. At least 100 fibers were measured per condition. The graph is representative of two independent experiments. A schematic representation of the assay conditions is presented at the top of graph (D) similar to (A), except cells were treated with either siRNA PNKP (siPNKP), LIG3 (siLIG3), or both PNKP and LIG3 (siPNKP + siLIG3) 48 h before the experiment. E, similar to (B), except the interaction between PNKP and LIG3 was studied in both S-phase (EdU positive) and non-S-phase (EdU negative) cells. Three independent experiments were performed, and more than 100 cells were analyzed for each condition in each experiment. The graph represents the data from three independent replicates. F, SIRF assay was used to assess the recruitment of PNKP on nascent DNA. All cells were pulse-labeled with EdU. Only EdU-positive (S-phase) cells were quantified. Cells were treated with DMSO or 10 μM Olaparib. (Left) shows the representative images. (Right) shows the quantifications. Two independent experiments were performed, and more than 100 cells were analyzed for each condition in each experiment. The graph represents the data from two independent replicates. G, a colony formation assay was performed using U2OS cells that were transfected with either control siRNA (siControl) or with siRNA against PNKP (siPNKP) 48 h before the experiment. The FEN1 inhibitor (FEN1i) was added at the specified concentrations for 2 days. For all quantifications in this figure: Mann-Whitney Unpaired test was performed in Prism to determine statistical significance. Asterisks depict statistically significant differences: ns (non-significant), ∗ (p < 0.05), ∗∗ (p < 0.01), ∗∗∗ (p < 0.001), ∗∗∗∗ (p < 0.0001). The scale bar is 10 μm.
Figure 5
Figure 5
CDK1/2 mediates PNKP phosphorylation in cells.A, schematic depiction of PNKP amino acid sequences with the predicted CDK phosphorylation sites labelled. B, IP experiments using the GFP selector beads in HEK293T cells expressing either GFP or GFP-PNKP showed that PNKP is constitutively phosphorylated in vivo. IP extracts were immunoblotted using an anti-phosphorylated threonine antibody followed by a proline (p-TP) as indicated. C, effect of cell cycle on PNKP phosphorylation. HeLa cells expressing GFP or GFP-PNKP were synchronized by a double-thymidine block and released for different time points. Cells were either left untreated or treated with HU (2 mM, 2 h). (Left) Cell extracts were prepared as described in Materials and Methods and immunoblotted as indicated. (Right) quantification of the p-TP immunoreactive bands was carried out by Image Studio software and normalized to each sample’s GFP expression and plotted as indicated. D, IP experiments using the GFP selector beads on extracts isolated from cells expressing either GFP or GFP-PNKP that were either left untreated or treated with HU (2 mM, 2 h). 1 h before replication stress induction, cells were treated with DMSO, AZD5438 (AZD, 10 μM), or Roscovitine (ROS, 20 μM). Left, IP lysates were immunoblotted as indicated. Right, quantifications of the p-TP signal was obtained using Image Studio software and normalized to the GFP signal in each sample.
Figure 6
Figure 6
PNKP is phosphorylated by CDK on multiple sites within linker and phosphatase domains.A and B, schematic depictions of the GFP-tagged PNKP phosphorylation mutants used in C and D. C and D, IP experiments comparing the p-TP level in cells expressing different mutants of PNKP depicted in A and B. GFP selector IP lysates were immunoblotted as indicated. E and F, DNA fiber analysis was performed in PNKP KO2 cells expressing different PNKP mutants. Cells were labeled with IdU for 20 min and harvested. The quantification of the IdU tract length is presented, with the median values marked on the graph. Between 120 to 300 fibers were measured per condition. The graphs are representative of three independent experiments. Asterisks indicate statistical significance (Mann–Whitney test, two-sided): ns (non-significant), ∗∗∗∗ (p < 0.0001). A schematic representation of the assay conditions is presented at the top of each graph. Immunoblots showing the expression levels of each PNKP expression construct are shown below. Tubulin served as a loading control.
Figure 7
Figure 7
CDK-mediated phosphorylation of PNKP is essential for its function in OFM.A and B, PNKP kinase and phosphatase assays. PNKP mutants were expressed and isolated from HEK293 cells. (Pink bars, located on the left) PNKP kinase assays were performed to assess the kinase activity of phosphorylation mutants of PNKP. (Green bars, located on the right) PNKP phosphatase assays were conducted to study the effect of each phosphorylation mutant on PNKP’s phosphatase activity. C and D, PNKP phosphorylation is required for its function in OFM. Immunofluorescence experiment showing increased PAR chain formation in PNKP KO cells reconstituted with different PNKP phosphorylation mutants. Cells were treated with a PARG inhibitor (PARGi, 10 μM) for 20 min before harvesting to block PAR chain removal. Quantification of the PAR signal in PCNA foci-positive cells are shown as well as the expression levels of each PNKP phosphorylation mutant. Tubulin serves as a loading control. Between 50 to 150 cells were analyzed for each condition. Similar results were obtained from n = 2 independent experiments. The median values are marked on the graph. To determine statistical significance, unpaired Student’s t-tests were performed in Prism. Asterisks depict statistically significant differences: ns (non-significant), ∗∗∗∗ (p < 0.0001). E, immunofluorescence experiment showing increased PAR chain formation in PNKP KO cells reconstituted with T323M PNKP phosphorylation mutant. Cells were treated with a PARG inhibitor (PARGi, 10 μM) for 20 min before fixation to block PAR chain removal. Quantifications of the PAR signal in PCNA-positive cells are shown. Similar results were obtained from n = 2 independent experiments. The median values are marked on the graph. The immunoblot experiment showing the expression levels of each PNKP expression construct is shown below. Tubulin served as a loading control. To determine statistical significance, unpaired Student’s t-tests were performed in Prism. Asterisks depict statistically significant differences: ∗∗∗∗ (p < 0.0001). F, DNA fibre analysis was performed in PNKP KO cells expressing PNKP T323M phosphorylation mutant. Cells were labelled with IdU for 20 min and harvested. The quantification of the IdU tract length is presented, with the median values marked on the graph. Between 100 to 300 fibres were measured per condition. The graph is representative of pulled data from three independent experiments. Asterisks indicate statistical significance (Mann–Whitney test, two-sided): ∗∗∗∗ (p < 0.0001). A schematic representation of the assay conditions is presented at the top of the graph. Immunoblot showing the expression levels of each PNKP expression construct is shown below. Tubulin serves as a loading control. The scale bar is 10 μm.

References

    1. Costa A., Diffley J.F.X. The initiation of eukaryotic DNA replication. Annu. Rev. Biochem. 2022;91:107–131. - PubMed
    1. Masai H., Matsumoto S., You Z., Yoshizawa-Sugata N., Oda M. Eukaryotic chromosome DNA replication: where, when, and how? Annu. Rev. Biochem. 2010;79:89–130. - PubMed
    1. Burgers P.M.J., Kunkel T.A. Eukaryotic DNA replication fork. Annu. Rev. Biochem. 2017;86:417–438. - PMC - PubMed
    1. Blow J.J., Laskey R.A. A role for the nuclear envelope in controlling DNA replication within the cell cycle. Nature. 1988;332:546–548. - PubMed
    1. Blow J.J., Dutta A. Preventing re-replication of chromosomal DNA. Nat. Rev. Mol. Cell Biol. 2005;6:476–486. - PMC - PubMed

Publication types

MeSH terms

LinkOut - more resources