. 2024 Oct 12;12(10):e009720.
doi: 10.1136/jitc-2024-009720.

Cancer-associated foam cells hamper protective T cell immunity and favor tumor progression in human colon carcinogenesis

Affiliations

Cancer-associated foam cells hamper protective T cell immunity and favor tumor progression in human colon carcinogenesis

Elena Daveri et al. J Immunother Cancer. .

Abstract

Background: Colorectal cancer (CRC) remains a significant healthcare burden worldwide, characterized by a complex interplay between obesity and chronic inflammation. While the relationship between CRC, obesity and altered lipid metabolism is not fully understood, there are evidences suggesting a link between them. In this study, we hypothesized that dysregulated lipid metabolism contributes to local accumulation of foam cells (FC) in CRC, which in turn disrupts antitumor immunosurveillance.

Methods: Tumor infiltrating FC and CD8+ were quantified by digital pathology in patients affected by T2-T4 CRC with any N stage undergoing radical upfront surgery (n=65) and correlated with patients' clinical outcomes. Multiparametric high-resolution flow cytometry analysis and bulk RNAseq of CRC tissue were conducted to evaluate the phenotype and transcriptomic program of immune cell infiltrate in relation to FC accumulation. The immunosuppressive effects of FC and mechanistic studies on FC-associated transforming growth factor-beta (TGF-β) and anti-PD-L1 inhibition were explored using an in-vitro human model of lipid-engulfed macrophages.

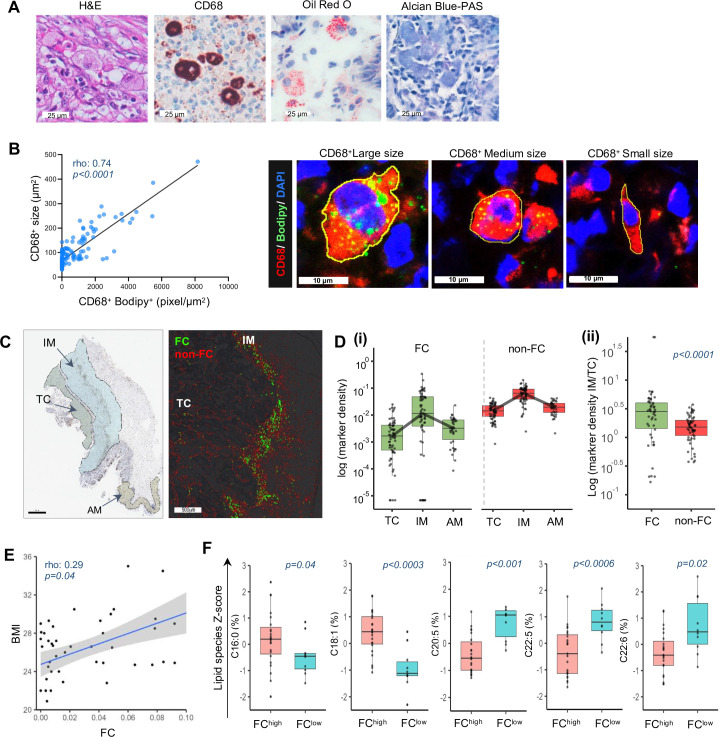
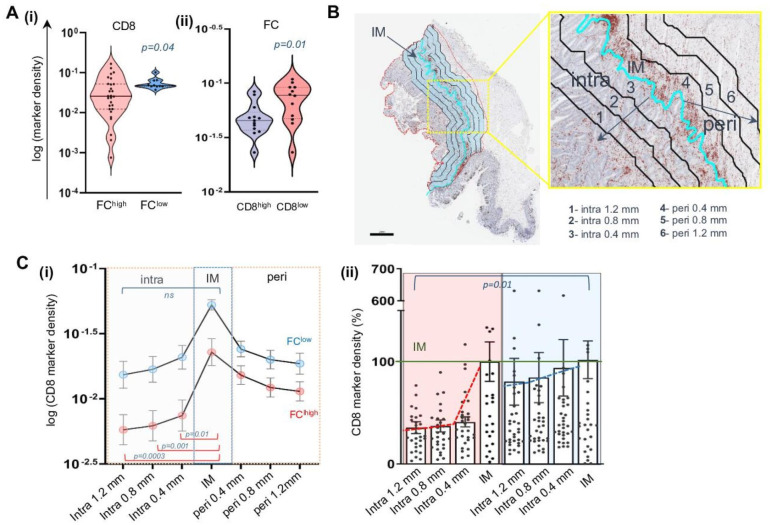
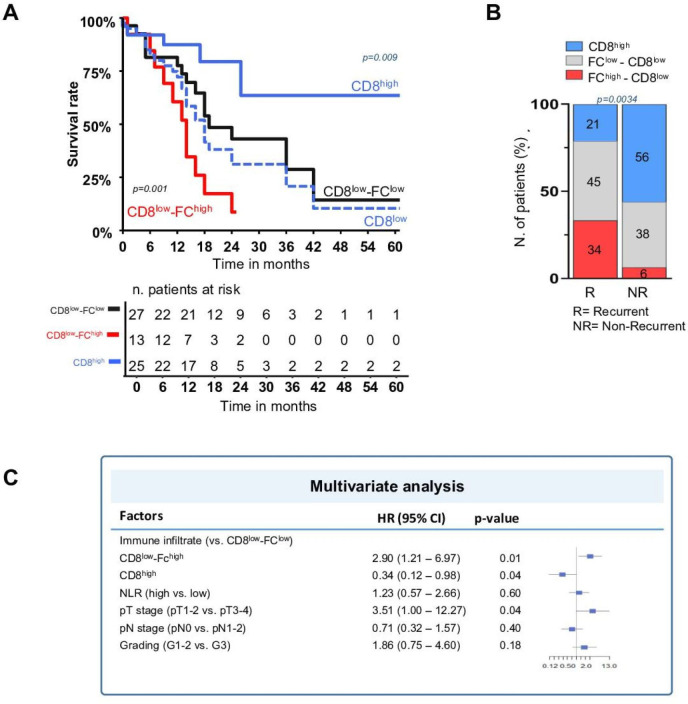
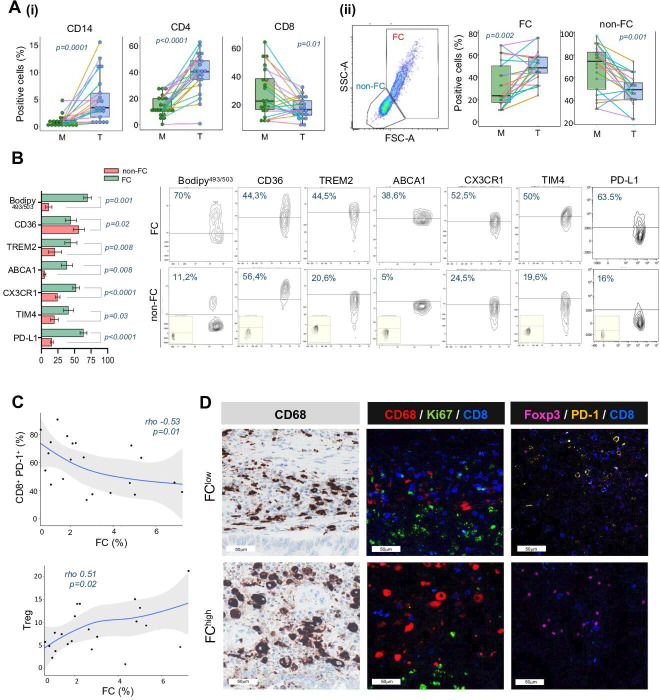
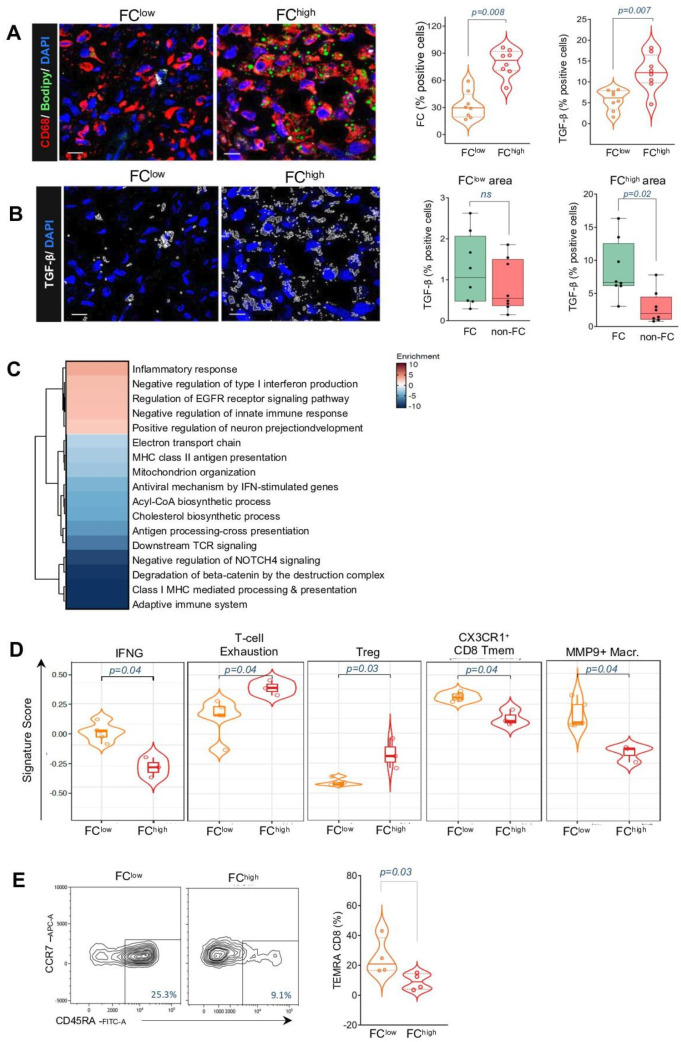
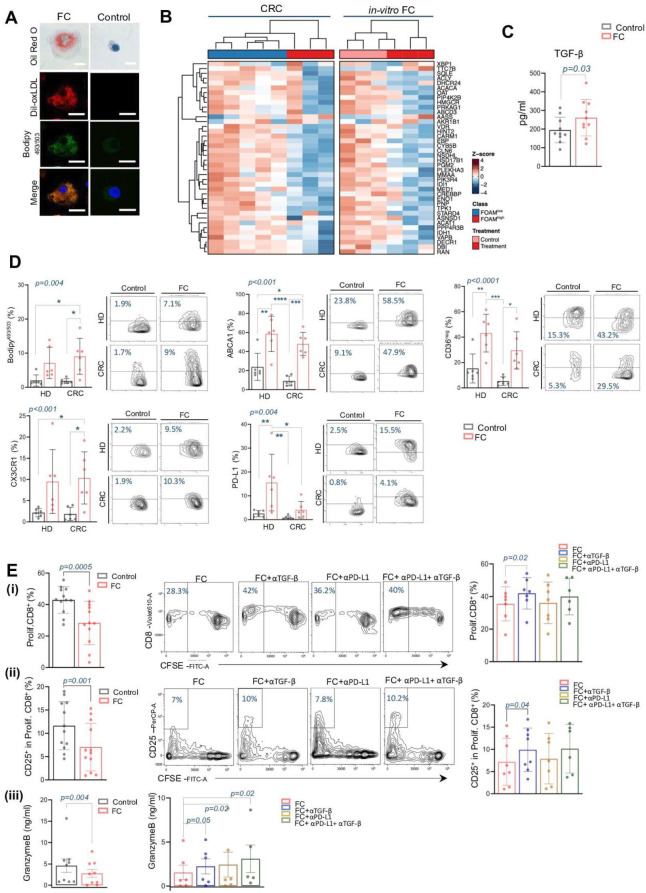
Results: FC (large CD68+ Bodipy+ macrophages) accumulated at the tumor margin in CRC samples. FChigh tumors exhibited reduced CD8+ T cells and increased regulatory T cells (Tregs). Functional transcriptional profiling depicted an immunosuppressed milieu characterized by reduced interferon gamma, memory CD8+ T cells, and activated macrophages mirrored by increased T-cell exhaustion and Treg enrichment. Furthermore, FChigh tumor phenotype was independent of standard clinical factors but correlated with high body mass index (BMI) and plasma saturated fatty acid levels. In CD8low tumors, the FChigh phenotype was associated with a 3-year disease-free survival rate of 8.6% compared with 28.7% of FClow (p=0.001). In-vitro studies demonstrated that FC significantly impact on CD8 proliferation in TFG-β dependent manner, while inhibition of TGF-β FC-related factors restored antitumor immunity.

Conclusions: FC exert immunosuppressive activity through a TGF-β-related pathway, resulting in a CD8-excluded microenvironment and identifying immunosuppressed tumors with worse prognosis in patients with primary CRC. FC association with patient BMI and dyslipidemia might explain the link of CRC with obesity, and offers novel therapeutic and preventive perspectives in this specific clinical setting.

Keywords: Colorectal Cancer; Immunosuppression; Macrophage; Tumor microenvironment - TME.


Conflict of interest statement

Competing interests: None declared.

Figures

Figure 1
Figure 1. Spatial distribution of cancer-associated foam cells (FC) in primary colorectal cancer (CRC). Representative images for H&E, CD68-, oil red O-, and Alcian blue PAS-stained sections in stage I–III CRC; (B) correlation plot of Bodipy493/503 and cell size in tumor associated CD68+ cells and relative confocal images (n=150 cells). (C) Representative images of FC and non-FC distribution across different tumor localization. Boxplots of (D(i)) FC (green) and non-FC (red) distribution across tumor core (TC), invasive margin (IM) and adjacent mucosa (AM), quantified by MiaQuant digital pathology, and (D(ii)) the IM/TC ratio of FC and non-FC. Values are expressed as logarithm of marker densities; (E) correlation between FC tissue accumulation and patient’s body mass index (BMI); (F) boxplot of plasma lipid profile along FChigh and FClow CRC obtained by K-means clustering methods. P values are determined by two-tailed Mann Whitney U-test.
Figure 2
Figure 2. CD8 spatial distribution with respect to foam cells (FC) presence. (A) Violin plot displaying (A(i)) CD8 and (A(ii)) FC accumulation with respect to FC and CD8 quantification, respectively; (B) representative image of the regions of interest segmented in the whole slide colorectal cancer (CRC) tissue section within 1.2 mm intra- and peri-tumoral to the invasive margin (IM); (C(i)) curves representing spatial distribution of CD8 T infiltrate in FChigh and FClow; (C(ii)) CD8 T infiltrate in the different intracellular localizations was expressed in % with respect of total CD8 at IM, accounted as 100%. Statistic by two-tailed Mann Whitney U-test (and two-way analysis of variance.
Figure 3
Figure 3. Foam cells (FC) quantification identifies a subset of poorly immunogenic colorectal cancer with worse disease outcome. (A) Kaplan-Meier curves and number of patients at risk for disease-free survival (DFS) with CD8high, CD8low, FClow CD8low, and FChigh CD8low. Log-rank p values from Mantel-Cox test are indicated; (B) stacked graph representing % of patients with recurrent (R) and non-recurrent (NR) disease according to the type of immune infiltrate at the invasive margin. χ2 test for statistic; (C) multivariate analysis and forest plot of clinical and immune infiltrate profile associated with DFS. P values are determined by Cox proportional regression model.
Figure 4
Figure 4. Stage I–III colorectal cancer immunoprofile in relation to the presence of FChigh and FClow infiltrate. Frequency of (A(i)) CD14+, CD8+, and CD4+ T cells in tumor (T) and distant unaffected mucosa (M), and (A(ii)) representative flow cytometry plots showing physical parameters (forward and side scatter-area, FSC-A and SSC-A) of non-foam cells (FC) and FC CD14+ with boxplots relative to their distribution in T and M; (B) histograms and dotplots of the % of positive cells for the indicated markers among FC and non-FC in tumor sample; p values are determined by Wilcoxon signed-rank test (n=21); (C) regression plots between infiltration FC and activated subsets (PD1+CD8+) or regulatory T cells (Tregs) (CD4+CD25hiCD127) in tumors. P value and r coefficient are determined by Spearman correlation; (D) representative images of CD68-immunostained FChigh and FClow CRC and confocal microscopy of CD68, Ki67, CD8 (red, green, and blue, respectively) and Foxp3, PD-1, CD8 (pink, yellow, and blue, respectively) matrix panels.
Figure 5
Figure 5. Foam cells (FC) alter T-cell functional program at local levels of colorectal cancer (CRC). (A) Representative images of (A) CD68 (red) and Bodipy493/503 (green), and (B) transforming growth factor-beta (TGF-β) (white) staining of FChigh and FClow regions of CRC tissue and relative boxplots of marker expression; DAPI (blue) was used for the nuclei; (C) heatmap of the significant enrichment annotations of coherent DE genes between FChigh versus FClow CRC of our study and those of micro-dissected FC-enriched CRC from Luca et al study; (D) immune-associated signature score in FChigh versus FClow CRC. (E) %positive terminal effector cells (TEMRA) in FChigh and FClow CRC. P values are calculated by Wilcoxon and Mann-Whitney test for dependent and independent observations, respectively; ns, not significant.
Figure 6
Figure 6. Induced lipid-engulfed macrophages resemble tissue foam cells (FC) and reconstitute T cell dysfunctions. (A) Representative confocal image of the generated human FC model; (B) heatmap and z-score of gene enriched for metabolism of lipids in coherently differentially expressed genes between in vitro-generated FC and in vivo setting. (C) Transforming growth factor-beta (TGF-β) secretion in in-vitro derived FC compared with non-engulfed early macrophages (control); p value determined by Wilcoxon test. (D) Boxplots and representative dot plots with the mean values of the % of positive cells for the indicated markers in in vitro derived FC compared with controls in healthy donor (HD) and patients with colorectal cancer (CRC) (n=6). P values determined by two-way analysis of variance and Tukey’s multiple comparison; (E) boxplots of the (i) proliferating and (ii) activated CD25+ CD8+ subsets, as well as, (iii) Granzyme B concentration in supernatants of control:T-cells and FC:T-cells cocultures at ratio 1:1 after 5 days of cocultures. The proliferation detected by CSFE dye dilution, activated CD25+ subset and Granzyme B concentration were assed with or without prior FC pretreatment with or without single or simultaneously anti-TGF-β1,2,3 and anti-PD-L1 mAbs. Statistic was determined by Friedman test; showed p value referred to Dunn’s post-hoc test (n=6–12).

References

    1. Sung H, Ferlay J, Siegel RL, et al. Global Cancer Statistics 2020: GLOBOCAN Estimates of Incidence and Mortality Worldwide for 36 Cancers in 185 Countries. CA Cancer J Clin. 2021;71:209–49. doi: 10.3322/caac.21660. - DOI - PubMed
    1. Li H, Boakye D, Chen X, et al. Association of Body Mass Index With Risk of Early-Onset Colorectal Cancer: Systematic Review and Meta-Analysis. Am J Gastroenterol. 2021;116:2173–83. doi: 10.14309/ajg.0000000000001393. - DOI - PMC - PubMed
    1. Fernández LP, Gómez de Cedrón M, Ramírez de Molina A. Alterations of Lipid Metabolism in Cancer: Implications in Prognosis and Treatment. Front Oncol. 2020;10:577420. doi: 10.3389/fonc.2020.577420. - DOI - PMC - PubMed
    1. Pagès F, Mlecnik B, Marliot F, et al. International validation of the consensus Immunoscore for the classification of colon cancer: a prognostic and accuracy study. Lancet. 2018;391:2128–39. doi: 10.1016/S0140-6736(18)30789-X. - DOI - PubMed
    1. Sillo TO, Beggs AD, Morton DG, et al. Mechanisms of immunogenicity in colorectal cancer. Br J Surg. 2019;106:1283–97. doi: 10.1002/bjs.11204. - DOI - PMC - PubMed