

Probabilistic bias analysis for exposure misclassification of household income by neighbourhood in a cohort of individuals with colorectal cancer
- PMID: 39396253
- PMCID: PMC11471264
- DOI: 10.1093/ije/dyae135
Probabilistic bias analysis for exposure misclassification of household income by neighbourhood in a cohort of individuals with colorectal cancer
Abstract
Introduction: Despite poor agreement, neighbourhood income is used as a proxy for household income, due to a lack of data availability. We quantified misclassification between household and neighbourhood income and demonstrate quantitative bias analysis (QBA) in scenarios where only neighbourhood income is available in assessing income inequalities on colorectal cancer mortality.
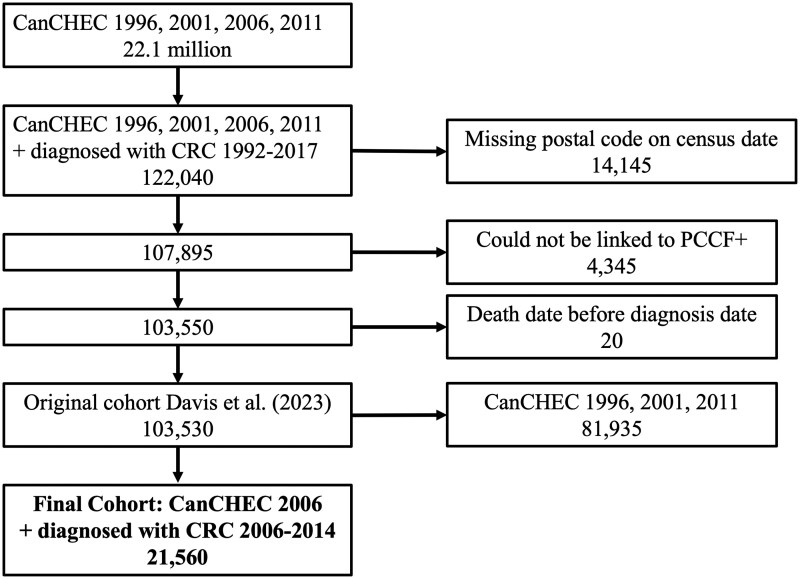
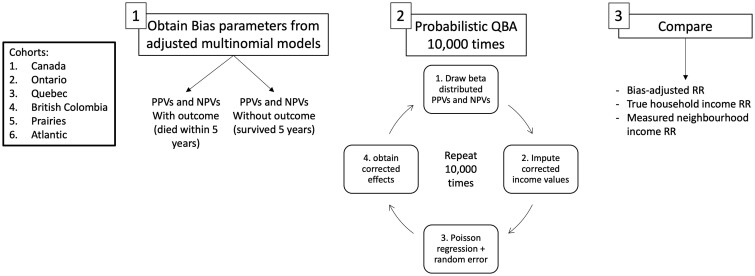
Methods: This was a retrospective study of adults with colorectal cancer diagnosed 2006-14 from Statistics Canada's Canadian Census Health and Environment Cohort. Neighbourhood income quintiles from Statistics Canada were used. Census household income quintiles were used to determine bias parameters and confirm results of the QBA. We calculated positive and negative predictive values using multinomial models, adjusting for age, sex and rural residence. Probabilistic QBA was conducted to explore the implication of exposure misclassification when estimating the effect of income on 5-year mortality.
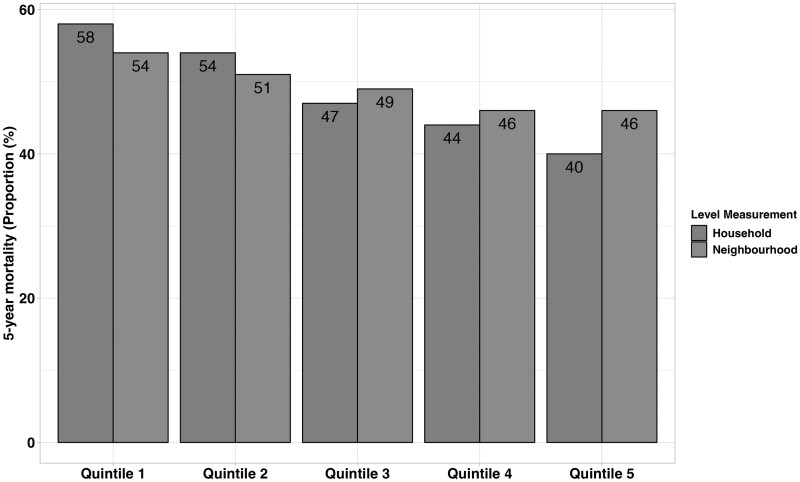
Results: We found poor agreement between neighbourhood and household income: positive predictive values ranged from 21% to 37%. The bias-adjusted risk of neighbourhood income on 5-year mortality was similar to the risk of mortality by household income. The bias-adjusted relative risk of the lowest income quintile compared with the highest was 1.42 [95% simulation interval (SI) 1.32-1.53] compared with 1.46 [95% confidence interval (CI) 1.39-1.54] for household income and 1.18 (95% CI 1.12-1.24) for neighbourhood income.
Conclusion: QBA can be used to estimate adjusted effects of neighbourhood income on mortality which represent household income. The predictive values from our study can be applied to similar cohorts with only neighbourhood income to estimate the effects of household income on cancer mortality.
Keywords: Area-level income; cancer; colorectal cancer; exposure misclassification; household income; income inequalities; individual income; neighbourhood income; quantitative bias analysis.
© The Author(s) 2024. Published by Oxford University Press on behalf of the International Epidemiological Association.
Conflict of interest statement
None declared.
Figures

References
-
- Marmot MG. Understanding social inequalities in health. Perspect Biol Med 2003;46:S9–23. - PubMed
MeSH terms
Grants and funding
LinkOut - more resources
Full Text Sources
Medical
