. 2024 Dec;13(32):e2402973.
doi: 10.1002/adhm.202402973. Epub 2024 Oct 13.

Targeting Hypoxia and Autophagy Inhibition via Delivering Sonodynamic Nanoparticles With HIF-2α Inhibitor for Enhancing Immunotherapy in Renal Cell Carcinoma

Affiliations

Targeting Hypoxia and Autophagy Inhibition via Delivering Sonodynamic Nanoparticles With HIF-2α Inhibitor for Enhancing Immunotherapy in Renal Cell Carcinoma

Yihao Zhu et al. Adv Healthc Mater. 2024 Dec.

Abstract

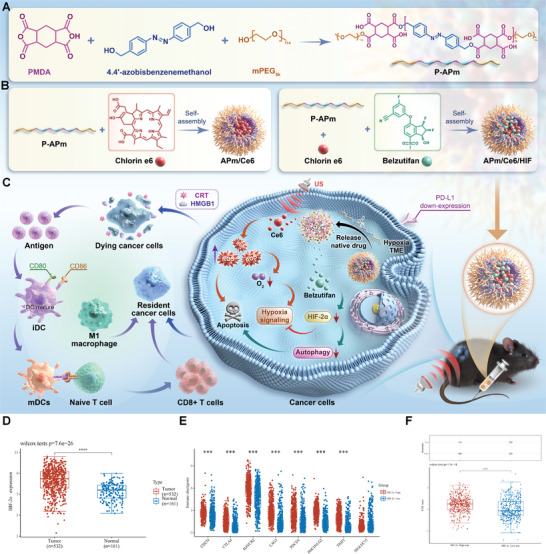
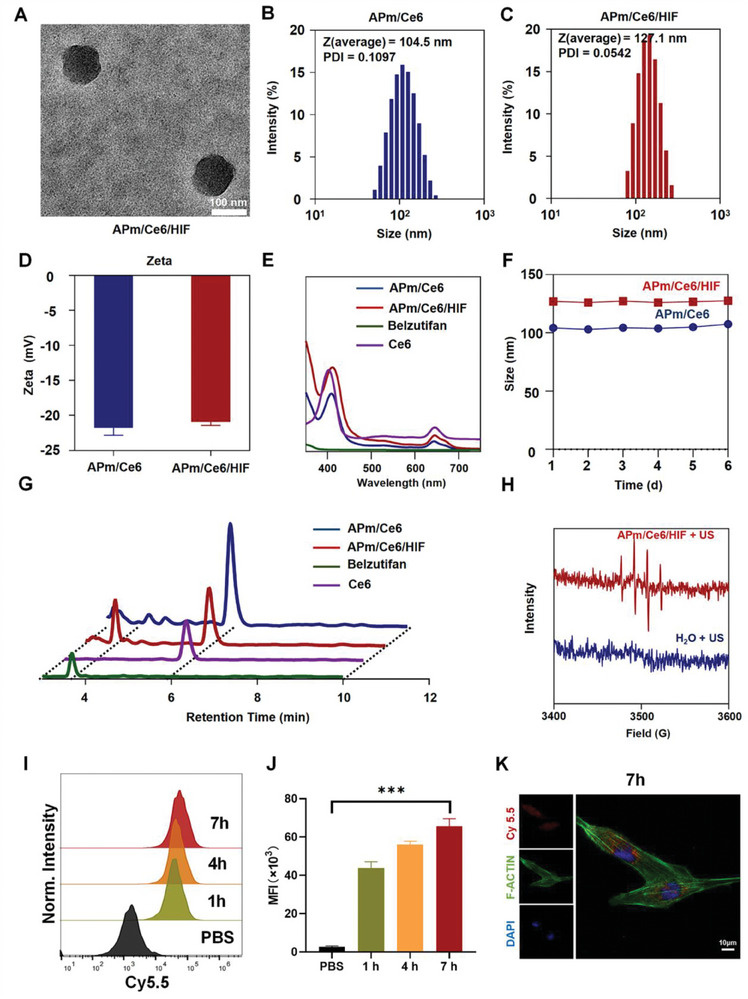
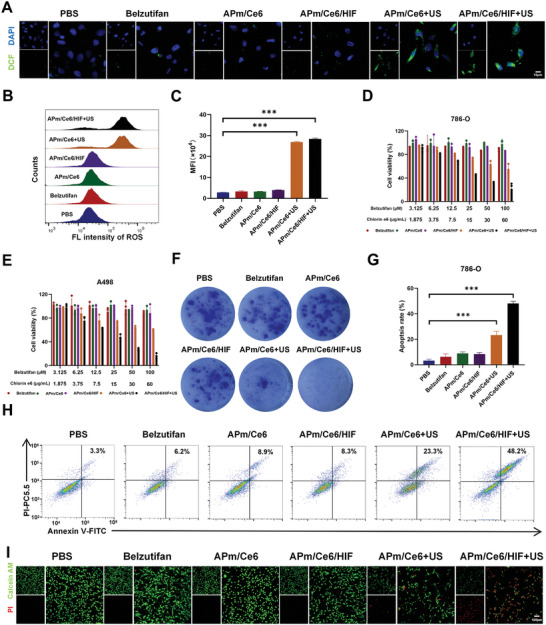
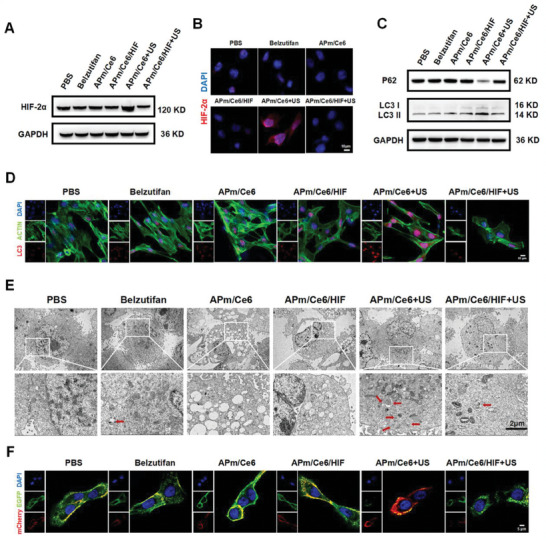
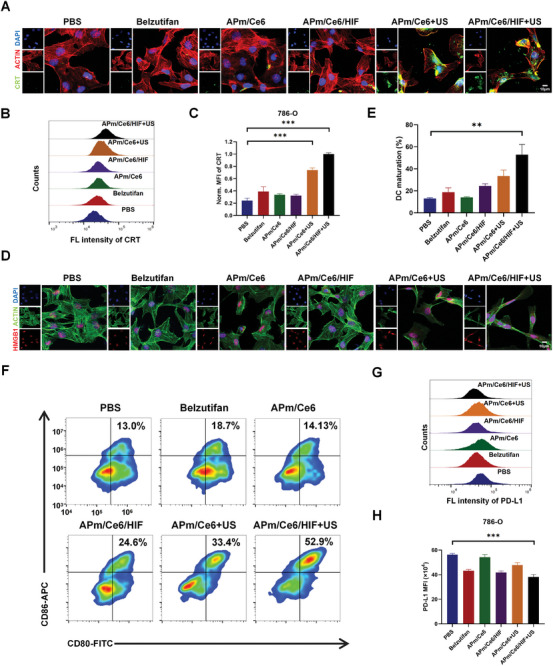
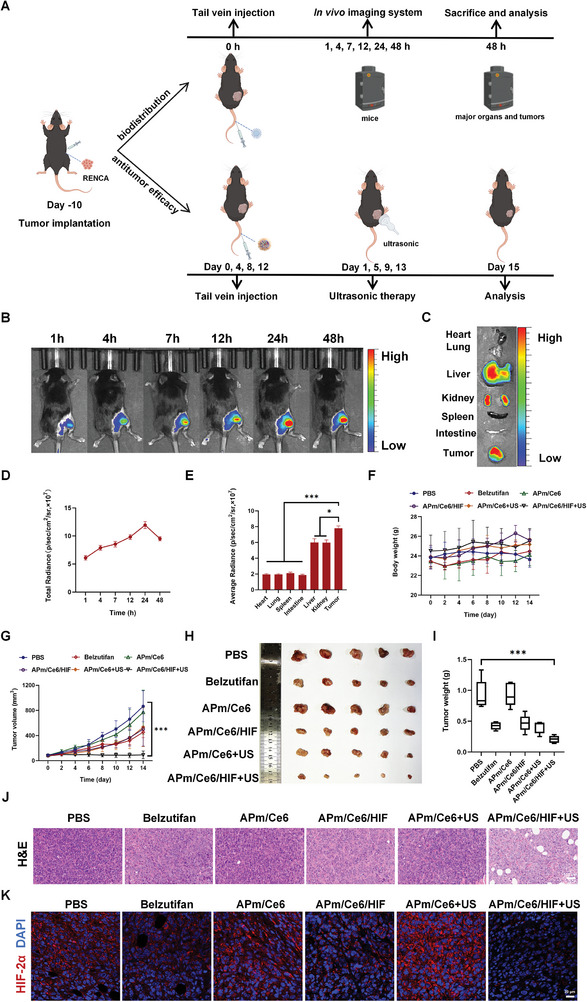
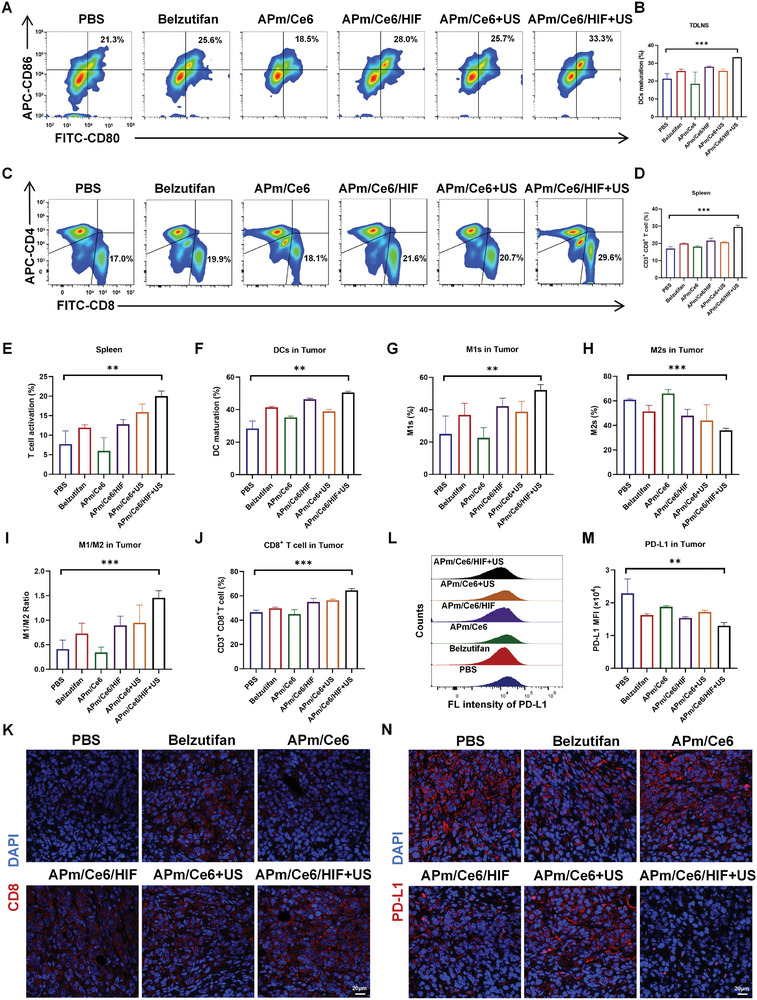
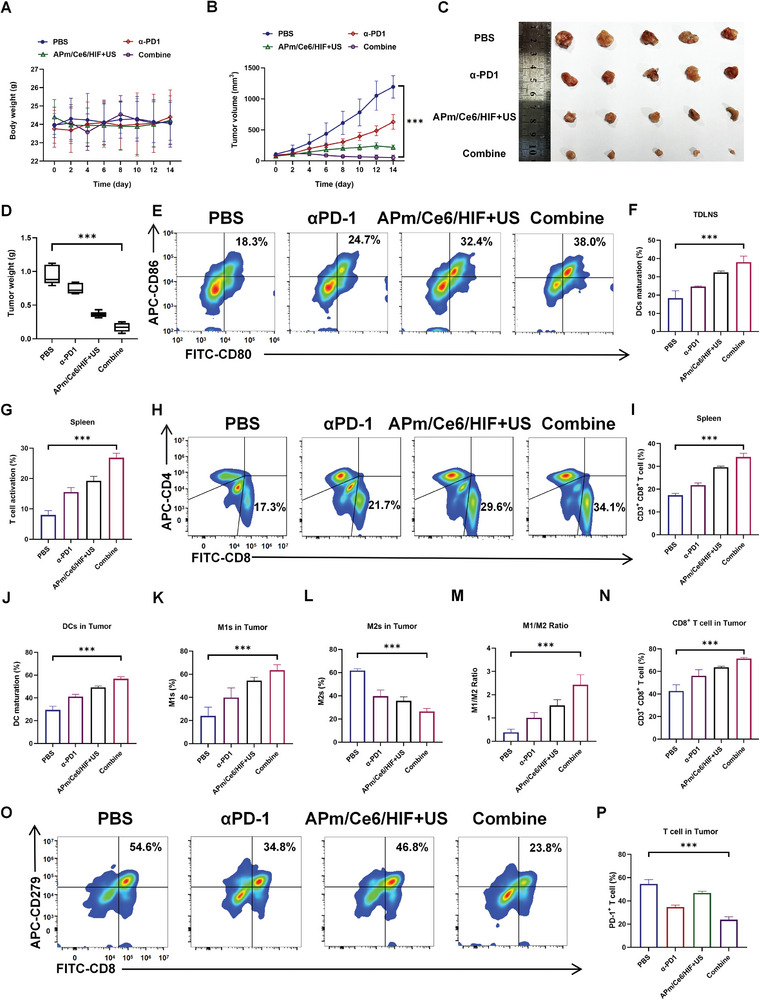
Immune checkpoint blockers (ICBs) therapy stands as the first-line treatment option for advanced renal cell carcinoma (RCC). However, its effectiveness is hindered by the immunosuppressive tumor microenvironment (TME). Sonodynamic therapy (SDT) generates tumor cell fragments that can prime the host's antitumor immunity. Nevertheless, the hypoxic microenvironment and upregulated autophagy following SDT often lead to cancer cell resistance. In response to these challenges, a hypoxia-responsive polymer (Poly(4,4'-azobisbenzenemethanol-PMDA)-mPEG5k, P-APm) encapsulating both a HIF-2α inhibitor (belzutifan) and the ultrasonic sensitize (Chlorin e6, Ce6) is designed, to create the nanoparticle APm/Ce6/HIF. APm/Ce6/HIF combined with ultrasound (US) significantly suppresses tumor growth and activates antitumor immunity in vivo. Moreover, this treatment effectively transforms the immunosuppressive microenvironment from "immune-cold" to "immune-hot", thereby enhancing the response to ICBs therapy. The findings indicate that APm/Ce6/HIF offers a synergistic approach combining targeted therapy with immunotherapy, providing new possibilities for treating RCC.

Keywords: HIF‐2α; immunotherapy; renal cell carcinoma; sonodynamic therapy.


Conflict of interest statement

The authors declare no conflict of interest.

Figures

Figure 1
Figure 1
Belzutifan sensitizes tumor cells to SDT via inhibition of HIF‐2α which correlates with the treatment outcome in RCC patients. A) Synthesis of P‐APm. B) The preparation of APm/Ce6 and APm/Ce6/HIF. C) Schematic illustration of APm/Ce6/HIF therapy in vivo. Initially, APm/Ce6/HIF is taken up by renal carcinoma cells. Subsequently, APm/Ce6/HIF rapidly degrade in the hypoxic TME, releasing belzutifan and Ce6. The released belzutifan effectively suppresses tumor growth by targeting hypoxia and autophagy signaling pathways. Furthermore, Ce6 enhances SDT, significantly increasing the generation of ROS and resulting in the release of damage‐associated molecular patterns (DAMPs), such as calreticulin (CRT) and high mobility group box 1 (HMGB1), thereby inducing dendritic cells maturation, promoting the T‐cell infiltration, increasing the transformation of M2 macrophages to M1 macrophages in the tumor immune microenvironment and decreasing the programmed cell death protein ligand 1 (PD‐L1) expression. Thus, the response rates of APm/Ce6/HIF+US combined αPD‐1 improve. D) The expression of HIF‐2α in 532 renal tumors from the TCGA dataset and 161 normal renal tissues from the GTEx dataset were analyzed via the ACLBI website. E) The expression distribution of immune checkpoints gene in tumor tissues and normal tissues. The abscissa represents different groups of samples, and the ordinate represents the expression distribution of genes, different colors represent different groups. F) Prediction of potential immunotherapy response using the TIDE algorithm. Top: Statistical table of immune responses in different groups of predicted results; bottom: Distribution of immune response scores in different groups of predicted results, where different colors represent expression trends in different samples. The significance of two groups of samples is tested by the Wilcoxon test. ***p < 0.001, ****p < 0.0001.
Figure 2
Figure 2
Characterization and cell uptake of APm/Ce6 and APm/Ce6/HIF. A) TEM was performed to characterize the APm/Ce6/HIF. Scale bar: 100 nm. B‐D) DLS was performed to measure the particle size and potential of APm/Ce6 and APm/Ce6/HIF (D: n = 3). E) UV absorption of APm/Ce6 and APm/Ce6/HIF. F) DLS was used to detect the particle size of APm/Ce6 and APm/Ce6/HIF at different time points. G) HPLC was used to analyze the release of APm/Ce6 and APm/Ce6/HIF in the presence of Na2S2O4. H) ESR was used to verify the generation of hydroxyl radicals by APm/Ce6/HIF under the action of ultrasound. I–J) FCM was used to verify the cell uptake of APm/Cy5.5 at different time points (J: n = 3). K) CLSM was used to visualize the cell uptake of APm/Cy5.5 at 7 h. Scale bar: 10 µm. Data are presented as mean ± SD. Statistical significance was calculated by one‐way analysis of variance. ***p < 0.001.
Figure 3
Figure 3
The antitumor activity of APm/Ce6/HIF in vitro. A) Intracellular ROS generation of 786‐O cells treated with various treatments by CLSM. B, C) ROS generation of 786‐O cells treated with various treatments and the corresponding quantification of ROS generation by FCM (C: n = 3). D, E) In vitro cytotoxicity of different treatments on 786‐O and A498 cells for 24 h (n = 3). F) Colony formation assay was used to detect the effect of different treatments on colony formation of 786‐O cells. G, H) Apoptosis rate of 786‐O cells treated with various treatments by FCM (G: n = 3). I) Live and dead cells of 786‐O cells stained with Calcein‐AM (green, alive) and PI (red, dead) were analyzed by CLSM. Scale bar: 100 µm. Data are presented as mean ± SD. Statistical significance was calculated by one‐way analysis of variance. ***p < 0.001.
Figure 4
Figure 4
APm/Ce6/HIF+US inhibited the proliferation of renal cancer cells by inhibiting hypoxia and autophagy signaling pathways. A) The expression of HIF‐2α in 786‐O cells treated with various treatments by western blot. B) The expression of HIF‐2α in 786‐O cells treated with various treatments by CLSM (red: HIF‐2α, blue: DAPI). Scale bar: 10 µm. C) The expression of P62 and LC3 I/II in 786‐O cells treated with various treatments by western blot. D) The expression of LC3 in 786‐O cells treated with various treatments by CLSM (red: LC3, green: ACTIN, blue: DAPI). Scale bar: 10 µm. E) The autophagosome and autophagolysosomes of 786‐O cells treated with various treatments by TEM (red arrows refer to autophagosome and autophagolysosomes). Scale bar: 2 µm. F) Intracellular autophagy of 786‐O cells treated with various treatments by CLSM. Scale bar: 5 µm.
Figure 5
Figure 5
APm/Ce6/HIF+US induced immunogenic cell death of renal cancer cells in vitro. A) The expression of CRT in 786‐O cells treated with various treatments by CLSM (CRT: green, ACTIN: red, DAPI: blue). Scale bar: 10 µm. B,C) The expression of CRT in 786‐O cells treated with various treatments by FCM (C: n = 3). D) The expression of HMGB1 in 786‐O cells treated with various treatments by CLSM (HMGB1: red, ACTIN: green, DAPI: blue). Scale bar: 10 µm. E,F) CD11C, CD80, and CD86 expression on BMDCs after various treatments (E: n = 3). G,H) The expression of PD‐L1 in 786‐O cells treated with various treatments by FCM (H: n = 3). Data are presented as mean ± SD. Statistical significance was calculated by one‐way analysis of variance. **p < 0.01, ***p < 0.001.
Figure 6
Figure 6
Biodistribution and antitumor efficacy of APm/Ce6/HIF in vivo. A) Schematic illustration of tumor model establishment, biodistribution, and treatment scheme. B) Quantification of fluorescence intensity of tumor after intravenous injection of APm/Cy7.5 at different times (IVIS, spectral CT, PerkinElmer, Ex/Em = 745 nm/840 nm). C) Fluorescence images of major organs 48 h after intravenous injection of APm/Cy7.5 by IVIS. D) Quantification of fluorescence intensity of tumor after intravenous injection of APm/Cy7.5 at different times (n = 5, IVIS, spectral CT, PerkinElmer, Ex/Em = 745 nm/840 nm). E) Mean fluorescence intensity of organs after 48 h of intravenous injection of APm/Cy7.5 by IVIS (n = 5). F) The weight of mice treated with PBS, belzutifan, APm/Ce6, APm/Ce6/HIF, APm/Ce6+US and APm/Ce6/HIF+US (n = 5). G) Curve of tumor growth of mice treated with various treatments (n = 5). H, I) Tumor images and corresponding tumor weight of mice treated with various treatments (n = 5). J) H&E staining of tumor tissue. Scale bar: 100 µm. K) Immunofluorescence analysis of HIF‐2α expression in cells of tumor tissue of mice treated with various treatments by CLSM. Scale bar: 20 µm. Data are presented as mean ± SD. Statistical significance was calculated by one‐way analysis of variance. *p < 0.05, ***p < 0.001.
Figure 7
Figure 7
APm/Ce6/HIF+US reprograms the TME to activate antitumor immunity. A,B) The maturation of DCs (CD11C+ CD80+ CD86+) in TDLNs of mice treated with various treatments was detected by FCM (n = 5). C,D) The percentage of cytotoxic T lymphocytes (CD3+ CD8+) in the spleen of mice treated with various treatments was detected by FCM (n = 5). E) The percentage of T cell activation (CD3+ CD8+ CD69+) in the spleen of mice treated with various treatments was detected by FCM (n = 5). F) The percentage of mature DCs (CD11C+ CD80+ CD86+) in tumors of mice treated with various treatments were detected by FCM (n = 5). G–I) The percentage of M1 (F4/80+ CD80+) and M2 (F4/80+ CD206+) macrophages and their population in tumors of mice treated with various treatments were detected by FCM (n = 5). J) The percentage of cytotoxic T lymphocytes (CD3+ CD8+) in tumors of mice treated with various treatments were detected by FCM (n = 5). K) The expression of CD8 in T cells in tumor tissue of mice treated with various treatments was detected by CLSM. Scale bar: 20 µm. L,M) The expression of PD‐L1 (CD274+) in cancer cells of mice treated with various treatments was detected by FCM (n = 5). N) The expression of PD‐L1 in tumor tissue of mice treated with various treatments was detected by CLSM. Scale bar: 20 µm. Data are presented as mean ± SD. Statistical significance was calculated by one‐way analysis of variance. **p < 0.01, ***p < 0.001.
Figure 8
Figure 8
APm/Ce6/HIF+US combined with αPD‐1 synergistically enhances anticancer efficacy. A) The weight of mice treated with PBS, αPD‐1, APm/Ce6/HIF+US, and αPD‐1+APm/Ce6/HIF+US (n = 5). B–D) (B) Curve of tumor growth of mice treated with various treatments, (C) tumor images, and (D) tumor weight of mice treated with various treatments (n = 5). E,F) The percentage of DCs (CD11C+ CD80+ CD86+) in TDLNs of mice treated with various treatments was detected by FCM (n = 5). G) The percentage of T cell activation in the spleen of mice treated with various treatments was detected by FCM (n = 5). H,I) The percentage of cytotoxic T lymphocytes in the spleen of mice treated with various treatments was detected by FCM (n = 5). J) The percentage of mature DCs (CD11C+ CD80+ CD86+) in tumors of mice treated with various treatments were detected by FCM (n = 5). K–M) Histogram depicting the percentage of (K) M1 (F4/80+ CD80+) and (L) M2 (F4/80+ CD206+) macrophages in tumors after various treatments were detected by FCM and their (M) proportional relationship. N) Histogram depicting the percentage of cytotoxic T lymphocytes (CD3+ CD8+) in tumors after various treatments were detected by FCM (n = 5). O,P) The expression of PD‐1 (CD3+ CD8+ CD279+) on the surface of infiltrating T cells in tumors after various treatments was detected by FCM (n = 5). Data are presented as mean ± SD. Statistical significance was calculated by one‐way analysis of variance. ***p < 0.001.

Similar articles

Cited by

References

    1. Siegel R. L., Miller K. D., Wagle N. S., Jemal A., CA Cancer J. Clin. 2023, 73, 17. - PubMed
    1. Choueiri T. K., Powles T., Albiges L., Burotto M., Szczylik C., Zurawski B., Yanez Ruiz E., Maruzzo M., Suarez Zaizar A., Fein L. E., Schutz F. A., Heng D. Y. C., Wang F., Mataveli F., Chang Y. L., van Kooten Losio M., Suarez C., Motzer R. J., N. Engl. J. Med. 2023, 388, 1767. - PMC - PubMed
    1. Bukavina L., Bensalah K., Bray F., Carlo M., Challacombe B., Karam J A., Kassouf W., Mitchell T., Montironi R., O'Brien T., Panebianco V., Scelo G., Shuch B., van Poppel H., Blosser C D., Psutka S P., Eur. Urol. 2022, 82, 529. - PubMed
    1. a) Yan X. Q., Ye M. J., Zou Q., Chen P., He Z. S., Wu B., He D. L., He C. H., Xue X. Y., Ji Z. G., Chen H., Zhang S., Liu Y. P., Zhang X. D., Fu C., Xu D. F., Qiu M. X., Lv J. J., Huang J., Ren X. B., Cheng Y., Qin W. J., Zhang X., Zhou F. J., Ma L. L., Guo J. M., Ding D. G., Wei S. Z., He Y., Guo H. Q., et al., Ann. Oncol. 2024, 35, 190; - PubMed
    2. b) Peng Y. L., Xiong L. B., Zhou Z. H., Ning K., Li Z., Wu Z. S., Deng M. H., Wei W. S., Wang N., Zou X. P., He Z. S., Huang J. W., Luo J. H., Liu J. Y., Jia N., Cao Y., Han H., Guo S. J., Dong P., Yu C. P., Zhou F. J., Zhang Z. L., J. Immunother. Cancer 2022, 10, e004206. - PMC - PubMed
    1. a) Atkins M. B., Jegede O. A., Haas N. B., McDermott D. F., Bilen M. A., Stein M., Sosman J. A., Alter R., Plimack E. R., Ornstein M., Hurwitz M., Peace D. J., Signoretti S., Denize T., Cimadamore A., Wu C. J., Braun D., Einstein D., Catalano P. J., Hammers H., J. Clin. Oncol. 2022, 40, 2913; - PMC - PubMed
    2. b) Pal S. K., McGregor B., Suárez C., Tsao C. K., Kelly W., Vaishampayan U., Pagliaro L., Maughan B. L., Loriot Y., Castellano D., Srinivas S., McKay R. R., Dreicer R., Hutson T., Dubey S., Werneke S., Panneerselvam A., Curran D., Scheffold C., Choueiri T. K., Agarwal N., J. Clin. Oncol. 2021, 39, 3725; - PMC - PubMed
    3. c) McDermott D. F., Lee J. L., Bjarnason G. A., Larkin J. M. G., Gafanov R. A., Kochenderfer M. D., Jensen N. V., Donskov F., Malik J., Poprach A., Tykodi S. S., Alonso‐Gordoa T., Cho D. C., Geertsen P. F., Climent Duran M. A., DiSimone C., Silverman R. K., Perini R. F., Schloss C., Atkins M B., J. Clin. Oncol. 2021, 39, 1020. - PMC - PubMed

Substances