. 2025;103(8):725-741.
doi: 10.1159/000541874. Epub 2024 Oct 11.

MUC17 Is a Potential New Prognostic Biomarker and Promotes Pancreatic Cancer Progression in Obstructive Jaundice

Affiliations

MUC17 Is a Potential New Prognostic Biomarker and Promotes Pancreatic Cancer Progression in Obstructive Jaundice

Eleonóra Gál et al. Oncology. 2025.

Abstract

Introduction: Our working group has previously shown that bile acids (BAs) accelerate carcinogenic processes in pancreatic cancer (PC) in which mucin 4 (MUC4) expression has a central role. However, the role of other mucins in PC is less clear, especially in bile-induced cancer progression. The study aim was to investigate expression of MUC17 in BA- or human serum-treated pancreatic ductal adenocarcinoma (PDAC) cell lines.

Methods: Different cell-based assays with RNA silencing/overexpression were used to study the role of MUC17 in cancer progression. Protein expression of MUC17 was evaluated in 55 human pancreatic samples by immunohistochemistry, and Kaplan-Meier survival analysis was used to compare survival curves.

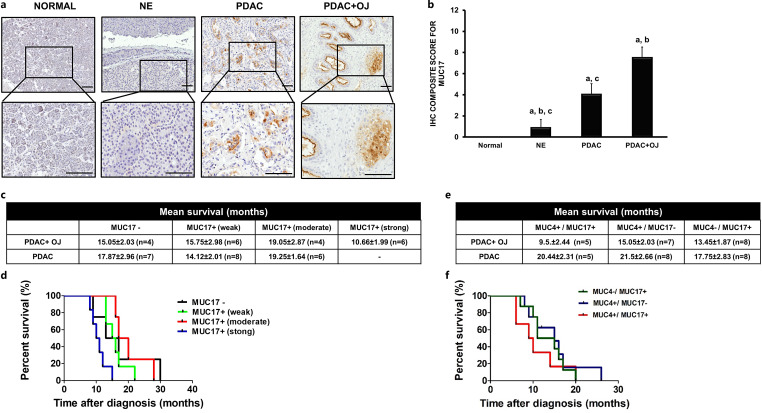
Results: Expression of MUC17 increased in PDAC patients, especially in obstructive jaundice (OJ), and the elevated MUC17 expression associated with poorer overall survival (10.66 ± 1.99 vs. 15.05 ± 2.03 months; log-rank: 0.0497). Treatment of Capan-1 and AsPC-1 cells with BAs or with human serum obtained from PDAC + OJ patients enhanced the expression of MUC17, as well as the proliferative potential of the cells, whereas knockdown of MUC17 alone or in combination with MUC4 decreased BAs-induced carcinogenic processes.

Conclusion: Our results demonstrated that MUC17 has a central role in bile-induced PC progression, and in addition to MUC4, this isoform also can be used as a novel prognostic biomarker.

Keywords: Bile acids; MUC17; MUC4; Obstructive jaundice; Pancreatic cancer.


Conflict of interest statement

The authors have no conflicts of interest to declare.

Figures

Fig. 1.
Fig. 1.
Expression of MUC4 and -17 in human pancreatic samples and survival curves of PDAC patients. a Representative immunohistochemical stainings show the presence of MUC17 in human pancreatic samples. Scale bar represents 100 µm. b Composite scores of human pancreatic samples stained with anti-MUC17 antibody. Data represent the mean ± SEM of 23–25 specimens/4–21 patients each group. ap ≤ 0.05 versus normal, bp ≤ 0.05 versus PDAC, cp ≤ 0.05 versus PDAC+OJ. Median survival (c, e) and survival curves (d, f) of PDAC+OJ patients. e MUC17– versus MUC17 weak/moderate/strong staining log-rank: 0.635, 0.932 and 0.049, respectively. f MUC4+/MUC17+ versus MUC4–/MUC17+, log-rank: 0.4268; MUC4+/MUC17+ versus MUC4+/MUC17–, log-rank: 0.04378; MUC4–/MUC17+ versus MUC4+/MUC17–, log-rank: 0.5672. PDAC, pancreatic ductal adenocarcinoma; OJ, obstructive jaundice; NET, neuroendocrine tumor.
Fig. 2.
Fig. 2.
Effects of BA treatment on the mRNA and protein expression of mucins in pancreatic ductal cells. Capan-1 and AsPC-1 cells treated with human serum obtained from healthy volunteers and PDAC patients (a) and with different bile acids (BAs) (b) for 24, 48, and 72 h, and the relative gene expressions of MUC17 were investigated by real-time polymerase chain reaction. Red dashed line indicates significance (see Materials and Methods). c Representative immunofluorescence staining of Capan-1 and AsPC-1 cells shows the expression of MUC17 after the treatment with taurochenodeoxycholic acid (TCDCA; 500 μm) for 24, 48, and 72 h. Scale bar represents 100 µm. d Quantification of MUC17 protein expression. Specimens were scanned by an Olympus IX83-based system, and DAB staining intensities were analyzed by ImageJ software. Data represent the mean ± SEM of three independent experiments. ap ≤ 0.05 versus control. e Representative Western blots of MUC17 protein expression in Capan-1 and AsPC-1 cells shows the expression of MUC17 after the treatment with TCDCA (500 μm) for 72 h. GAPDH was used as a loading control. f Quantification of the results normalized to control and reported as the mean ± SEM of four independent experiments; ap ≤ 0.05 versus Control. g Cluster analysis and dendrogram show the difference between the effect of BA treatment at different concentrations and time points on MUC4 and MUC17 expression. Blue/orange and white colors indicate high and low expression, respectively. Values represent the fold change in the gene expression level of MUC genes. Data represent the mean ± SEM of three independent experiments. GCA, glycocholic acid; TCA, taurocholic acid; GDCA, glycodeoxycholic acid; TDCA, taurodeoxycholic acid; GCDCA, glycochenodeoxycholic acid; TCDCA, taurochenodeoxycholic acid; au, arbitrary unit.
Fig. 3.
Fig. 3.
Knockdown of MUC4 and -17 in Capan-1 and AsPC-1 cells. a Expression levels of MUC4 and -17 were investigated by reverse transcription-polymerase chain reaction and ICC in the control cells and cells treated with specific siRNAs. Scale bar represents 50 µm. Capan-1 and AsPC-1 cells were treated with taurochenodeoxycholic acid (TCDCA; 500 μm), and the rates of proliferation (b) and adhesion (c) were determined at 24, 48, and 72 h, whereas migration (d) was determined at 72 h. Data represent the mean ± SEM of three independent experiments. ap ≤ 0.05 versus Control, bp ≤ 0.05 versus Abs ctrl. Abs ctrl, absolute control; TCDCA, taurochenodeoxycholic acid.
Fig. 4.
Fig. 4.
Effects of MUC4 and -17 knockdown on the colony forming of Capan-1. Cells were exposed to taurochenodeoxycholic acid (TCDCA; 500 μm), and the colony forming ability of the cells was investigated by the clonogenic assay. a Representative pictures show the effect of MUC17 and MUC4/17 knockdown. Percentage of total area was determined 72 h after the TCDCA treatment. b For the classification and counting of the colonies, automatic Olympus cellSens Dimension software was used. Summary diagrams show the number of colonies. Data represent mean ± SEM of three, independent experiments. ap ≤ 0.05 versus Abs ctrl, bp ≤ 0.05 versus Ctrl. Abs ctrl, absolute control; TCDCA, taurochenodeoxycholic acid.
Fig. 5.
Fig. 5.
Effects of MUC17 overexpression on the proliferation of Capan-1 and AsPC-1 cells. a Expression levels of MUC17 were investigated by reverse transcription-polymerase chain reaction and ICC in the control cells and cells treated with specific miRNAs (miR20b). Scale bar represents 50 µm. b Capan-1 and AsPC-1 cells were treated with taurochenodeoxycholic acid (TCDCA; 500 μm), and the rates of proliferation were determined at 24 h. Data represent the mean ± SEM of three independent experiments. ap ≤ 0.05 versus Control.
Fig. 6.
Fig. 6.
Effect of BAs on Miapaca-2 and Panc-1 cells. a Expression levels of MUC4 and -17 was investigated by IHC. Scale bar represents 50 µm. The rates of viability (b), proliferation (c), and adhesion (d) were determined at 24, 48, and 72 h, whereas migration (e), invasion (f), and colony formation (g) at 72 h. g Measurement of the colonies was performed using an Olympus IX83 microscope-based screening platform (Olympus cellSense Dimension software, version 2.3). Data represent the mean ± SEM of three independent experiments. ap ≤ 0.05 versus Control. Scale bar: 50 µm. TCDCA, taurochenodeoxycholic acid; TRX, Triton-X-100; IHC, immunohistochemistry.
Fig. 7.
Fig. 7.
Effect of human serum on PDAC cell lines. Capan-1, AsPC-1, Miapaca-2, and Panc-1 cell lines were treated with human serum obtained from healthy volunteers and PDAC patients, and the rates of proliferation (a) and adhesion (b) were determined at 24, 48, and 72 h, whereas migration (c) at 72 h. Data represent the mean ± SEM of three independent experiments. ap ≤ 0.05 versus Control. PDAC, pancreatic ductal adenocarcinoma; OJ, obstructive jaundice.

Similar articles

References

    1. Huang J, Lok V, Ngai CH, Zhang L, Yuan J, Lao XQ, et al. Worldwide burden of, risk factors for, and trends in pancreatic cancer. Gastroenterology. 2021;160(3):744–54. - PubMed
    1. Sharma B, Twelker K, Nguyen C, Ellis S, Bhatia ND, Kuschner Z, et al. Bile acids in pancreatic carcinogenesis. Metabolites. 2024;14(7):348. - PMC - PubMed
    1. Corfield AP. Mucins: a biologically relevant glycan barrier in mucosal protection. Biochim Biophys Acta. 2015;1850(1):236–52. - PubMed
    1. Suh H, Pillai K, Morris DL. Mucins in pancreatic cancer: biological role, implications in carcinogenesis and applications in diagnosis and therapy. Am J Cancer Res. 2017;7(6):1372–83. - PMC - PubMed
    1. Wang S, You L, Dai M, Zhao Y. Mucins in pancreatic cancer: a well-established but promising family for diagnosis, prognosis and therapy. J Cell Mol Med. 2020;24(18):10279–89. - PMC - PubMed

MeSH terms