Review
. 2024 Oct 13;30(1):176.
doi: 10.1186/s10020-024-00930-8.

Co-regulation and synteny of GFM2 and NSA2 links ribosomal function in mitochondria and the cytosol with chronic kidney disease

Affiliations
Review

Co-regulation and synteny of GFM2 and NSA2 links ribosomal function in mitochondria and the cytosol with chronic kidney disease

Minjie Zhang et al. Mol Med. .

Abstract

Background: We previously reported aberrant expression of the cytosolic ribosomal biogenesis factor Nop-7-associated 2 (NSA2) in diabetic nephropathy, the latter also known to involve mitochondrial dysfunction, however the connections between NSA2, mitochondria and renal disease were unclear. In the current paper, we show that NSA2 expression is co-regulated with the GTP-dependent ribosome recycling factor mitochondrial 2 (GFM2) and provide a molecular link between cytosolic and mitochondrial ribosomal biogenesis with mitochondrial dysfunction in chronic kidney disease (CKD).

Methods: Human renal tubular cells (HK-2) were cultured (+/- zinc, or 5mM/20mM glucose). mRNA levels were quantified using real-time qPCR. Transcriptomics data were retrieved and analysed from Nakagawa chronic kidney disease (CKD) Dataset (GSE66494) and Kidney Precision Medicine Project (KPMP) ( https://atlas.kpmp.org/ ). Protein levels were determined by immunofluorescence and Western blotting. Cellular respiration was measured using Agilent Seahorse XF Analyzer. Data were analysed using one-way ANOVA, Students' t-test and Pearson correlation.

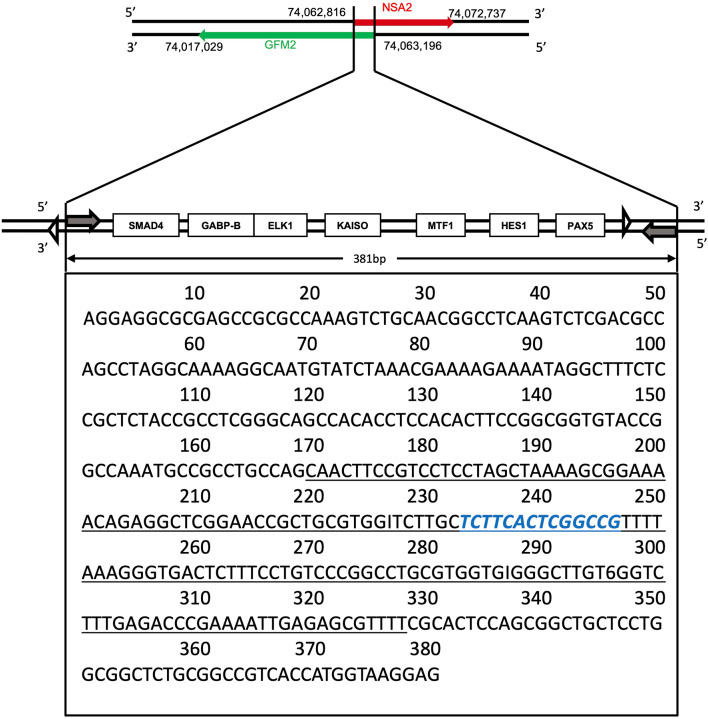
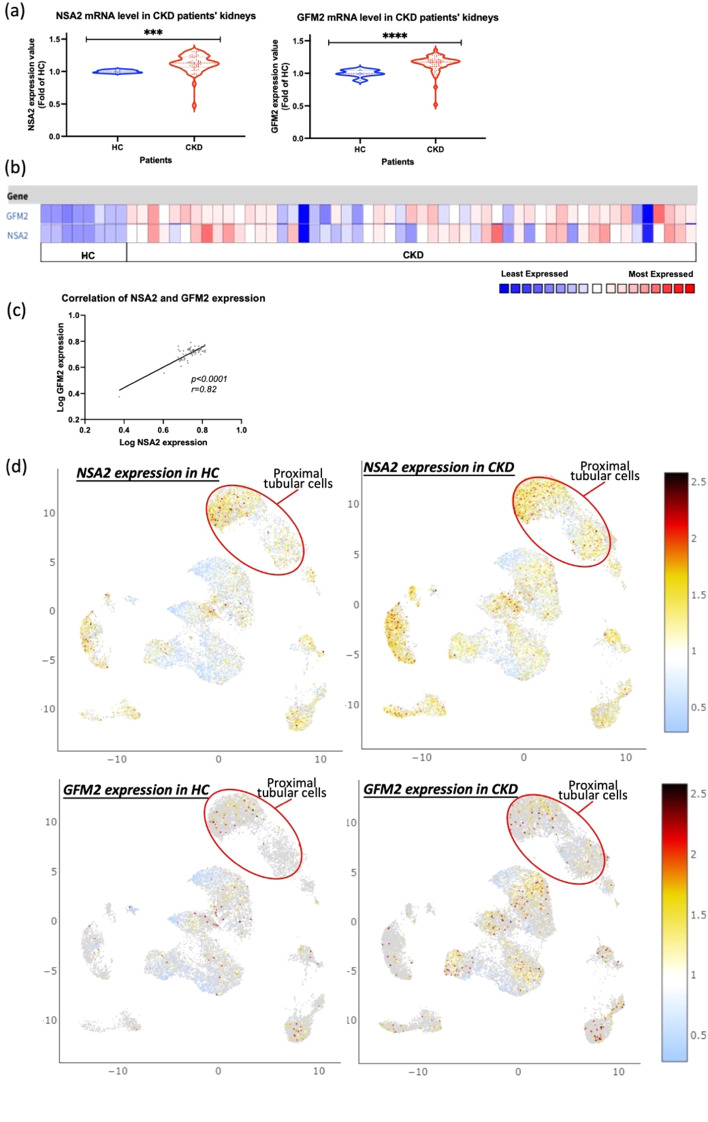
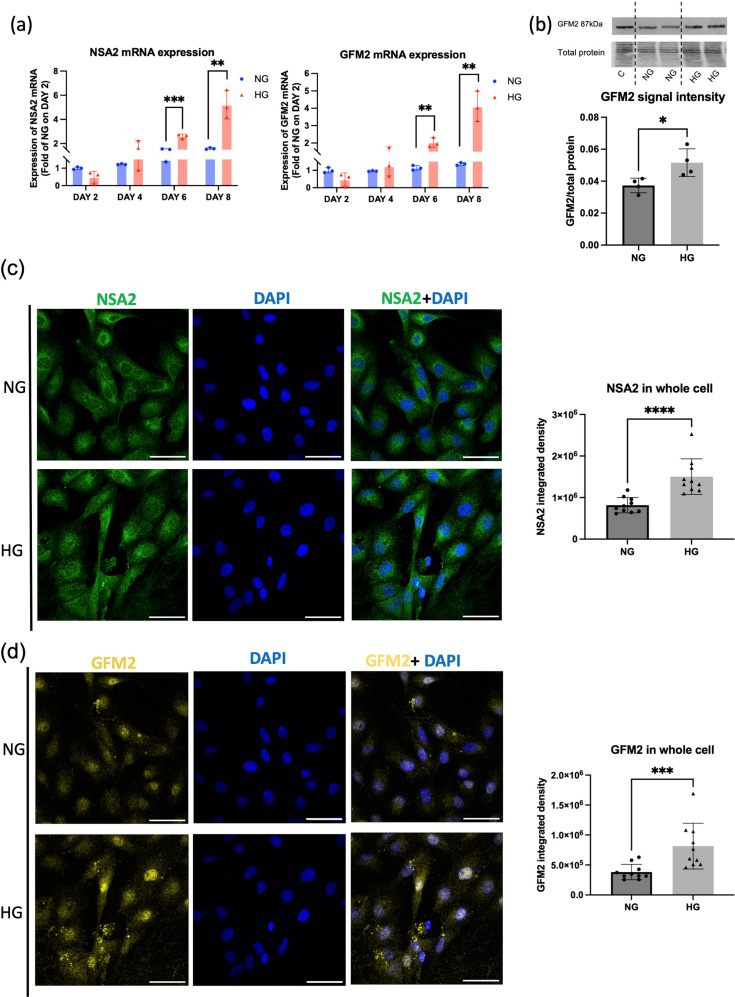
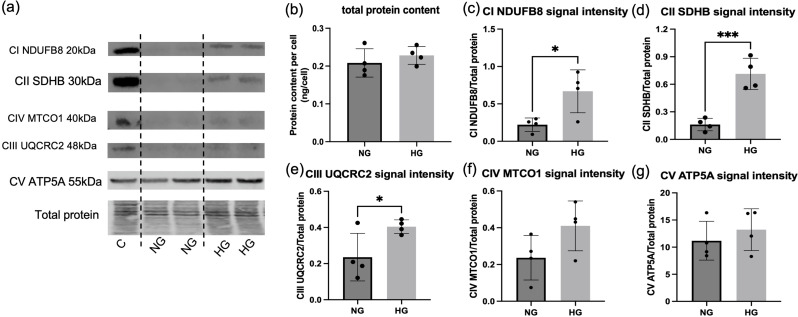
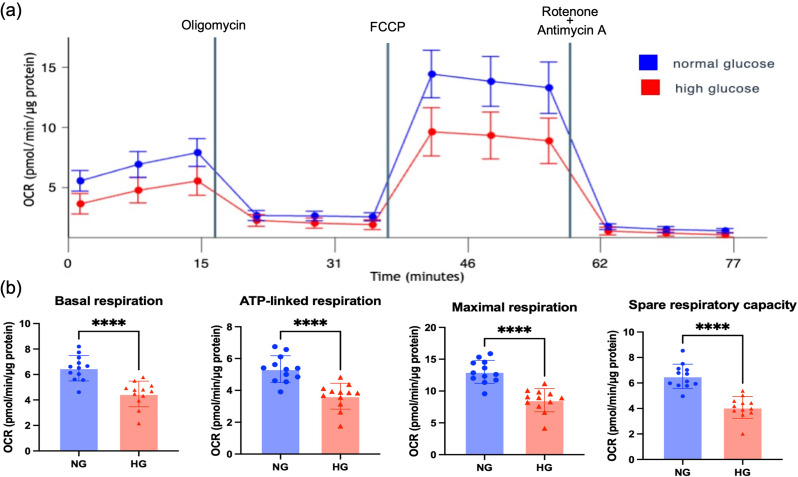
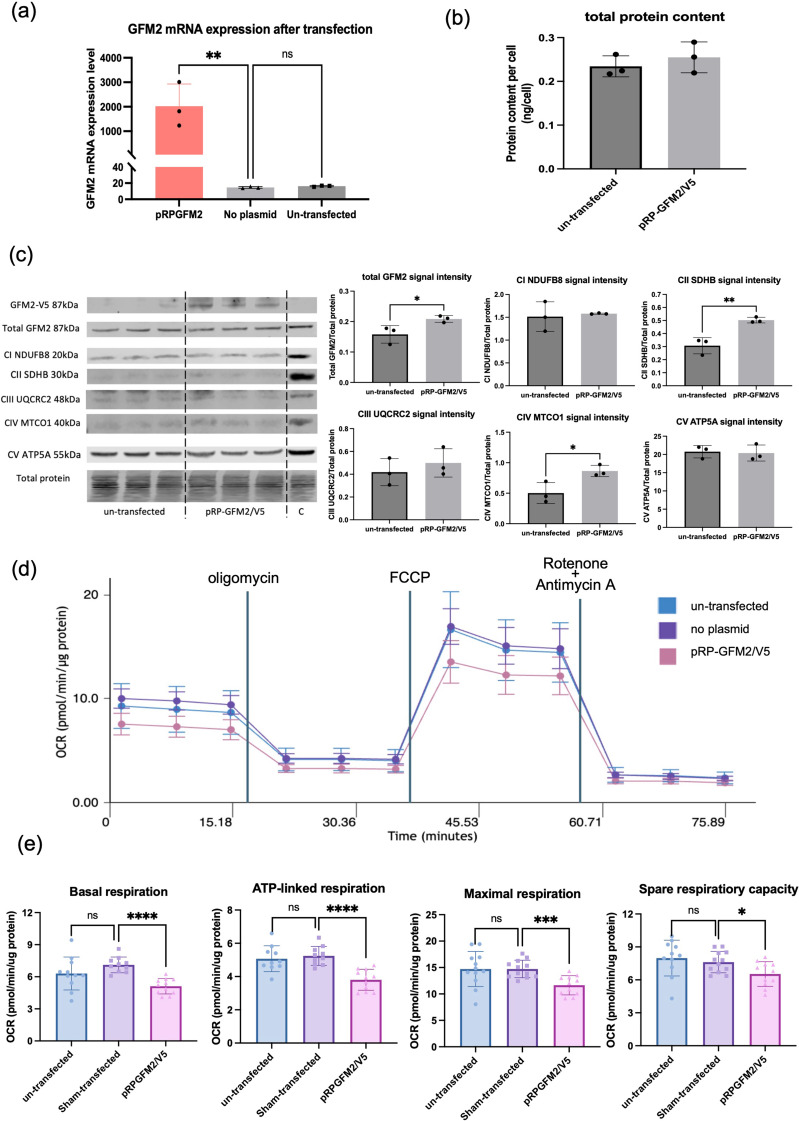
Results: The NSA2 gene, on human chromosome 5q13 was next to GFM2. The two genes were syntenic on opposite strands and orientation in multiple species. Their common 381 bp 5' region contained multiple transcription factor binding sites (TFBS) including the zinc-responsive transcription factor MTF1. NSA2 and GFM2 mRNAs showed a dose-dependent increase to zinc in-vitro and were highly expressed in proximal tubular cells in renal biopsies. CKD patients showed higher renal NSA2/GFM2 expression. In HK-2 cells, hyperglycaemia led to increased expression of both genes. The total cellular protein content remained unchanged, but GFM2 upregulation resulted in increased levels of several mitochondrial oxidative phosphorylation (OXPHOS) subunits. Furthermore, increased GFM2 expression, via transient transfection or hyperglycemia, correlated with decrease cellular respiration.

Conclusion: The highly conserved synteny of NSA2 and GFM2, their shared 5' region, and co-expression in-vitro and in CKD, shows they are co-regulated. Increased GFM2 affects mitochondrial function with a disconnect between an increase in certain mitochondrial respiratory proteins but a decrease in cellular respiration. These data link the regulation of 2 highly conserved genes, NSA2 and GFM2, connected to ribosomes in two different cellular compartments, cytosol and mitochondria, to kidney disease and shows that their dysregulation may be involved in mitochondrial dysfunction.

Keywords: Gene expression, diabetic nephropathy, chronic kidney disease, mitochondrial dysfunction; Mitochondria; NSA2; Protein synthesis; Ribosome biogenesis.


Conflict of interest statement

The authors declare no competing interests.

Figures

Fig. 1
Fig. 1
The 5’ region of NSA2 gene on human chromosome 5. The black double strands represent human chromosome 5, with the red arrow denoting the transcriptional directions of NSA2. On the opposite, the green arrow denotes the transcriptional directions of GFM2 at the 5’ side of NSA2. Numeric labels accompanying the double strands provide the exact locations of these genes on human chromosome 5. 381 bp 5’ overlapping region is magnified. NSA2 transcription initiation point (shaded arrow) and translation start codon (white triangle) are labelled on the upper strand, while those of GFM2 are shown on the bottom strand. Transcription factor binding sites (TFBS) distribution within the overlapping region are ordered based on their positions. The full-length conserved overlapping sequences between human and Macaca mulatta (monkey) are shown in the black box. The conserved region in humans, monkeys and mice is underlined. The conserved MTF1 binding site is in Blue. SMAD4, Mothers against decapentaplegic homolog 4; GABP-B, GA Binding Protein Transcription Factor Subunit Beta; ELK1, ETS Like-1; KAISO, Zinc Finger and BTB Domain Containing 33; MTF1, Metal Regulatory Transcription Factor 1; HES1, Hes Family BHLH Transcription Factor 1; PAX5, Paired Box Gene 5
Fig. 2
Fig. 2
The synteny of NSA2 and GFM2 in vertebrata species. The black lines in (a) and (b) represent sections of chromosomes that NSA2 and GFM2 are on, and the arrow shows the transcription direction from 5’ to 3’. The names of the species are labelled at the left top of each chromosome. The numbers represent the specific location of the genes. NSA2 and GFM2 are syntenic in multiple species (a) but not in catfish and zebrafish (b). The classification of the species is labelled on top of the square. The evolution tree (c) of the species involved in (a) and (b) was generated using Lifemap NCBI version. Ceratodontiformes lungfish appeared on Earth around 400 million years ago (Jorgensen and Joss 2010). Chr, chromosome
Fig. 3
Fig. 3
Co-regulation of NSA2 and GFM2 mRNA expression in patients with chronic kidney disease. (a) The mRNA expression value and correlation of NSA2 and GFM2 in human kidney biopsies between chronic kidney disease (CKD) and healthy control (HC) patients. The mRNA expression values of both genes were obtained from the Nakagawa chronic kidney disease (CKD) Kidney Dataset. The expression level is shown as fold change to HC. (b) The heat map of NSA2 and GFM2 in human kidney biopsies between CKD and HC patients. The low expression levels are shown in blue, and the high expression levels are in red. (c) The correlation of NSA2 and GFM2 in human kidney biopsies. The Pearson correlation efficiency r = 0.82, p < 0.0001. HC: n = 8. CKD: n = 45. Data Links: http://www.ncbi.nlm.nih.gov/geo/query/acc.cgi?acc=GSE66494 (d) Differential expression of NSA2 and GFM2 in kidney cell clusters from HC and CKD in Kidney Precision Medicine Project (KPMP) kidney tissue atlas. HC, n = 20. CKD, n = 15. Data link: https://atlas.kpmp.org/explorer/dataviz
Fig. 4
Fig. 4
Upregulation of NSA2 and GFM2 in HK-2 cells exposed to high glucose. NSA2 and GFM2 mRNA expression level fold changes in HK-2 exposed to normal (NG = 5mM glucose) or high glucose (HG = 20mM glucose). (a) The NSA2 and GFM2 mRNA expression levels were calculated as mRNA copy numbers relative to per 1000 GAPDH. The fold changes were normalized to the mRNA expression level in NG on Day 2. N = 3. (b) Western blot of GFM2 in HK-2 cells grown in NG and HG for 6 days. The same loading control (C) prepared from HEK293 cells was used in all westerns. The normalised signal of GFM2 protein was calculated as the ratio of the target band signal to the lane normalisation factor. Immunofluorescent staining of NSA2 (c) and GFM2 (d) in HK-2 cells exposed to NG and HG for 6 days. NSA2 protein was labelled using chicken anti-NSA2 primary antibody and goat anti-chicken Alexa Fluor® 488 secondary antibody (green). GFM2 protein was labelled using rabbit anti-GFM2 primary antibody and goat anti-rabbit Cyanine5 secondary antibody (yellow). Nucleus was stained using DAPI (blue). The scale bar represents 50 μm. The data were analysed using Students’ t-test. * p < 0.05, ** p < 0.01, *** p < 0.001, **** p < 0.0001.N = 10 for each group
Fig. 5
Fig. 5
Mitochondrial OXPHOS and cellular total protein content changes in HK-2 cells exposed to high glucose. (a) Western blot of 5 mitochondrial OXPHOS proteins in HK-2 cells grown in normal (NG = 5mM) and high glucose (HG = 20mM) for 6 days. Proteins in the loading control (C) were from HEK293 cells. (b) Total protein content in HK-2 cells in NG and HG. The total protein content was measured using Bicinchoninic acid assay. (c-g) Protein signal intensity of 5 mitochondrial OXPHOS proteins tested by Western blotting in HK-2 cells. The normalisation factor was determined as the ratio of the total protein signal for each lane to the signal from the loading control. The normalised signal of target proteins was calculated as the ratio of the target band signal to the lane normalisation factor. The data were analysed using Students’ t-test. * p < 0.05, ** p < 0.01, *** p < 0.001.N = 4. CI, Complex I; CII, Complex II; CIII, Complex III; CIV, Complex IV; CV, Complex V; NDUFB8, NADH dehydrogenase [ubiquinone] 1 beta subcomplex subunit 8; SDHB, Succinate Dehydrogenase Complex, Subunit B; MTCO1, Mitochondrially Encoded Cytochrome C Oxidase I; UQCRC2, Ubiquinol-Cytochrome C Reductase Core Protein 2; ATP5A, ATP Synthase F1 Subunit Alpha
Fig. 6
Fig. 6
Mitochondrial respiration changes in HK-2 cells exposed to high glucose. (a) Respiration profile of HK-2 cells cultured in normal glucose (NG = 5mM) or high glucose (HG = 20mM) media for 6 days. Cell oxygen respiration rate (OCR) was measured using Seahorse Analyser. After the measurement of basal respiration, the injection of Oligomycin can inhibit ATP synthase, thereby blocking ATP-linked respiration. FCCP can disrupt mitochondrial membrane potential and collapse the proton gradient, allowing the OCR to achieve its maximum level. The range between maximum and basal respiration levels reflects mitochondrial spare capacity. Rotenone and antimycin A are inhibitor of Complex I and III, which can completely shut down the mitochondrial respiration. (b) Changes of basal respiration, ATP-linked respiration, maximal respiration, and spare respiratory capacity in HK-2 cells cultured in NG or HG media. N = 12. The data were analysed using Students’ t-test. **** p < 0.0001
Fig. 7
Fig. 7
Mitochondrial OXPHOS and respiration changes in HK-2 cells with elevated GFM2 expression by transient transfection. (a) The mRNA expression of GFM2 in HK-2 cells after 24-hour transfection using pRP-GFM2/V5 plasmid. (b) Total protein content in pRP-GFM2/V5 plasmid transfected or un-transfected HK-2 cells. (c) Western blot of GFM2/V5 tag and OXPHOS proteins in HK-2 cells transfected with pRP-GFM2/V5 plasmid. Proteins in the loading control (C) were from HEK293 cells. The normalisation factor was determined as the ratio of the total protein signal for each lane to the signal from the loading control. The normalised signal of target proteins was calculated as the ratio of the target band signal to the lane normalisation factor. The data were analysed using Students’ t-test. * p < 0.05, ** p < 0.01.N = 3. (d) Respiration profile of un-transfected, Sham-transfected, and pRP-GFM2/V5 transfected HK-2 cells. Cell oxygen respiration rate (OCR) was measured using Seahorse Analyser as an indicator of mitochondrial respiration. (e) Changes of basal respiration, ATP-linked respiration, maximal respiration, and spare respiratory capacity in un-transfected, Sham-transfected, and pRP-GFM2/V5 transfected HK-2 cells. Un-transfected, HK-2 cells grown without transfection reagents and plasmids. Sham-transfected, HK-2 cells grown with transfected reagents but no plasmids. N = 12. The data were analysed using one-way ONOVA. ns p > 0.05, *p < 0.05, *** p < 0.001, **** p < 0.0001

Similar articles

Cited by

References

    1. Alimujiang M, Yu X, Yu M, Hou W, Yan Z, Yang Y, et al. Enhanced liver but not muscle OXPHOS in diabetes and reduced glucose output by complex I inhibition. J Cell Mol Med. 2020;24(10):5758–71. - PMC - PubMed
    1. Alsaad KO, Herzenberg AM. Distinguishing diabetic nephropathy from other causes of glomerulosclerosis: an update. J Clin Pathol. 2007;60(1):18–26. - PMC - PubMed
    1. Arnone JT, Robbins-Pianka A, Arace JR, Kass-Gergi S, McAlear MA. The adjacent positioning of co-regulated gene pairs is widely conserved across eukaryotes. BMC Genomics. 2012;13(1):546. - PMC - PubMed
    1. Balamurugan K, Egli D, Selvaraj A, Zhang B, Georgiev O, Schaffner W. Metal-responsive transcription factor (MTF-1) and heavy metal stress response in Drosophila and mammalian cells: a functional comparison. Biol Chem. 2004;385(7):597–603. - PubMed
    1. Boczonadi V and Horvath R. Mitochondria. Impaired mitochondrial translation in human disease. Int J Biochem Cell Biology. 2014;48(1):77–84. - PMC - PubMed

Substances

LinkOut - more resources