

Association between body fat variation rate and risk of diabetic nephropathy - a posthoc analysis based on ACCORD database
- PMID: 39396960
- PMCID: PMC11472532
- DOI: 10.1186/s12889-024-20317-y
Association between body fat variation rate and risk of diabetic nephropathy - a posthoc analysis based on ACCORD database
Abstract
Background: Weight control has consistently been regarded as a significant preventive measure against diabetic nephropathy. however, the potential impact of substantial fluctuations in body fat during this process on the risk of diabetic nephropathy remains uncertain. This study aimed to investigate the association between body fat variation rate and diabetic nephropathy incident in American patients with type 2 diabetes.
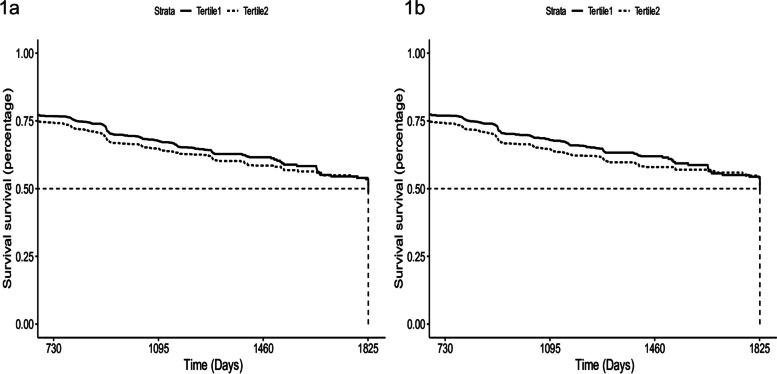
Methods: The study used data from the Action to Control Cardiovascular Risk in diabetes (ACCORD) trial to calculate body fat variation rates over two years and divided participants into Low and High groups. The hazard ratio and 95% confidence interval were estimated using a Cox proportional hazards model, and confounding variables were addressed using propensity score matching.
Results: Four thousand six hundred nine participants with type 2 diabetes were studied, with 1,511 cases of diabetic nephropathy observed over 5 years. High body fat variation rate was linked to a higher risk of diabetic nephropathy compared to low body fat variation rate (HR 1.13, 95% CI 1.01-1.26). Statistically significant interaction was observed between body fat variation rate and BMI (P interaction = 0.008), and high level of body fat variation rate was only associated with increased risk of diabetic nephropathy in participants with BMI > 30 (HR 1.34 and 95% CI 1.08-1.66).
Conclusions: Among participants with Type 2 Diabetes Mellitus, body fat variation rate was associated with increased risk of diabetic nephropathy. Furthermore, the association was modified by BMI, and positive association was demonstrated in obese but not non-obese individuals. Consequently, for obese patients with diabetes, a more gradual weight loss strategy is recommended to prevent drastic fluctuations in body fat.
Trial registration: Clinical Trials. gov, no. NCT000000620 (Registration Date 199909).
Trial registration: ClinicalTrials.gov NCT00000620.
Keywords: Body composition; Body fat variation rate; Diabetic nephropathy; Obesity; Type 2 Diabetes.
© 2024. The Author(s).
Conflict of interest statement
The authors declare no competing interests.
Figures

Similar articles
-
Association of Predicted Lean Body Mass and Fat Mass With Incident Diabetic Nephropathy in Participants With Type 2 Diabetes Mellitus: A Post Hoc Analysis of ACCORD Trial.Front Endocrinol (Lausanne). 2021 Oct 27;12:719666. doi: 10.3389/fendo.2021.719666. eCollection 2021. Front Endocrinol (Lausanne). 2021. PMID: 34777240 Free PMC article.
-
Anthropometric Measures and Incident Diabetic Nephropathy in Participants With Type 2 Diabetes Mellitus.Front Endocrinol (Lausanne). 2021 Aug 4;12:706845. doi: 10.3389/fendo.2021.706845. eCollection 2021. Front Endocrinol (Lausanne). 2021. PMID: 34421824 Free PMC article. Clinical Trial.
-
[Correlation between weight variability and the risk of diabetic nephropathy in patients with type 2 diabetes mellitus].Zhonghua Yi Xue Za Zhi. 2024 Mar 12;104(10):742-750. doi: 10.3760/cma.j.cn112137-20230724-00081. Zhonghua Yi Xue Za Zhi. 2024. PMID: 38462354 Chinese.
-
Treatment of diabetic nephropathy with angiotensin II receptor antagonist.Clin Exp Nephrol. 2003 Mar;7(1):1-8. doi: 10.1007/s101570300000. Clin Exp Nephrol. 2003. PMID: 14586737 Review.
-
Prognostic factors for the development and progression of proliferative diabetic retinopathy in people with diabetic retinopathy.Cochrane Database Syst Rev. 2023 Feb 22;2(2):CD013775. doi: 10.1002/14651858.CD013775.pub2. Cochrane Database Syst Rev. 2023. PMID: 36815723 Free PMC article. Review.
Cited by
-
The Obesity-Related Indices Are Useful for Predicting Diabetic Nephropathy in Patients With Type II Diabetes Mellitus: A Retrospective Cohort Study of NHANES.Endocrinol Diabetes Metab. 2025 Sep;8(5):e70087. doi: 10.1002/edm2.70087. Endocrinol Diabetes Metab. 2025. PMID: 40781847 Free PMC article.
-
Causal insights into major risk factors for diabetic kidney disease: a comprehensive meta-analysis and Mendelian randomization study.Ren Fail. 2025 Dec;47(1):2468741. doi: 10.1080/0886022X.2025.2468741. Epub 2025 Feb 26. Ren Fail. 2025. PMID: 40012233 Free PMC article.
References
-
- Bommer C, Sagalova V, Heesemann E, Manne-Goehler J, Atun R, Bärnighausen T, et al. Global economic burden of diabetes in adults: projections from 2015 to 2030. Diabetes Care. 2018;41(5):963–70. 10.2337/dc17-1962. - PubMed
-
- Ioannou K. Diabetic nephropathy: is it always there? Assumptions, weaknesses and pitfalls in the diagnosis. Horm (Athens). 2017;16(4):351–61. 10.14310/horm.2002.1755. - PubMed
-
- Lee DH, Keum N, Hu FB, Orav EJ, Rimm EB, Willett WC, et al. Comparison of the association of predicted fat mass, body mass index, and other obesity indicators with type 2 diabetes risk: two large prospective studies in US men and women. Eur J Epidemiol. 2018;33(11):1113–23. 10.1007/s10654-018-0433-5. - PubMed
Publication types
MeSH terms
Associated data
Grants and funding
LinkOut - more resources
Full Text Sources
Medical
