. 2024 Oct 14;22(1):458.
doi: 10.1186/s12916-024-03672-w.

Serum lipidome reveals lipid metabolic dysregulation in severe fever with thrombocytopenia syndrome

Affiliations

Serum lipidome reveals lipid metabolic dysregulation in severe fever with thrombocytopenia syndrome

Shuai Guo et al. BMC Med. .

Abstract

Background: Severe fever with thrombocytopenia syndrome (SFTS) is a rapidly progressing infectious disease with a high fatality rate caused by a novel bunyavirus (SFTSV). The role of lipids in viral infections is well-documented; however, the specific alterations in lipid metabolism during SFTSV infection remain elusive. This study aims to elucidate the lipid metabolic dysregulations in the early stages of SFTS patients.

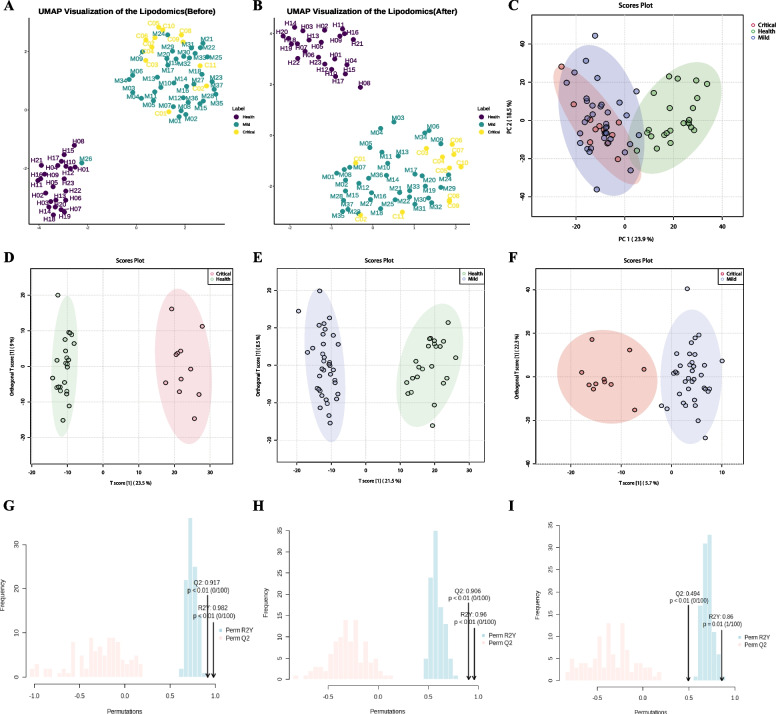
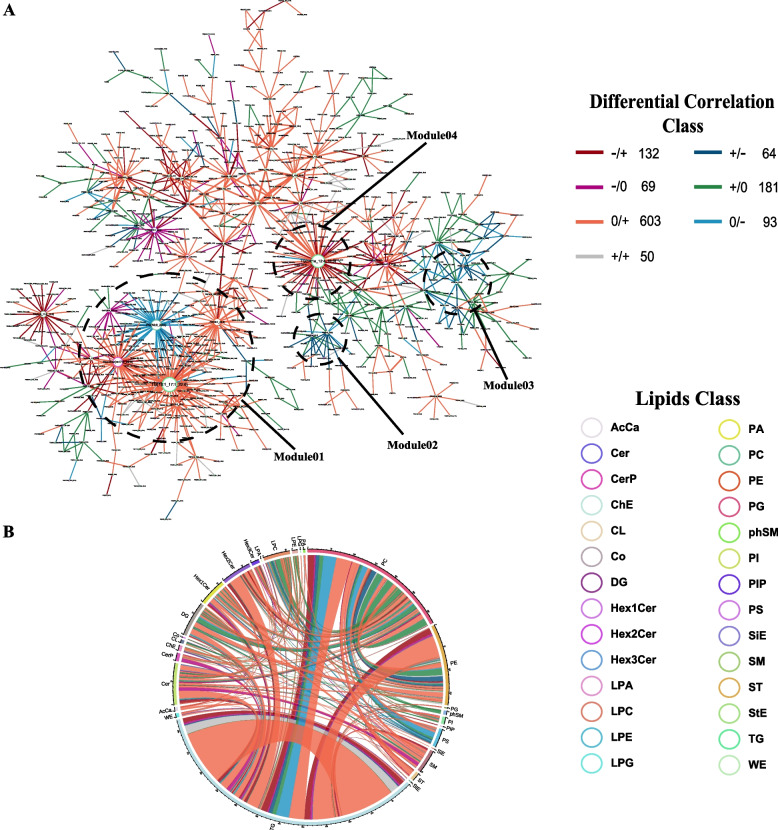
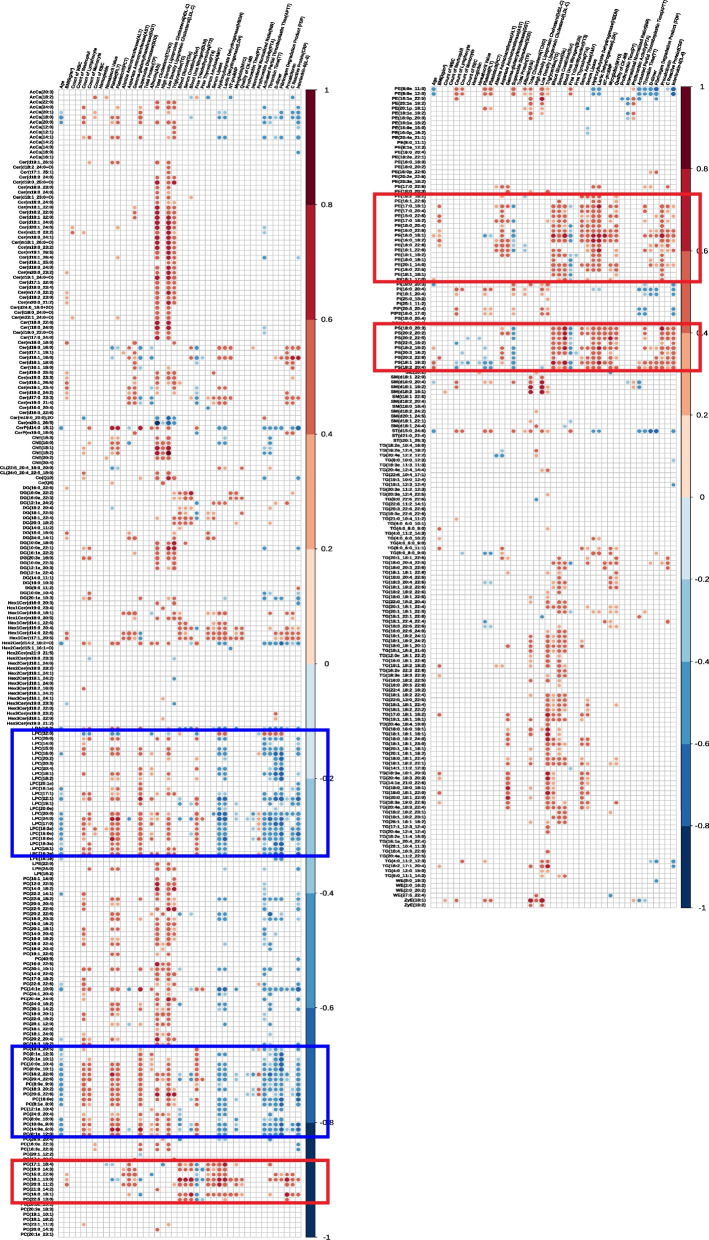
Methods: This study prospectively collected peripheral blood sera from 11 critical SFTS patients, 37 mild SFTS patients, and 23 healthy controls during the early stages of infection for lipidomics analysis. A systematic bioinformatics analysis was conducted from three aspects integrating lipid differential expressions, lipid differential correlations, and lipid-clinical indices correlations to reveal the serum lipid metabolic dysregulation in SFTSV-infected individuals.

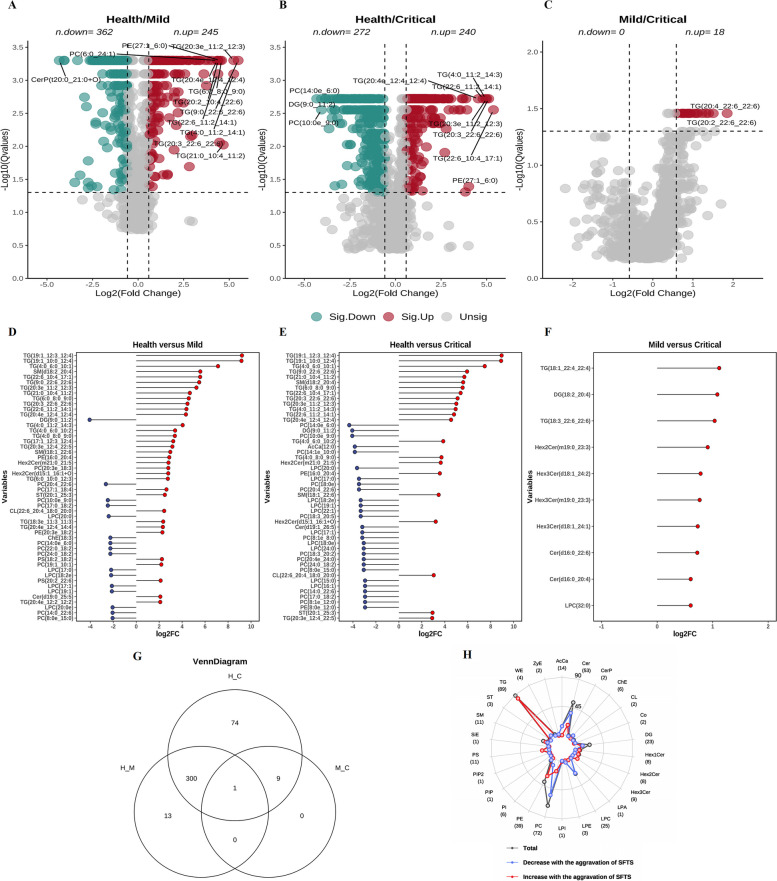
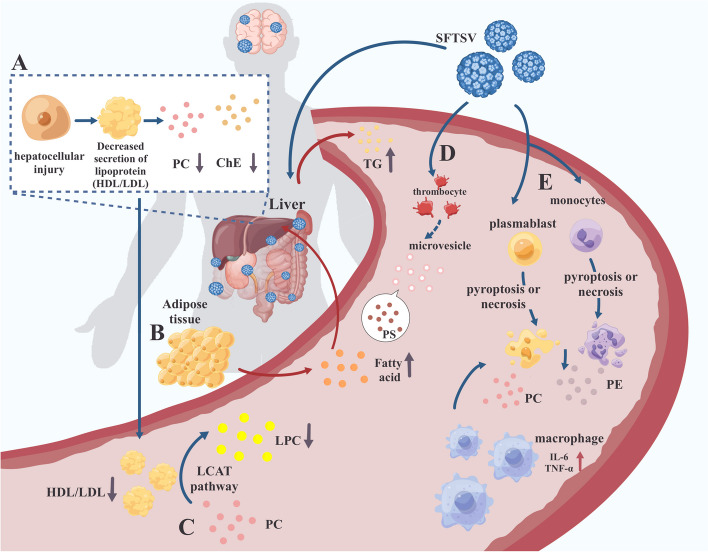
Results: Our findings reveal significant lipid metabolic dysregulation in SFTS patients. Specifically, compared to healthy controls, SFTS patients exhibited three distinct modes of lipid differential expression: increased levels of lipids including phosphatidylserine (PS), hexosylceramide (HexCer), and triglycerides (TG); decreased levels of lipids including lysophosphatidylcholine (LPC), acylcarnitine (AcCa), and cholesterol esters (ChE); and lipids showing "dual changes" including phosphatidylcholine (PC) and phosphatidylethanolamine (PE). Finally, based on lipid metabolic pathways and literature analysis, we systematically elucidated the potential mechanisms underlying lipid metabolic dysregulation in the early stage of SFTSV infection.

Conclusions: Our study presents the first global serum lipidome profile and reveals the lipid metabolic dysregulation patterns in the early stage of SFTSV infection. These findings provide a new basis for the diagnosis, treatment, and further investigation of the disease.

Keywords: Lipid; Lipidomics; Novel bunyavirus; SFTS.


Conflict of interest statement

The authors declare no competing interests.

Figures

Fig. 1
Fig. 1
Clustering analysis of lipidomics between different groups. AB Uniform Manifold Approximation and Projection (UMAP) was utilized for the analysis of lipidomic profiles. In A, sample M26 emerges as a notable outlier. Subsequently, B displays the UMAP landscape after the removal of the outlier, sample M26, illustrating the normalized distribution of the remaining samples. C The PCA score plot, depicted in a two-dimensional format, compares lipidomic profiles across three distinct groups, offering insights into their variance and similarity. DF The OPLS-DA score plot further delineates the lipidomic differences among the three groups, emphasizing the discriminatory power of the lipid profiles in distinguishing between health states. GI The robustness and predictive accuracy of the OPLS-DA models are validated through 1000 permutation tests. Specifically: G demonstrates a Q2 of 0.906 and an R2Y of 0.960, indicating a strong model performance between groups H versus M. H reveals a Q2 of 0.917 and an R2Y of 0.982, indicating a stronger model performance between groups H versus C. I shows a Q2 of 0.494 and an R2Y of 0.86, indicating moderate model efficacy between groups M versus C
Fig. 2
Fig. 2
Differential lipidome profiling across various groups. AC showcase volcano plots that illustrate the differential lipid species between groups, where the x-axis denotes the log2 fold change (log2FC) and the y-axis represents the negative logarithm (base 10) of the Q-value (-log10[Qvalue]). Green dots denote lipid species that are significantly decreased, whereas red dots indicate those that are significantly increased. DF presents the top 50 differential lipids identified across three groups, with blue marking the down-regulated and red highlighting the up-regulated significantly differential lipids. G displays a Venn diagram that delineates the lipid species selection process following mfuzz clustering. H employs a radar map to demonstrate the numbers of lipid subclasses that undergo significant changes as the disease progresses. The overall count of significantly altered lipid species within each subclass is traced by a dark gray line and annotated in parentheses alongside each subclass label around the radar map’s perimeter. Increases and decreases in lipid numbers are illustrated with red and blue lines, respectively
Fig. 3
Fig. 3
Differential correlation analysis. Lipid pairs with significant differential correlations (q-value < 0.05) were included. Sign/sign indicates the direction in control/mild SFTS, and the number that follows indicates the number of lipid pairs in the global networks exhibiting this pattern of change. For instance, the dark red line − / + 132 in the upper legend of the global networks indicates that the correlation between two connected lipid pairs is negative ( −) in health, and becomes positive ( +) in mild SFTS patients. A total of 132 lipid pairs connected by dark red lines in the global network displayed this pattern of change (− / +). There is a total of 7 differential correlation patterns marked with different colors. A Differential Correlation Network. Four modules (module 1–module 4) of biological interest are circled for emphatical discussion. B Chord diagram. The chord diagram displayed all lipid pairs from the differential correlation network on the subclass level
Fig. 4
Fig. 4
Lipids-clinical indices correlations in SFTS patients. The plots illustrate Spearman correlations between lipids and clinical indices. The p-value is corrected by Storey-Tibshiran method to obtain the q-value. Only correlations with q-value < 0.05 are indicated with colored circles. Negative correlations are shown in blue and positive correlations were shown in red, with color intensity indicating the magnitude of correlations. Two boxes with different colors are framed to show lipid species with similar clinical indicators correlations. The blue box contains LPC and some PCs, while the red box contains PS, some PEs, and some PCs
Fig. 5
Fig. 5
Summary of lipid metabolic dysregulation during SFTSV infection. A SFTSV infection triggers hepatic dysfunction, leading to a reduction in lipoprotein levels, which subsequently causes a decrease in phosphatidylcholine (PC) and cholesteryl esters (ChE) in serum. B The infection accelerates the mobilization of adipose tissue, releasing a significant amount of fatty acids. These excessive fatty acids prompt the liver to synthesize triglycerides (TG) and secrete very-low-density lipoproteins (VLDL) into the bloodstream for TG transport. C A decrease in serum high-density lipoprotein (HDL) levels results in a reduced synthesis of lysophosphatidylcholine (LPC) via the lecithin-cholesterol acyltransferase (LCAT) pathway. D SFTSV infection leads to platelet activation, which in turn releases microvesicles with high levels of phosphatidylserine (PS) on their surface. E Pyroptosis or necrosis of infected cells compromises membrane integrity, leading to the release of membrane lipids, mainly PC and phosphatidylethanolamine (PE), and cellular contents. This event triggers an inflammatory response

Similar articles

Cited by

References

    1. Liu Q, He B, Huang SY, Wei F, Zhu XQ. Severe fever with thrombocytopenia syndrome, an emerging tick-borne zoonosis. Lancet Infect Dis. 2014;14(8):763–72. - PubMed
    1. Li H, Lu QB, Xing B, Zhang SF, Liu K, Du J, Li XK, Cui N, Yang ZD, Wang LY, et al. Epidemiological and clinical features of laboratory-diagnosed severe fever with thrombocytopenia syndrome in China, 2011–17: a prospective observational study. Lancet Infect Dis. 2018;18(10):1127–37. - PubMed
    1. Yu XJ, Liang MF, Zhang SY, Liu Y, Li JD, Sun YL, Zhang L, Zhang QF, Popov VL, Li C, et al. Fever with thrombocytopenia associated with a novel bunyavirus in China. N Engl J Med. 2011;364(16):1523–32. - PMC - PubMed
    1. Kim YR, Yun Y, Bae SG, Park D, Kim S, Lee JM, Cho NH, Kim YS, Lee KH. Severe Fever with Thrombocytopenia Syndrome Virus Infection, South Korea, 2010. Emerg Infect Dis. 2018;24(11):2103–5. - PMC - PubMed
    1. Rattanakomol P, Khongwichit S, Linsuwanon P, Lee KH, Vongpunsawad S, Poovorawan Y. Severe Fever with Thrombocytopenia Syndrome Virus Infection, Thailand, 2019–2020. Emerg Infect Dis. 2022;28(12):2572–4. - PMC - PubMed

Publication types

LinkOut - more resources