. 2024 Oct 13;15(1):8836.
doi: 10.1038/s41467-024-53201-9.

Sustainability synergies and trade-offs considering circularity and land availability for bioplastics production in Brazil

Affiliations

Sustainability synergies and trade-offs considering circularity and land availability for bioplastics production in Brazil

Guilherme Pessoa Nogueira et al. Nat Commun. .

Abstract

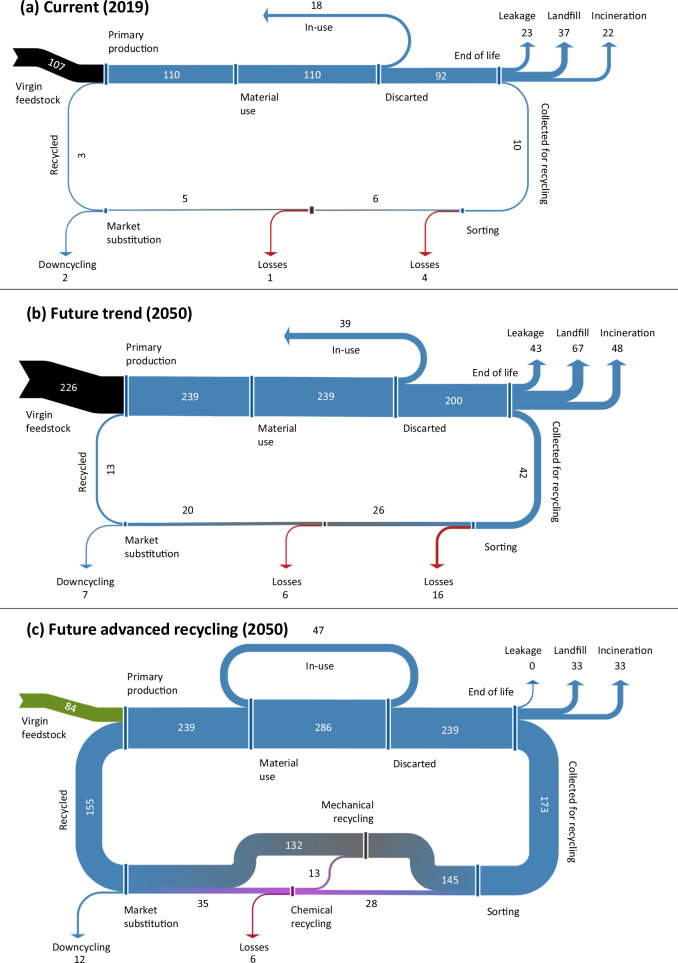
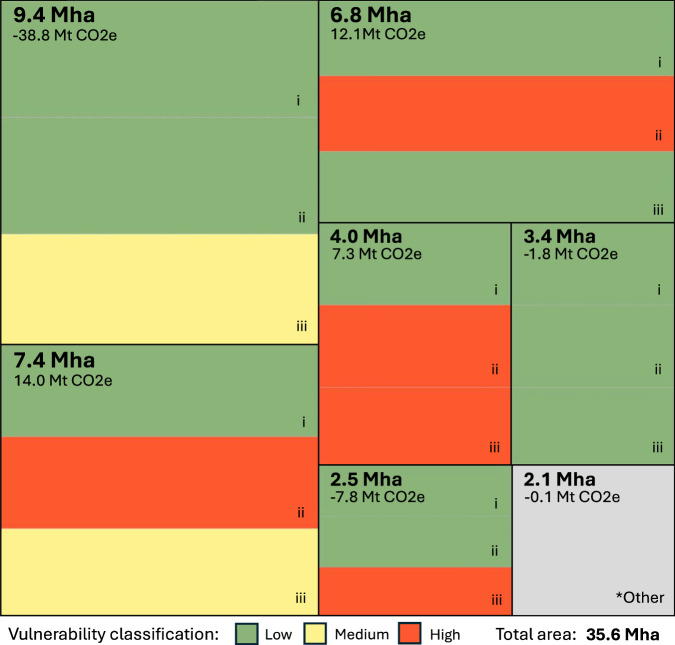
Alongside the concerns of waste management, plastic production represents a future problem for managing greenhouse gas emissions. Advanced recycling and bio-based production are paramount to face this challenge. The sustainability of bio-based polyethylene (bioPE) depends on the feedstock, avoiding stress on natural resources. This work discusses Brazil's potential to meet future global bioPE demand by 2050, using sugarcane as feedstock and considering environmental sustainability for production expansion. From the assessed 35.6 Mha, 3.55 Mha would be exempt from trade-offs related to land use change (dLUC), biodiversity, and water availability. The scenario with the highest circularity efficiency would require 22.2 Mha to meet the global demand, which can be accommodated in areas with positive impacts in carbon stocks, neutral impacts in water availability, and medium impacts on biodiversity. Here, we show that dropping demand is essential to avoid trade-offs and help consolidate bioPE as a sustainable alternative for future net-zero strategies.


Conflict of interest statement

The authors declare no competing interests.

Figures

Fig. 1
Fig. 1. Life-cycle emissions composition for polyethylene (PE) value chain across different scenarios.
PE carbon footprint includes production, recycling, end of life and carbon stock, considering scenarios of simple and advanced recycling and 1G and 1G2G technologies for ethanol production (functional unit = 1 kg of PE in use).
Fig. 2
Fig. 2. Annual value chain mass flows, in Mt, for polyethylene demand supply considering different scenarios.
Virgin feedstock required, recycling and end of life composition vary for current (2019) (a), future trend (2050) (b) and future advanced recycling (2050) (c) scenarios.
Fig. 3
Fig. 3. Spatially explicit assessment of sugarcane expansion.
Within each 30 m-pixel across the expansion area, the classes for the three defined criteria (water scarcity vulnerability, carbon stock change and biodiversity loss vulnerability) were established and used to estimate synergy area through crossing the green classes.
Fig. 4
Fig. 4. Area and GHG emissions from carbon stock change for the criteria-crossing-combinations in the sugarcane expansion area.
Each box represents a combination and is divided into 3 parts, one for each criterion (water scarcity vulnerability (i), carbon stock change (ii), and biodiversity loss vulnerability (iii)) with the corresponding vulnerability classification (low, medium and high). Dimensions are proportional to the area and the remaining combinations were grouped into the last box (*Other).
Fig. 5
Fig. 5. Life cycle emissions profile for bioPE value-chain over the sorted area of expansion across different scenarios.
Scenarios include 1 G – Simple Recycling (a), 1 G – Advanced Recycling (b), 1 G2G – Simple Recycling (c) and 1 G2G – Advanced recycling (d), all for 2050. 1 G (first generation) and 1G2G (first and second generation) are different technologies for ethanol production. The GHG emissions balance includes production, mechanical recycling (Mech. Recyc), chemical recycling (Chem. Recyc), end of life, direct land use change (dLUC) and bioPE carbon stock. Area required to meet the bioPE demand for each scenario are shown in the vertical lines, and area required for Scenario 1G – Simple Recycling is not reached.
Fig. 6
Fig. 6. Supply and integration arrangements for bioPE production using different ethanol technologies for expansion.
Expansions considered using first generation (1G) ethanol mills (a) or first and second generation (1G2G) ethanol mills (b).

References

    1. Geyer, R., Jambeck, J. R. & Law, K. L. Production, use, and fate of all plastics ever made. Sci. Adv.3, 3–8 (2017). - PMC - PubMed
    1. Carus, M., Dammer, L., Raschka, A. & Skoczinski, P. Renewable carbon: key to a sustainable and future‐oriented chemical and plastic industry: definition, strategy, measures and potential. Greenh. Gases Sci. Technol.10, 488–505 (2020).
    1. Rosenboom, J.-G., Langer, R. & Traverso, G. Bioplastics for a circular economy. Nat. Rev. Mater.7, 117–137 (2022). - PMC - PubMed
    1. Meys, R. et al. Achieving net-zero greenhouse gas emission plastics by a circular carbon economy. Science374, 71–76 (2021). - PubMed
    1. Shen, M. et al (Micro)plastic crisis: Un-ignorable contribution to global greenhouse gas emissions and climate change. J. Clean. Prod.254, 130138 (2020).

Publication types

LinkOut - more resources